CAT 2024 Slot 3 Question Paper
The table given below shows the amount, in grams, of carbohydrate, protein, fat and all other nutrients, per 100 grams of nutrients in seven food grains. The first column shows the food grain category and the second column its codename. The table has some missing values.

The following additional facts are known.
1. Both the pseudo-cereals had higher amounts of carbohydrate as well as higher amounts of protein than any millet.
2. Both the cereals had higher amounts of carbohydrate than any pseudo-cereal.
3. All the missing values of carbohydrate amounts (in grams) for all the food grains are non-zero multiples of 5.
4. All the missing values of protein, fat and other nutrients amounts (in grams) for all the food grains are non-zero multiples of 4.
5. P1 contained double the amount of protein that M3 contains.
CAT 2024 Slot 3 - Question 31
How many grams of protein were there in 100 grams of nutrients in M2?
789
456
123
0.-
Clear All
CAT 2024 Slot 3 - Question 32
How many grams of other nutrients were there in 100 grams of nutrients in M3?
789
456
123
0.-
Clear All
CAT 2024 Slot 3 - Question 33
What is the median of the number of grams of protein in 100 grams of nutrients among these food grains?
789
456
123
0.-
Clear All
Comprehension:
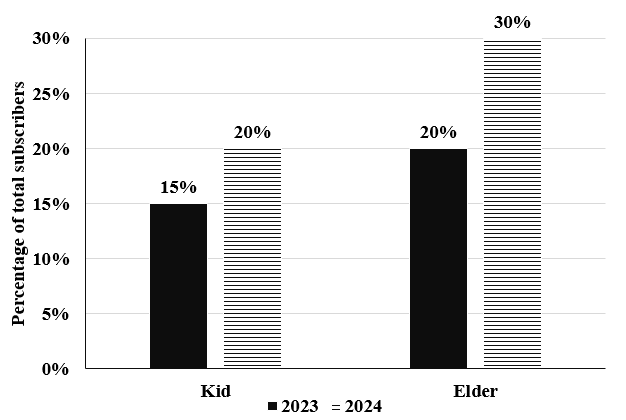
Over the top (OTT) subscribers of a platform are segregated into three categories: i) Kid, ii)Elder, and iii) Others. Some of the subscribers used one app and the others used multiple apps to access the platform. The figure below shows the percentage of the total number of subscribers in 2023 and 2024 who belong to the ‘Kid’ and ‘Elder’ categories.

The following additional facts are known about the numbers of subscribers.
1. The total number of subscribers increased by 10% from 2023 to 2024.
2. In 2024, 1/2 of the subscribers from the ‘Kid’ category and 2/3 of the subscribers from the ‘Elder’ category subscribers use one app.
3. In 2023, the number of subscribers from the ‘Kid’ category who used multiple apps was the same as the number of subscribers from the ‘Elder’ category who used one app.
4. 10,000 subscribers from the ‘Kid’ category used one app and 15,000 subscribers from the ‘Elder’ category used multiple apps in 2023.
CAT 2024 Slot 3 - Question 34
How many subscribers belonged to the ‘Others’ category in 2024?
CAT 2024 Slot 3 - Question 35
What percentage of subscribers in the ‘Kid’ category used multiple apps in 2023?
CAT 2024 Slot 3 - Question 36
What was the percentage increase in the number of subscribers in the ‘Elder’ categoryfrom 2023 to 2024?
CAT 2024 Slot 3 - Question 37
What could be the minimum percentage of subscribers who used multiple apps in 2024?
Out of 10 countries -- Country 1 through Country 10 -- Country 9 has the highest gross domestic product (GDP), and Country 10 has the highest GDP per capita. GDP per capita is the GDP of a country divided by its population. The table below provides the following data about Country 1 through Country 8 for the year 2024.
• Column 1 gives the country's identity.
• Column 2 gives the country’s GDP as a fraction of the GDP of Country 9.
• Column 3 gives the country’s GDP per capita as a fraction of the GDP per capita of Country10.
• Column 4 gives the country’s annual GDP growth rate.
• Column 5 gives the country’s annual population growth rate.

Assume that the GDP growth rates and population growth rates of the countries will remain constant for the next three years.
CAT 2024 Slot 3 - Question 38
Which one among the countries 1 through 8, has the smallest population in 2024?
CAT 2024 Slot 3 - Question 39
The ratio of Country 4’s GDP to Country 5’s GDP in 2026 will be closest to
CAT 2024 Slot 3 - Question 40
Which one among the countries 1, 4, 5, and 7 will have the largest population in 2027?
CAT Quant Questions | CAT Quantitative Ability
CAT DILR Questions | LRDI Questions For CAT
CAT Verbal Ability Questions | VARC Questions For CAT
Also Read
Frequently Asked Questions
You can download the CAT 2024 Slot 3 Question Paper PDF with detailed answers and solutions from Cracku.
Yes, every question in the CAT 2024 Slot 3 paper has step-by-step video solutions for better understanding.
It helps you practice real exam questions, understand difficulty levels, and improve speed and accuracy.
Yes, you can download CAT 2024 Slot 1, Slot 2, and Slot 3 papers in PDF format for complete preparation.
Yes, the solutions and video explanations include simple tricks and smart methods to solve questions quickly.tion.


