In 2000, what was the ratio of the number of dead males to dead females among those being tracked?
Sign in
Please select an account to continue using cracku.in
↓ →
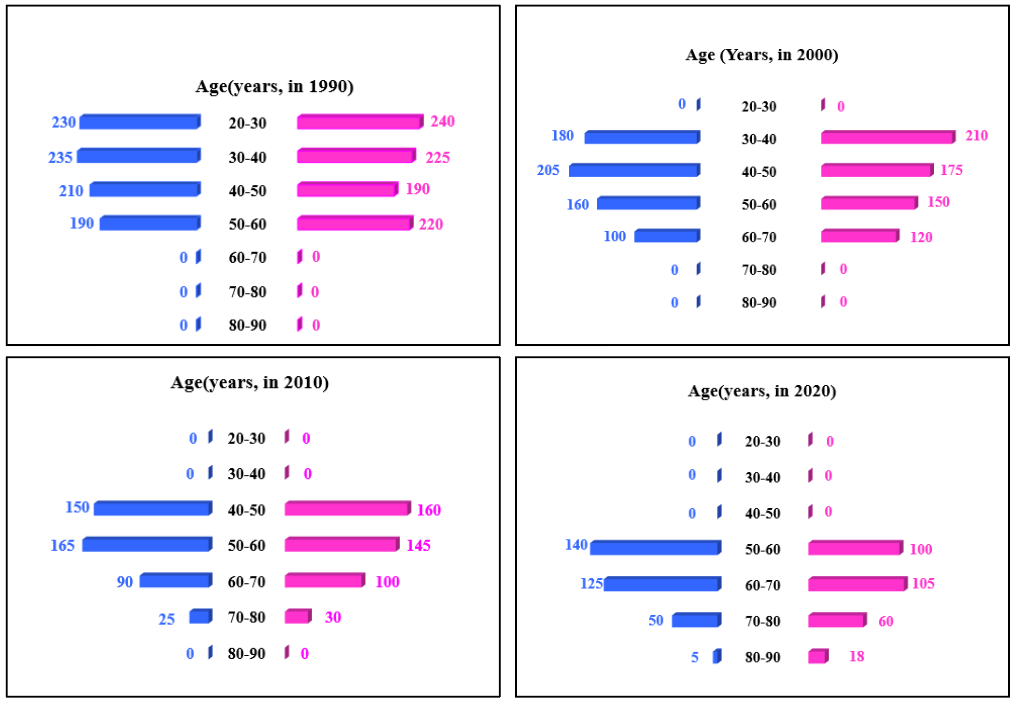
In the following, a year corresponds to 1st of January of that year.
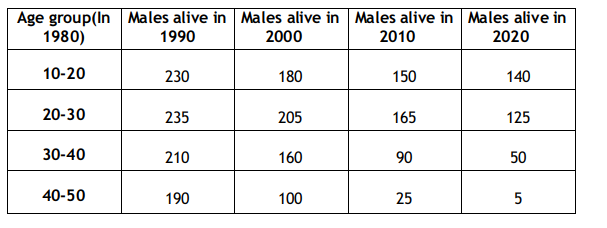
A study to determine the mortality rate for a disease began in 1980. The study chose 1000 males and 1000 females and followed them for forty years or until they died, whichever came first. The 1000 males chosen in 1980 consisted of 250 each of ages 10 to less than 20, 20 to less than 30, 30 to less than 40, and 40 to less than 50. The 1000 females chosen in 1980 also consisted of 250 each of ages 10 to less than 20, 20 to less than 30, 30 to less than 40,and 40 to less than 50.
The four figures below depict the age profile of those among the 2000 individuals who were still alive in 1990, 2000, 2010, and 2020. The blue bars in each figure represent the number of males in each age group at that point in time, while the pink bars represent the number of females in each age group at that point in time. The numbers next to the bars give the exact numbers being represented by the bars. For example, we know that 230 males among those tracked and who were alive in 1990 were aged between 20 and 30.
In 2000, what was the ratio of the number of dead males to dead females among those being tracked?
The total number of male and female test cases in 1980 = 1000
The total number of males alive in 2000 = 180 + 205 + 160 + 100 = 645
Thus, the number of dead males in 2000 = 1000 - 645 = 355
Similarly, the total number of dead females in 2000 = 1000 - (210 + 175 + 150 + 120) = 1000 - 655 = 345
Thus, the required ratio = 355 : 345 = 71 : 69.
Thus, the correct option is A.
How many people who were being tracked and who were between 30 and 40 years of age in 1980 survived until 2010?
The total number of male and female test cases in 1980 = 1000
The total number of males in the age group of 30-40(in 1980) alive till 2010 = 90
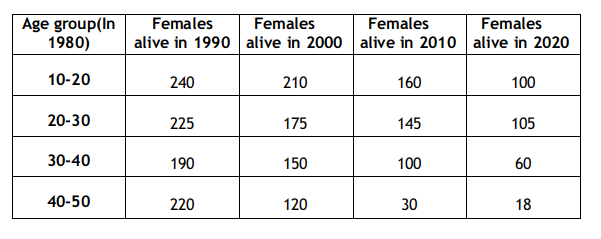
The total number of females in the age group of 30-40(in 1980) alive till 2010 = 100
Thus, the total number of people in the age group of 30-40(in 1980) alive till 2010 = 90 + 100 = 190
Thus, the correct option is C.
How many individuals who were being tracked and who were less than 30 years of age in 1980 survived until 2020?
The total number of male and female test cases in 1980 = 1000
The total number of males less than 30 years (in 1980) survived until 2020 = 140 + 125 = 265
The total number of females less than 30 years (in 1980) survived until 2020 = 100 + 105 = 205
Thus, The total number of people less than 30 years (in 1980) survived until 2020 = 205 + 265 = 470
Thus, the correct option is C.
How many of the males who were being tracked and who were between 20 and 30 years of age in 1980 died in the period 2000 to 2010?
The total number of male and female test cases in 1980 = 1000
The total number of males between 20 and 30 years of age in 1980 who died in 2000 = 205
The total number of males between 20 and 30 years of age in 1980 who died in 2010 = 165
Thus, the total number of males between 20 and 30 years of age in 1980 who died in the period 2000 to 2010 = 205 - 165 = 40
How many of the females who were being tracked and who were between 20 and 30 years of age in 1980 died between the ages of 50 and 60?
The total number of male and female test cases in 1980 = 1000
We are given that there are 250 females from age 20-30 in 1980 and in 2000 these females age are from 40-50 but only 175 are alive in 2000.
In 2000 there were 175 females from age 40-50. If we assume that out of these, 30 females were of age 48 years in 2000 and they died in 2005, then there are 30 females who died at the age of 53.
If we assume that out of the 175 females, 30 females were of age 42 years in 2000, and they died in 2005, then 30 females died at the age of 47. Now, if we assume that there are 15 females of age 42 and 15 females of age 48 in the year 2000, and they all died in 2005, then we have 15 females who died at the age of 47 and 15 females who died at the age of 53.
So we can see that there are many cases possible. We are given that there were 250 females aged 20-30 in 1980, and in 2010, these females ages are from 50-60, but only 145 are alive in 2010.
In 2010 there were 145 females from age 50-60. If we assume that out of these, 40 females were of age 58 years in 2010 and they died in 2015, then there are 40 females who died at the age of 63.
If we assume that out of the 145 females, 40 females are of age 52 years age in 2010, and they died in 2015, then 40 females died at the age of 57. Now, if we assume that there are 15 females of age 52 and 25 females of age 58 in the year 2010, and they all died in 2015, then we have 15 females who died at the age of 57 and 25 females who died at the age of 63.
So we can see that again, there are many cases possible. In the first case, the range of values possible is from 0 to 30. In the
second case, the range of values possible is from 0 to 40. So in total, we get a range of possible values from 0 to 70.
Thus, only one possible value of this question is not possible.
There are only four neighbourhoods in a city - Levmisto, Tyhrmisto, Pesmisto and Kitmisto.During the onset of a pandemic, the number of new cases of a disease in each of these neighbourhoods was recorded over a period of five days. On each day, the number of newcases recorded in any of the neighbourhoods was either 0, 1, 2 or 3.
The following facts are also known:
1.There was at least one new case in every neighbourhood on Day 1.
2.On each of the five days, there were more new cases in Kitmisto than in Pesmisto.
3.The number of new cases in the city in a day kept increasing during the five-day period. The number of new cases on Day 3 was exactly one more than that on Day 2.
4.The maximum number of new cases in a day in Pesmisto was 2, and this happened only once during the five-day period.
5.Kitmisto is the only place to have 3 new cases on Day 2.
6.The total numbers of new cases in Levmisto, Tyhrmisto, Pesmisto and Kitmisto over the five-day period were 12, 12, 5 and 14 respectively.
What BEST can be concluded about the total number of new cases in the city on Day2?
From statement 6, it can be concluded that the total number of new cases is equal to 12+12+5+14 = 43.
Also, since the total number of cases in Kitmisto is 14, it can be concluded that the number of cases each day is either 2 or 3, where 3 cases are recorded on 4 days and 2 cases are recorded on 1 day.
From statement 4, it can be concluded that the number of new cases for Pesmisto will be 0,1,1,1, and 2, in any order(Since the total number of cases is 5, and the maximum number of new cases is 2).
In statement 3, it is given that the number of new cases kept increasing during the 5-day period.
Now, as it is already known that the maximum number of cases for Pesmisto is 2, the maximum total number of cases in a day(or on day 5) will be less than 12.
Let us consider the maximum number of cases on Day 5 as 10.
Thus the maximum number of cases possible for the remaining days will be 9, 8, 7, and 6. So, the total number of maximum cases possible for this case will be 40(less than 43).
Thus, the number of cases on Day 5 will be 11(i.e., b/w 10 and 11)
Now, if the number of cases on Day 4 is 9, the maximum number of cases possible for the remaining days will be 8, 7, and 6.
Thus, the maximum number of cases, in this case, will be 41(less than 43).
So, the number of cases on day 4 will be 10.
Now, if the number of cases on Day 3 is 8, the number of cases on day 2 will be 7, and the maximum possible number of cases on Day 1 will be 6.
Thus, the number of cases, in this case, will be 42(less than 43).
Thus, the number of cases on day 3 will be 9, the number of cases on day 2 will be 8, and the number of cases on day 1 will be 5.
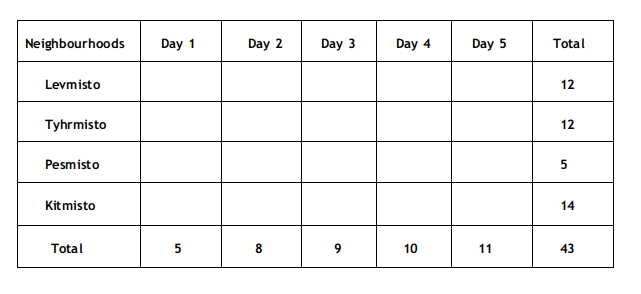
Since all the neighbourhood has at least one case on Day 1, the only possible combination will be 1, 1, 1, and 2 for Levmisto, Tyhrmisto, Pesmisto and Kitmisto, respectively.
Now, for the other 4 days, the number of cases in Kitmisto will be 3.
For day 5, the number of cases will be 3, 3, 2, and 3 for Levmisto, Tyhrmisto, Pesmisto and Kitmisto, respectively(since the maximum number of cases in Pesmisto is 2).
And since Pesmisto only has the maximum number of cases on one day, the number of cases on day 4 will be 3, 3, 1, and 3 for Levmisto, Tyhrmisto, Pesmisto and Kitmisto, respectively.
On day 2, since Kitmisto is the only neighbourhood to have 3 cases, the number of cases on day 2 will be 2, 2, 1, and 3 for Levmisto, Tyhrmisto, Pesmisto and Kitmisto, respectively.
Now, on day 3, the number of cases will be 3, 3, 0, and 3 for Levmisto, Tyhrmisto, Pesmisto and Kitmisto, respectively.
Thus, the final table will be as follows:
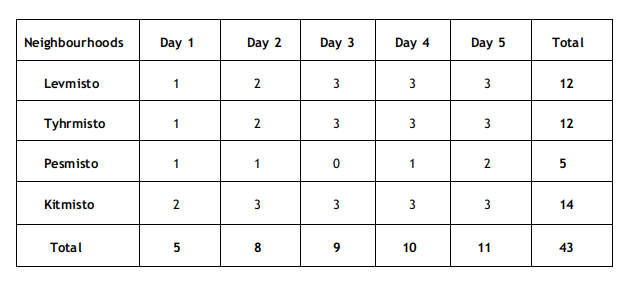
From the data, it can be concluded that the total number of cases on Day 2 is equal to 8.
Thus, the correct option is D.
What BEST can be concluded about the number of new cases in Levmisto on Day 3?
From statement 6, it can be concluded that the total number of new cases is equal to 12+12+5+14 = 43.
Also, since the total number of cases in Kitmisto is 14, it can be concluded that the number of cases each day is either 2 or 3, where 3 cases are recorded on 4 days and 2 cases are recorded on 1 day.
From statement 4, it can be concluded that the number of new cases for Pesmisto will be 0,1,1,1, and 2, in any order(Since the total number of cases is 5, and the maximum number of new cases is 2).
In statement 3, it is given that the number of new cases kept increasing during the 5-day period.
Now, as it is already known that the maximum number of cases for Pesmisto is 2, the maximum total number of cases in a day(or on day 5) will be less than 12.
Let us consider the maximum number of cases on Day 5 as 10.
Thus the maximum number of cases possible for the remaining days will be 9, 8, 7, and 6. So, the total number of maximum cases possible for this case will be 40(less than 43).
Thus, the number of cases on Day 5 will be 11(i.e., b/w 10 and 11)
Now, if the number of cases on Day 4 is 9, the maximum number of cases possible for the remaining days will be 8, 7, and 6.
Thus, the maximum number of cases, in this case, will be 41(less than 43).
So, the number of cases on day 4 will be 10.
Now, if the number of cases on Day 3 is 8, the number of cases on day 2 will be 7, and the maximum possible number of cases on Day 1 will be 6.
Thus, the number of cases, in this case, will be 42(less than 43).
Thus, the number of cases on day 3 will be 9, the number of cases on day 2 will be 8, and the number of cases on day 1 will be 5.
Since all the neighbourhood has at least one case on Day 1, the only possible combination will be 1, 1, 1, and 2 for Levmisto, Tyhrmisto, Pesmisto and Kitmisto, respectively.
Now, for the other 4 days, the number of cases in Kitmisto will be 3.
For day 5, the number of cases will be 3, 3, 2, and 3 for Levmisto, Tyhrmisto, Pesmisto and Kitmisto, respectively(since the maximum number of cases in Pesmisto is 2).
And since Pesmisto only has the maximum number of cases on one day, the number of cases on day 4 will be 3, 3, 1, and 3 for Levmisto, Tyhrmisto, Pesmisto and Kitmisto, respectively.
On day 2, since Kitmisto is the only neighbourhood to have 3 cases, the number of cases on day 2 will be 2, 2, 1, and 3 for Levmisto, Tyhrmisto, Pesmisto and Kitmisto, respectively.
Now, on day 3, the number of cases will be 3, 3, 0, and 3 for Levmisto, Tyhrmisto, Pesmisto and Kitmisto, respectively.
Thus, the final table will be as follows:
From the final table, it can be concluded that the total number of cases in Levmisto is 3 on day 3.
Thus, the correct option is C.
On which day(s) did Pesmisto not have any new case?
From statement 6, it can be concluded that the total number of new cases is equal to 12+12+5+14 = 43.
Also, since the total number of cases in Kitmisto is 14, it can be concluded that the number of cases each day is either 2 or 3, where 3 cases are recorded on 4 days and 2 cases are recorded on 1 day.
From statement 4, it can be concluded that the number of new cases for Pesmisto will be 0,1,1,1, and 2, in any order(Since the total number of cases is 5, and the maximum number of new cases is 2).
In statement 3, it is given that the number of new cases kept increasing during the 5-day period.
Now, as it is already known that the maximum number of cases for Pesmisto is 2, the maximum total number of cases in a day(or on day 5) will be less than 12.
Let us consider the maximum number of cases on Day 5 as 10.
Thus the maximum number of cases possible for the remaining days will be 9, 8, 7, and 6. So, the total number of maximum cases possible for this case will be 40(less than 43).
Thus, the number of cases on Day 5 will be 11(i.e., b/w 10 and 11)
Now, if the number of cases on Day 4 is 9, the maximum number of cases possible for the remaining days will be 8, 7, and 6.
Thus, the maximum number of cases, in this case, will be 41(less than 43).
So, the number of cases on day 4 will be 10.
Now, if the number of cases on Day 3 is 8, the number of cases on day 2 will be 7, and the maximum possible number of cases on Day 1 will be 6.
Thus, the number of cases, in this case, will be 42(less than 43).
Thus, the number of cases on day 3 will be 9, the number of cases on day 2 will be 8, and the number of cases on day 1 will be 5.
Since all the neighbourhood has at least one case on Day 1, the only possible combination will be 1, 1, 1, and 2 for Levmisto, Tyhrmisto, Pesmisto and Kitmisto, respectively.
Now, for the other 4 days, the number of cases in Kitmisto will be 3.
For day 5, the number of cases will be 3, 3, 2, and 3 for Levmisto, Tyhrmisto, Pesmisto and Kitmisto, respectively(since the maximum number of cases in Pesmisto is 2).
And since Pesmisto only has the maximum number of cases on one day, the number of cases on day 4 will be 3, 3, 1, and 3 for Levmisto, Tyhrmisto, Pesmisto and Kitmisto, respectively.
On day 2, since Kitmisto is the only neighbourhood to have 3 cases, the number of cases on day 2 will be 2, 2, 1, and 3 for Levmisto, Tyhrmisto, Pesmisto and Kitmisto, respectively.
Now, on day 3, the number of cases will be 3, 3, 0, and 3 for Levmisto, Tyhrmisto, Pesmisto and Kitmisto, respectively.
Thus, the final table will be as follows:
From the final table, it can be concluded that on Day 3, the number of cases will be zero for Pesmisto.
Thus, the correct option is A.
Which of the two statements below is/are necessarily false?
Statement A: There were 2 new cases in Tyhrmisto on Day 3.
Statement B: There were no new cases in Pesmisto on Day 2.
From statement 6, it can be concluded that the total number of new cases is equal to 12+12+5+14 = 43.
Also, since the total number of cases in Kitmisto is 14, it can be concluded that the number of cases each day is either 2 or 3, where 3 cases are recorded on 4 days and 2 cases are recorded on 1 day.
From statement 4, it can be concluded that the number of new cases for Pesmisto will be 0,1,1,1, and 2, in any order(Since the total number of cases is 5, and the maximum number of new cases is 2).
In statement 3, it is given that the number of new cases kept increasing during the 5-day period.
Now, as it is already known that the maximum number of cases for Pesmisto is 2, the maximum total number of cases in a day(or on day 5) will be less than 12.
Let us consider the maximum number of cases on Day 5 as 10.
Thus the maximum number of cases possible for the remaining days will be 9, 8, 7, and 6. So, the total number of maximum cases possible for this case will be 40(less than 43).
Thus, the number of cases on Day 5 will be 11(i.e., b/w 10 and 11)
Now, if the number of cases on Day 4 is 9, the maximum number of cases possible for the remaining days will be 8, 7, and 6.
Thus, the maximum number of cases, in this case, will be 41(less than 43).
So, the number of cases on day 4 will be 10.
Now, if the number of cases on Day 3 is 8, the number of cases on day 2 will be 7, and the maximum possible number of cases on Day 1 will be 6.
Thus, the number of cases, in this case, will be 42(less than 43).
Thus, the number of cases on day 3 will be 9, the number of cases on day 2 will be 8, and the number of cases on day 1 will be 5.
Since all the neighbourhood has at least one case on Day 1, the only possible combination will be 1, 1, 1, and 2 for Levmisto, Tyhrmisto, Pesmisto and Kitmisto, respectively.
Now, for the other 4 days, the number of cases in Kitmisto will be 3.
For day 5, the number of cases will be 3, 3, 2, and 3 for Levmisto, Tyhrmisto, Pesmisto and Kitmisto, respectively(since the maximum number of cases in Pesmisto is 2).
And since Pesmisto only has the maximum number of cases on one day, the number of cases on day 4 will be 3, 3, 1, and 3 for Levmisto, Tyhrmisto, Pesmisto and Kitmisto, respectively.
On day 2, since Kitmisto is the only neighbourhood to have 3 cases, the number of cases on day 2 will be 2, 2, 1, and 3 for Levmisto, Tyhrmisto, Pesmisto and Kitmisto, respectively.
Now, on day 3, the number of cases will be 3, 3, 0, and 3 for Levmisto, Tyhrmisto, Pesmisto and Kitmisto, respectively.
Thus, the final table will be as follows:
From the final table, it can be concluded that both statements are false.
Thus the correct option is D.
On how many days did Levmisto and Tyhrmisto have the same number of new cases?
From statement 6, it can be concluded that the total number of new cases is equal to 12+12+5+14 = 43.
Also, since the total number of cases in Kitmisto is 14, it can be concluded that the number of cases each day is either 2 or 3, where 3 cases are recorded on 4 days and 2 cases are recorded on 1 day.
From statement 4, it can be concluded that the number of new cases for Pesmisto will be 0,1,1,1, and 2, in any order(Since the total number of cases is 5, and the maximum number of new cases is 2).
In statement 3, it is given that the number of new cases kept increasing during the 5-day period.
Now, as it is already known that the maximum number of cases for Pesmisto is 2, the maximum total number of cases in a day(or on day 5) will be less than 12.
Let us consider the maximum number of cases on Day 5 as 10.
Thus the maximum number of cases possible for the remaining days will be 9, 8, 7, and 6. So, the total number of maximum cases possible for this case will be 40(less than 43).
Thus, the number of cases on Day 5 will be 11(i.e., b/w 10 and 11)
Now, if the number of cases on Day 4 is 9, the maximum number of cases possible for the remaining days will be 8, 7, and 6.
Thus, the maximum number of cases, in this case, will be 41(less than 43).
So, the number of cases on day 4 will be 10.
Now, if the number of cases on Day 3 is 8, the number of cases on day 2 will be 7, and the maximum possible number of cases on Day 1 will be 6.
Thus, the number of cases, in this case, will be 42(less than 43).
Thus, the number of cases on day 3 will be 9, the number of cases on day 2 will be 8, and the number of cases on day 1 will be 5.
Since all the neighbourhood has at least one case on Day 1, the only possible combination will be 1, 1, 1, and 2 for Levmisto, Tyhrmisto, Pesmisto and Kitmisto, respectively.
Now, for the other 4 days, the number of cases in Kitmisto will be 3.
For day 5, the number of cases will be 3, 3, 2, and 3 for Levmisto, Tyhrmisto, Pesmisto and Kitmisto, respectively(since the maximum number of cases in Pesmisto is 2).
And since Pesmisto only has the maximum number of cases on one day, the number of cases on day 4 will be 3, 3, 1, and 3 for Levmisto, Tyhrmisto, Pesmisto and Kitmisto, respectively.
On day 2, since Kitmisto is the only neighbourhood to have 3 cases, the number of cases on day 2 will be 2, 2, 1, and 3 for Levmisto, Tyhrmisto, Pesmisto and Kitmisto, respectively.
Now, on day 3, the number of cases will be 3, 3, 0, and 3 for Levmisto, Tyhrmisto, Pesmisto and Kitmisto, respectively.
Thus, the final table will be as follows:
It can be concluded from the final table that the number of cases will be the same for all the days.
Thus, the correct option is D
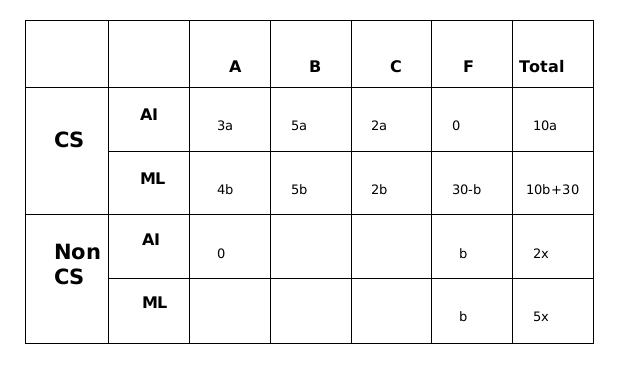
All the first-year students in the computer science (CS) department in a university take both the courses (i) AI and (ii) ML. Students from other departments (non-CS students) can also take one of these two courses, but not both. Students who fail in a course get an F grade;others pass and are awarded A or B or C grades depending on their performance. The following are some additional facts about the number of students who took these two courses this year and the grades they obtained.
1.The numbers of non-CS students who took AI and ML were in the ratio 2 : 5.
2.The number of non-CS students who took either AI or ML was equal to the number of CS students.
3.The numbers of non-CS students who failed in the two courses were the same and their total is equal to the number of CS students who got a C grade in ML.
4. In both the courses, 50% of the students who passed got a B grade. But, while the numbers of students who got A and C grades were the same for AI, they were in the ratio 3 :2 for ML.
5. No CS student failed in AI, while no non-CS student got an A grade in AI.
6.The numbers of CS students who got A, B and C grades respectively in AI were in the ratio 3 : 5 : 2, while in ML the ratio was 4 : 5 : 2.
7.The ratio of the total number of non-CS students failing in one of the two courses to the number of CS students failing in one of the two courses was 3 : 1.
8. 30 students failed in ML.
How many students took AI?
Let the number of students in non-CS be 7x so no.of students taking AI in non-CS is 2x and no. of students taking ML in non-CS is 5x
All the CS students have taken both the courses, we are given this in the first line of the set.
From statement 5, we can conclude that 0 students from CS failed in AI and 0 students from non-CS got grade A in AI.
From statement 6, let us say that the numbers of CS students who got A, B and C grades respectively in AI were in the ratio 3a, 5a and 2a, while in ML the ratio was 4b, 5b and 2b.
From statement 3 we can say that the number of non- CS students who failed in AI and ML are b in each category.
Now from statement 8, we can say that number of CS students who failed in MI is equal to 30-b.
From statement 7, we can say that, $$\frac{2b}{30-b}=\frac{3}{1}$$
or, 2b = 90-3b
or, b= 18
CS students take both the AI and ML courses, therefore 10a= 10b +30
or, a= b+3 = 21
From statement 2, we can say that 10a = 7x
or, x = 30
Substituting the values of a, b and x in the above table.
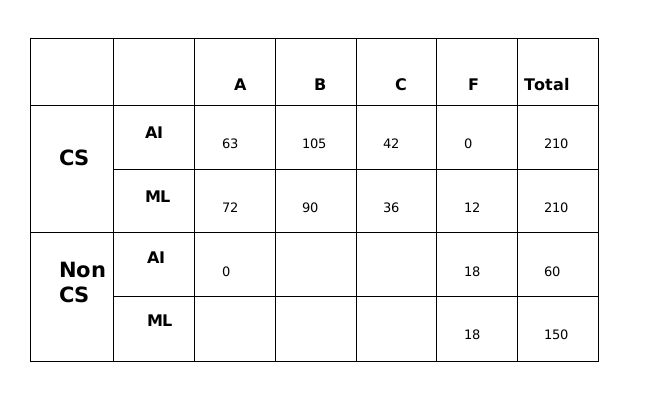
A total of 270 students took AI out of which 252 students passed and a total of 360 students took ML out of which 330 students passed.
From statement 4, we can say that out of the 252 students who passed in AI, 126 of them got Grade B and 63 got Grade A and 63 got Grade C.
Similarly, We can say that out of the 330 students who passed in ML, 165 of them got Grade C and 99 got Grade A and 66 got Grade C.
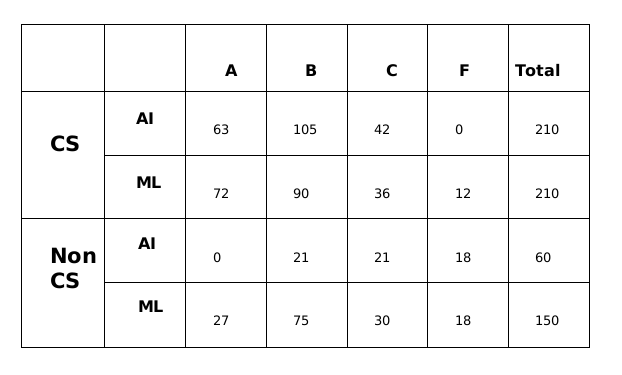
Therefore, the final table which we get is
How many CS students failed in ML?
Let the number of students in non-CS be 7x so no.of students taking AI in non-CS is 2x and no. of students taking ML in non-CS is 5x
All the CS students have taken both the courses, we are given this in the first line of the set.
From statement 5, we can conclude that 0 students from CS failed in AI and 0 students from non-CS got grade A in AI.
From statement 6, let us say that the numbers of CS students who got A, B and C grades respectively in AI were in the ratio 3a, 5a and 2a, while in ML the ratio was 4b, 5b and 2b.
From statement 3 we can say that the number of non- CS students who failed in AI and ML are b in each category.
Now from statement 8, we can say that number of CS students who failed in MI is equal to 30-b.
From statement 7, we can say that, $$\frac{2b}{30-b}=\frac{3}{1}$$
or, 2b = 90-3b
or, b= 18
CS students take both the AI and ML courses, therefore 10a= 10b +30
or, a= b+3 = 21
From statement 2, we can say that 10a = 7x
or, x = 30
Substituting the values of a, b and x in the above table.
A total of 270 students took AI out of which 252 students passed and a total of 360 students took ML out of which 330 students passed.
From statement 4, we can say that out of the 252 students who passed in AI, 126 of them got Grade B and 63 got Grade A and 63 got Grade C.
Similarly, We can say that out of the 330 students who passed in ML, 165 of them got Grade C and 99 got Grade A and 66 got Grade C.
Therefore, the final table which we get is
How many non-CS students got A grade in ML?
Let the number of students in non-CS be 7x so no.of students taking AI in non-CS is 2x and no. of students taking ML in non-CS is 5x
All the CS students have taken both the courses, we are given this in the first line of the set.
From statement 5, we can conclude that 0 students from CS failed in AI and 0 students from non-CS got grade A in AI.
From statement 6, let us say that the numbers of CS students who got A, B and C grades respectively in AI were in the ratio 3a, 5a and 2a, while in ML the ratio was 4b, 5b and 2b.
From statement 3 we can say that the number of non- CS students who failed in AI and ML are b in each category.
Now from statement 8, we can say that number of CS students who failed in MI is equal to 30-b.
From statement 7, we can say that, $$\frac{2b}{30-b}=\frac{3}{1}$$
or, 2b = 90-3b
or, b= 18
CS students take both the AI and ML courses, therefore 10a= 10b +30
or, a= b+3 = 21
From statement 2, we can say that 10a = 7x
or, x = 30
Substituting the values of a, b and x in the above table.
A total of 270 students took AI out of which 252 students passed and a total of 360 students took ML out of which 330 students passed.
From statement 4, we can say that out of the 252 students who passed in AI, 126 of them got Grade B and 63 got Grade A and 63 got Grade C.
Similarly, We can say that out of the 330 students who passed in ML, 165 of them got Grade C and 99 got Grade A and 66 got Grade C.
Therefore, the final table which we get is
How many students got A grade in AI?
Let the number of students in non-CS be 7x so no.of students taking AI in non-CS is 2x and no. of students taking ML in non-CS is 5x
All the CS students have taken both the courses, we are given this in the first line of the set.
From statement 5, we can conclude that 0 students from CS failed in AI and 0 students from non-CS got grade A in AI.
From statement 6, let us say that the numbers of CS students who got A, B and C grades respectively in AI were in the ratio 3a, 5a and 2a, while in ML the ratio was 4b, 5b and 2b.
From statement 3 we can say that the number of non- CS students who failed in AI and ML are b in each category.
Now from statement 8, we can say that number of CS students who failed in MI is equal to 30-b.
From statement 7, we can say that, $$\frac{2b}{30-b}=\frac{3}{1}$$
or, 2b = 90-3b
or, b= 18
CS students take both the AI and ML courses, therefore 10a= 10b +30
or, a= b+3 = 21
From statement 2, we can say that 10a = 7x
or, x = 30
Substituting the values of a, b and x in the above table.
A total of 270 students took AI out of which 252 students passed and a total of 360 students took ML out of which 330 students passed.
From statement 4, we can say that out of the 252 students who passed in AI, 126 of them got Grade B and 63 got Grade A and 63 got Grade C.
Similarly, We can say that out of the 330 students who passed in ML, 165 of them got Grade C and 99 got Grade A and 66 got Grade C.
Therefore, the final table which we get is
How many non-CS students got B grade in ML?
Let the number of students in non-CS be 7x so no.of students taking AI in non-CS is 2x and no. of students taking ML in non-CS is 5x
All the CS students have taken both the courses, we are given this in the first line of the set.
From statement 5, we can conclude that 0 students from CS failed in AI and 0 students from non-CS got grade A in AI.
From statement 6, let us say that the numbers of CS students who got A, B and C grades respectively in AI were in the ratio 3a, 5a and 2a, while in ML the ratio was 4b, 5b and 2b.
From statement 3 we can say that the number of non- CS students who failed in AI and ML are b in each category.
Now from statement 8, we can say that number of CS students who failed in MI is equal to 30-b.
From statement 7, we can say that, $$\frac{2b}{30-b}=\frac{3}{1}$$
or, 2b = 90-3b
or, b= 18
CS students take both the AI and ML courses, therefore 10a= 10b +30
or, a= b+3 = 21
From statement 2, we can say that 10a = 7x
or, x = 30
Substituting the values of a, b and x in the above table.
A total of 270 students took AI out of which 252 students passed and a total of 360 students took ML out of which 330 students passed.
From statement 4, we can say that out of the 252 students who passed in AI, 126 of them got Grade B and 63 got Grade A and 63 got Grade C.
Similarly, We can say that out of the 330 students who passed in ML, 165 of them got Grade C and 99 got Grade A and 66 got Grade C.
Therefore, the final table which we get is
Pulak, Qasim, Ritesh, and Suresh participated in a tournament comprising of eight rounds. In each round, they formed two pairs, with each of them being in exactly one pair. The only restriction in the pairing was that the pairs would change in successive rounds. For example, if Pulak formed a pair with Qasim in the first round, then he would have to form a pair with Ritesh or Suresh in the second round. He would be free to pair with Qasim again in the third round. In each round, each pair decided whether to play the game in that round or not. If they decided not to play, then no money was exchanged between them. If they decided to play, they had to bet either ₹1 or ₹2 in that round. For example, if they chose to bet ₹2, then the player winning the game got ₹2 from the one losing the game.
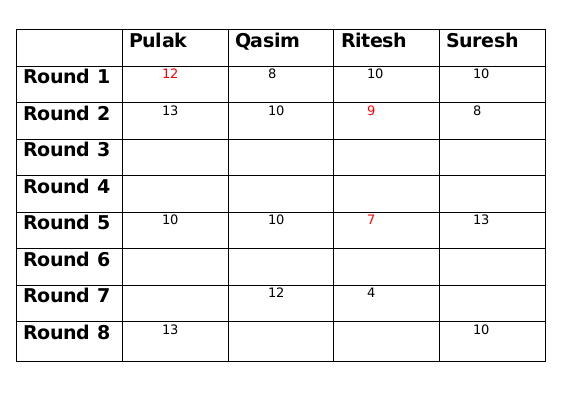
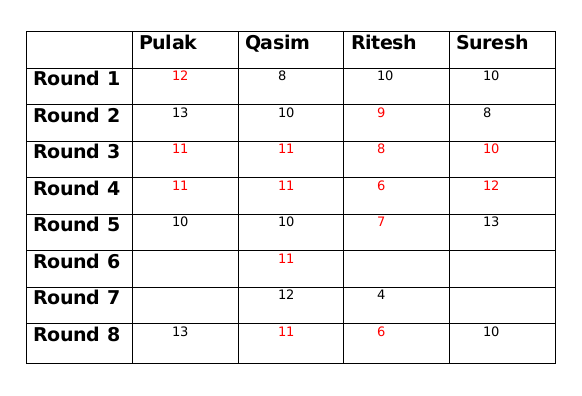
At the beginning of the tournament, the players had ₹10 each. The following table shows partial information about the amounts that the players had at the end of each of the eightrounds. It shows every time a player had ₹10 at the end of a round, as well as every time, at the end of a round, a player had either the minimum or the maximum amount that he would have had across the eight rounds. For example, Suresh had ₹10 at the end of Rounds 1, 3 and 8 and not after any of the other rounds. The maximum amount that he had at the end of any round was ₹13 (at the end of Round 5), and the minimum amount he had at the end of any round was ₹8 (at the end of Round 2). At the end of all other rounds, he must have had either ₹9, ₹11, or ₹12.
It was also known that Pulak and Qasim had the same amount of money with them at the end of Round 4.
.png)
What BEST can be said about the amount of money that Ritesh had with him at the end of Round 8?
Its given that the table shows every time a player had ₹10 at the end of a round, as well as every time, at the end of a round, a player had either the minimum or the maximum amount that he would have had across the eight rounds, which means that in Pulak's column the numbers possible are 11 or 12 only, similarly in Qasim's column numbers possible are only 9 or 11 only, similarly in Ritesh's column numbers possible are 5,6,7,8 or 9 only and in Suresh's column numbers possible are 9,11 or 12 only.
Everyone started with 10 rupees and the total amount,i.e., 40 in each round remains the same. So we get the following table
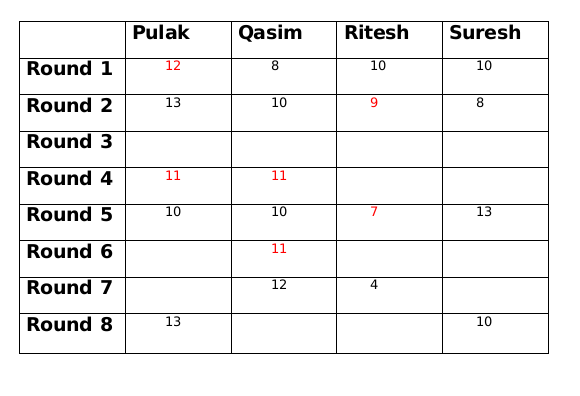
We are given that at the end of 4th round both Pulak and Qasim had the same amount with them and that amount possible is only 11.
As per the information given in the set the only possible amount with Qasim at the end of round 6 is 11.
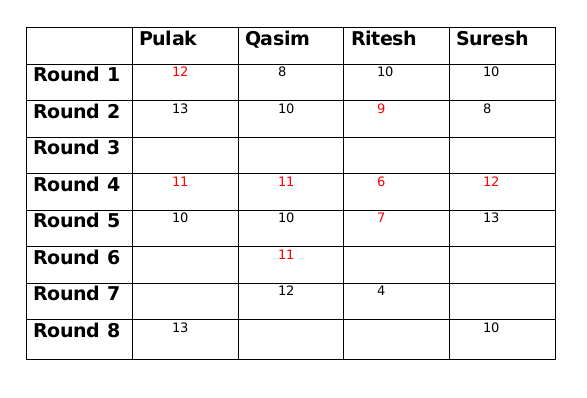
Amounts with Pulak and Qasim at the end of round 5 is decreased by 1 from the amounts which they had at the end of round 4, since the total amount will be same at the end of every round, so amounts with Ritesh and Suresh at the end of round 5 is increased by 1 from the amounts which they had at the end of round 4.
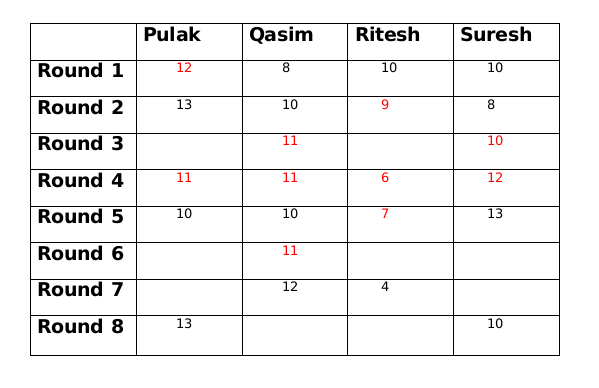
Amount with Suresh at the end of round 2 is 8 and at the end of round 4 is 12, therefore, amount with Suresh at the end of round 3 is 10.
Amount with Qasim at the end of round 3 is either 9 or 11. If the amount is 9 then either amount with Ritesh has to be 10 or amount with Pulak has to to be 14, both of which is not possible. Therefore, amount with Qasim at the end of round 3 is 11.
Now Qasim has the same amount at the end of round 3 and round 4 so there must be another person whose amount is also same at the end of round 3 and round 4. This person can only be Pulak. So at the end of round 3 Pulak has 11 rupees and Ritesh has 8 rupees.
The only possible amount with Qasim at the end of round 8 can be 11 and therefore the amount at the end of round 8 with Ritesh will be 6.
The amount with Ritesh at the end of round 8 is 2 more than the amount with him at the end of round 7, so the amount with either Pulak or Suresh at the end of round 7 has to be 2 more than the amount at the end of round 8. This is only possible for Suresh who must have 12 rupees at the end of round 7 as Pulak cannot have rupees 15 at the end of round 7.
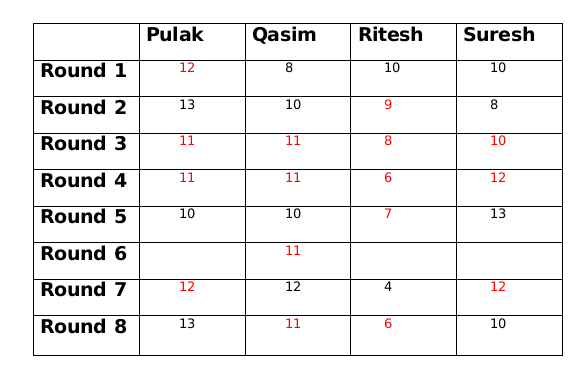
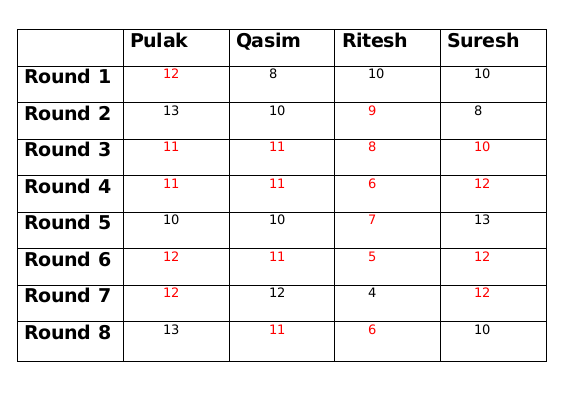
The amount with Qasim at the end of round 7 is 1 more than the amount with him at the end of round 6. So there must be another person whose amount at the end of round 7 is 1 less than the amount him at the end of round 6. This only possible person can be Ritesh. So amount with Ritesh at the end of round 6 will be 5.
If the amount with Suresh at the end of round 6 is 11 then the amount with Pulak at the end of round 6 will be 13 which is not possible. Therefore the amount with Suresh at the end of round 6 is 12 and the amount with Pulak at the end of round 6 is 12.
What BEST can be said about the amount of money that Pulak had with him at the end of Round 6?
Its given that the table shows every time a player had ₹10 at the end of a round, as well as every time, at the end of a round, a player had either the minimum or the maximum amount that he would have had across the eight rounds, which means that in Pulak's column the numbers possible are 11 or 12 only, similarly in Qasim's column numbers possible are only 9 or 11 only, similarly in Ritesh's column numbers possible are 5,6,7,8 or 9 only and in Suresh's column numbers possible are 9,11 or 12 only.
Everyone started with 10 rupees and the total amount,i.e., 40 in each round remains the same. So we get the following table
We are given that at the end of 4th round both Pulak and Qasim had the same amount with them and that amount possible is only 11.
As per the information given in the set the only possible amount with Qasim at the end of round 6 is 11.
Amounts with Pulak and Qasim at the end of round 5 is decreased by 1 from the amounts which they had at the end of round 4, since the total amount will be same at the end of every round, so amounts with Ritesh and Suresh at the end of round 5 is increased by 1 from the amounts which they had at the end of round 4.
Amount with Suresh at the end of round 2 is 8 and at the end of round 4 is 12, therefore, amount with Suresh at the end of round 3 is 10.
Amount with Qasim at the end of round 3 is either 9 or 11. If the amount is 9 then either amount with Ritesh has to be 10 or amount with Pulak has to to be 14, both of which is not possible. Therefore, amount with Qasim at the end of round 3 is 11.
Now Qasim has the same amount at the end of round 3 and round 4 so there must be another person whose amount is also same at the end of round 3 and round 4. This person can only be Pulak. So at the end of round 3 Pulak has 11 rupees and Ritesh has 8 rupees.
The only possible amount with Qasim at the end of round 8 can be 11 and therefore the amount at the end of round 8 with Ritesh will be 6.
The amount with Ritesh at the end of round 8 is 2 more than the amount with him at the end of round 7, so the amount with either Pulak or Suresh at the end of round 7 has to be 2 more than the amount at the end of round 8. This is only possible for Suresh who must have 12 rupees at the end of round 7 as Pulak cannot have rupees 15 at the end of round 7.
The amount with Qasim at the end of round 7 is 1 more than the amount with him at the end of round 6. So there must be another person whose amount at the end of round 7 is 1 less than the amount him at the end of round 6. This only possible person can be Ritesh. So amount with Ritesh at the end of round 6 will be 5.
If the amount with Suresh at the end of round 6 is 11 then the amount with Pulak at the end of round 6 will be 13 which is not possible. Therefore the amount with Suresh at the end of round 6 is 12 and the amount with Pulak at the end of round 6 is 12.
How much money (in ₹) did Ritesh have at the end of Round 4?
Its given that the table shows every time a player had ₹10 at the end of a round, as well as every time, at the end of a round, a player had either the minimum or the maximum amount that he would have had across the eight rounds, which means that in Pulak's column the numbers possible are 11 or 12 only, similarly in Qasim's column numbers possible are only 9 or 11 only, similarly in Ritesh's column numbers possible are 5,6,7,8 or 9 only and in Suresh's column numbers possible are 9,11 or 12 only.
Everyone started with 10 rupees and the total amount,i.e., 40 in each round remains the same. So we get the following table
We are given that at the end of 4th round both Pulak and Qasim had the same amount with them and that amount possible is only 11.
As per the information given in the set the only possible amount with Qasim at the end of round 6 is 11.
Amounts with Pulak and Qasim at the end of round 5 is decreased by 1 from the amounts which they had at the end of round 4, since the total amount will be same at the end of every round, so amounts with Ritesh and Suresh at the end of round 5 is increased by 1 from the amounts which they had at the end of round 4.
Amount with Suresh at the end of round 2 is 8 and at the end of round 4 is 12, therefore, amount with Suresh at the end of round 3 is 10.
Amount with Qasim at the end of round 3 is either 9 or 11. If the amount is 9 then either amount with Ritesh has to be 10 or amount with Pulak has to to be 14, both of which is not possible. Therefore, amount with Qasim at the end of round 3 is 11.
Now Qasim has the same amount at the end of round 3 and round 4 so there must be another person whose amount is also same at the end of round 3 and round 4. This person can only be Pulak. So at the end of round 3 Pulak has 11 rupees and Ritesh has 8 rupees.
The only possible amount with Qasim at the end of round 8 can be 11 and therefore the amount at the end of round 8 with Ritesh will be 6.
The amount with Ritesh at the end of round 8 is 2 more than the amount with him at the end of round 7, so the amount with either Pulak or Suresh at the end of round 7 has to be 2 more than the amount at the end of round 8. This is only possible for Suresh who must have 12 rupees at the end of round 7 as Pulak cannot have rupees 15 at the end of round 7.
The amount with Qasim at the end of round 7 is 1 more than the amount with him at the end of round 6. So there must be another person whose amount at the end of round 7 is 1 less than the amount him at the end of round 6. This only possible person can be Ritesh. So amount with Ritesh at the end of round 6 will be 5.
If the amount with Suresh at the end of round 6 is 11 then the amount with Pulak at the end of round 6 will be 13 which is not possible. Therefore the amount with Suresh at the end of round 6 is 12 and the amount with Pulak at the end of round 6 is 12.
How many games were played with a bet of ₹2?
Its given that the table shows every time a player had ₹10 at the end of a round, as well as every time, at the end of a round, a player had either the minimum or the maximum amount that he would have had across the eight rounds, which means that in Pulak's column the numbers possible are 11 or 12 only, similarly in Qasim's column numbers possible are only 9 or 11 only, similarly in Ritesh's column numbers possible are 5,6,7,8 or 9 only and in Suresh's column numbers possible are 9,11 or 12 only.
Everyone started with 10 rupees and the total amount,i.e., 40 in each round remains the same. So we get the following table
We are given that at the end of 4th round both Pulak and Qasim had the same amount with them and that amount possible is only 11.
As per the information given in the set the only possible amount with Qasim at the end of round 6 is 11.
Amounts with Pulak and Qasim at the end of round 5 is decreased by 1 from the amounts which they had at the end of round 4, since the total amount will be same at the end of every round, so amounts with Ritesh and Suresh at the end of round 5 is increased by 1 from the amounts which they had at the end of round 4.
Amount with Suresh at the end of round 2 is 8 and at the end of round 4 is 12, therefore, amount with Suresh at the end of round 3 is 10.
Amount with Qasim at the end of round 3 is either 9 or 11. If the amount is 9 then either amount with Ritesh has to be 10 or amount with Pulak has to to be 14, both of which is not possible. Therefore, amount with Qasim at the end of round 3 is 11.
Now Qasim has the same amount at the end of round 3 and round 4 so there must be another person whose amount is also same at the end of round 3 and round 4. This person can only be Pulak. So at the end of round 3 Pulak has 11 rupees and Ritesh has 8 rupees.
The only possible amount with Qasim at the end of round 8 can be 11 and therefore the amount at the end of round 8 with Ritesh will be 6.
The amount with Ritesh at the end of round 8 is 2 more than the amount with him at the end of round 7, so the amount with either Pulak or Suresh at the end of round 7 has to be 2 more than the amount at the end of round 8. This is only possible for Suresh who must have 12 rupees at the end of round 7 as Pulak cannot have rupees 15 at the end of round 7.
The amount with Qasim at the end of round 7 is 1 more than the amount with him at the end of round 6. So there must be another person whose amount at the end of round 7 is 1 less than the amount him at the end of round 6. This only possible person can be Ritesh. So amount with Ritesh at the end of round 6 will be 5.
If the amount with Suresh at the end of round 6 is 11 then the amount with Pulak at the end of round 6 will be 13 which is not possible. Therefore the amount with Suresh at the end of round 6 is 12 and the amount with Pulak at the end of round 6 is 12.
The Games which had a bet of Rs.2 are as following
Round 1 - Palak vs Qasim
Round 2 - Qasim vs Suresh
Round 3 - Palak vs Suresh
Round 4 - Ritesh vs Suresh
Round 5 - None
Round 6 - Palak vs Ritesh
Round 7 - None
Round 8 - Ritesh vs Suresh
Hence total number of games that were played with a bet of 2 is 6
Which of the following pairings was made in Round 5?
Its given that the table shows every time a player had ₹10 at the end of a round, as well as every time, at the end of a round, a player had either the minimum or the maximum amount that he would have had across the eight rounds, which means that in Pulak's column the numbers possible are 11 or 12 only, similarly in Qasim's column numbers possible are only 9 or 11 only, similarly in Ritesh's column numbers possible are 5,6,7,8 or 9 only and in Suresh's column numbers possible are 9,11 or 12 only.
Everyone started with 10 rupees and the total amount,i.e., 40 in each round remains the same. So we get the following table
We are given that at the end of 4th round both Pulak and Qasim had the same amount with them and that amount possible is only 11.
As per the information given in the set the only possible amount with Qasim at the end of round 6 is 11.
Amounts with Pulak and Qasim at the end of round 5 is decreased by 1 from the amounts which they had at the end of round 4, since the total amount will be same at the end of every round, so amounts with Ritesh and Suresh at the end of round 5 is increased by 1 from the amounts which they had at the end of round 4.
Amount with Suresh at the end of round 2 is 8 and at the end of round 4 is 12, therefore, amount with Suresh at the end of round 3 is 10.
Amount with Qasim at the end of round 3 is either 9 or 11. If the amount is 9 then either amount with Ritesh has to be 10 or amount with Pulak has to to be 14, both of which is not possible. Therefore, amount with Qasim at the end of round 3 is 11.
Now Qasim has the same amount at the end of round 3 and round 4 so there must be another person whose amount is also same at the end of round 3 and round 4. This person can only be Pulak. So at the end of round 3 Pulak has 11 rupees and Ritesh has 8 rupees.
The only possible amount with Qasim at the end of round 8 can be 11 and therefore the amount at the end of round 8 with Ritesh will be 6.
The amount with Ritesh at the end of round 8 is 2 more than the amount with him at the end of round 7, so the amount with either Pulak or Suresh at the end of round 7 has to be 2 more than the amount at the end of round 8. This is only possible for Suresh who must have 12 rupees at the end of round 7 as Pulak cannot have rupees 15 at the end of round 7.
The amount with Qasim at the end of round 7 is 1 more than the amount with him at the end of round 6. So there must be another person whose amount at the end of round 7 is 1 less than the amount him at the end of round 6. This only possible person can be Ritesh. So amount with Ritesh at the end of round 6 will be 5.
If the amount with Suresh at the end of round 6 is 11 then the amount with Pulak at the end of round 6 will be 13 which is not possible. Therefore the amount with Suresh at the end of round 6 is 12 and the amount with Pulak at the end of round 6 is 12.
For round 6 the pairs formed were Pulak-Ritesh and Qasim-Suresh. For round 4 the pairs formed were Pulak-Qasim and Ritesh-Suresh.
Therefore the pairs formed for round 5 were Pulak-Suresh and Qasim-Ritesh

Educational materials for CAT preparation
