Which of the following had the least cost per room?
Sign in
Please select an account to continue using cracku.in
↓ →
The following table gives the number of rooms in different hotels in Mumbai and the cost of building each one of them. Note that all the projects started in 1997
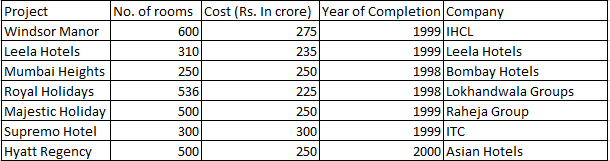
Note: All projects start in 1997.
Which of the following had the least cost per room?
The cost per room equals (total cost)/(total rooms)
To calculate the least cost per room, we have to only check IHCL and Lokhandwala Group. A simple inspection will remove all other companies as they have more cost and lesser rooms than either of the two.
Cost per room of IHCL = 275/600 = 45.83 lakhs
Cost per room of Lokhandwala = 225/536 = 41.97 lakhs.
Hence, the cost per room is least for Lokhandwala Group.
Which of the following has the maximum number of rooms per crore of rupees?
For the above answer, the ratio of number of rooms to the cost should be maximum. It is maximum for lokhandwala group which is 536/225 = 2.38
Assume that the cost of the project is incurred in the year of completion; interest is charged at the rate of 10% per annum. What is the cost incurred for projects completed in 1998?
Total cost in 1997 = 250 + 225 = 475 Crores.
These projects were completed in 1998 => Interest for 1 year must be added to the cost.
Interest = $$\frac{475*1*10}{100}$$ = 47.5 Crores
Total Amount = 475 + 47.5 = 522.5 Crores.

Assume that the cost of the project is incurred in the year of completion; interest is charged at the rate of 10% per annum. What is the cost incurred for projects completed in 1999?
Total cost of projects that were completed in 1999 is 275 + 235 + 250 + 300 = Rs 1060 Crores.
Interest for 2 years must also be added to this cost => $$1060(1+(0.1))^2$$ = 1060 * 1.21 = Rs 1282.6 Crores
What is the approximate cost incurred for projects completed by 2000? (in crores)
All the projects are completed by 2000. Hence, we need to add the costs of all the projects.
On adding all the costs we get Rs 1785 Crores.
The graph given below shows the quantity of milk and food grains consumed annually along with female and male population (in millions). Use the data to answer the questions that follow.
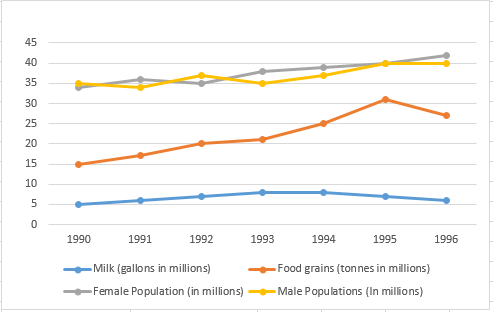
When was the percapita consumption of milk the least?
The population is increasing steadily, but the milk consumed decreased significantly in 1996.
Hence, the only two years we need to check for the least per capita milk consumption are the first year (1990) and 1996.
Milk consumed in 1990 is 5 million gallons.
Total population in 1990 is 34+35 = 69 million.
Hence, per capita consumption of milk in 1990 is 0.072 gallon per person.
Milk consumed in 1996 is 6 million gallons.
Total population in 1996 is 40+42 = 82 million.
Hence, per capita consumption of milk in 1996 is 0.073 gallon per person.
Hence, the year with the least per capita consumption of milk is 1990.

When was the per capita production of foodgrains most?
In this question the total population does not change much in the whole span. So the per capita food grain production will be maximum when the total foodgrain production is maximum. It happens in 1995.
In which year was the difference between the percentage increase in the production of food grains and milk maximum?
The difference is maximum when one quantity is maximum and other quantity is minimum. The percentage increase in production of food grains is maximum in 1995 and the percentage production increase in production of milk is negative for 1995.
If milk contains 320 calories and foodgrains contain 160 calories, in which year was the per capita consumption of calories highest?
The consumption of milk is comparatively lesser than that of food grains and also the consumption of milk does not change by much during the given period.
Hence, the change in food grains is the key to estimate the calorie count.
We can see the spike in consumption of food grains in 1995. Hence, percapita consumption is highest in 1995.

If one gallon milk contains 120 g of a particular nutrient and one tonne of foodgrains contains 80 g of the same nutrient, in which year was the availability of this nutrient maximum?
The maximum availability of the nutrient will be either in 1994 or 1995. because the cumulative production of milk and food grains is maximum in these years.
Availability in 1994 = (120*8) + (25*80) = 2960
Availability in 1995 = (6*120) + (31*80) = 3200
Hence the availability is maximum in 1995.
Referring to the previous question, in which year was the per capita consumption of this nutrient highest?
Ratio of nutrient in milk(1 gallon) and foodgrains(1 tonne) is 3:2
There is a huge spike in the consumption of food grains in 1995.
Total nutrients consumed in 1995 = 30*80 + 7*120 = 3240 million gms.
This is more than any other year.
=> 1995 is the answer
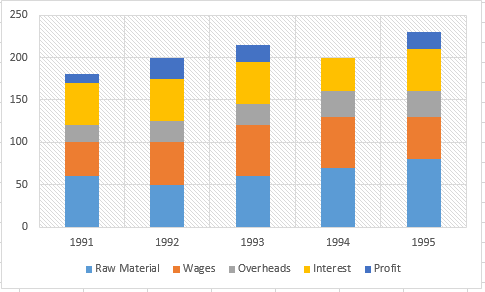
In which year was the increase in raw material maximum?
The raw materials used in 1991 was 55,000
The raw materials used in 1992 was 48,000 (decrease by 7,000)
The raw materials used in 1993 was 60,000 (increase by 12,000)
The raw materials used in 1994 was 65,000 (increase by 5,000)
The raw materials used in 1995 was 75,000 (increase by 10,000)
Hence, the increase in use of raw materials was maximum in 1993

In which period was the decrease in profit maximum (as a percentage)?
The profits of the company became zero only in one year (1994)
Hence, the change in profit is maximum in the period 1993-94 and equals 100%.
Note that there was a decrease in profits in other years also, but the maximum possible change is 100% and it was occurred in 1993-94
Which component of the cost production has remained more or less constant over the period?
Interest has remained constant over the given years attaining the value of 50-60 in all the year. Only in the year 1994, the value of interest is little less.
In which year were the overheads, as a percentage of the raw material, maximum?
Ratio in 1992 = $$\frac{25}{50}$$ = 0.5
Ratio in 1993 = $$\frac{25}{60}$$ = 0.4167
Ratio in 1994 = $$\frac{30}{70}$$ = 0.428
Ratio in 1995 = $$\frac{30}{80}$$ = 0.375
Hence, overheads, as a percentage of raw material, is maximum in 1992.

What percentage of the costs did the profits form over the period?
Total Profit = 10 + 25 + 20 + 0 + 20 = 75
Total Cost = 170 + 175 + 195 + 200 + 210 = 950
% of Profit = $$\frac{75}{950}$$ = 8%
If the interest component is not included in the total cost calculation, which year would show the maximum profit per unit cost?
Ratio in 1991 = $$\frac{10}{120}$$ = 0.833
Ratio in 1992 = $$\frac{25}{125}$$ = 0.2
Ratio in 1993 = $$\frac{20}{145}$$ = 0.138
Ratio in 1995 = $$\frac{20}{160}$$ = 0.125
1992 has maximum profit per unit cost.
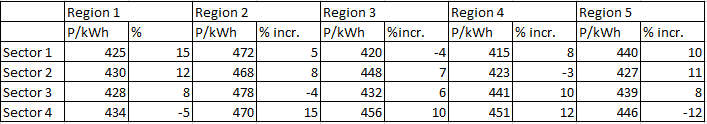
If the amount of power consumed by the various regions in sector 1 is the same, then as compared to 1991-92 the net tariff in 1994-95
Average tariff in Sector 1 in 1994-95 = $$\frac{425 + 472 + 420 + 415 + 440}{5}$$ = 434.4 P/kWh
Average tariff in Sector 1 in 1991-92=$$\frac{\frac{425}{1.15}+\frac{472}{1.05}+\frac{420}{0.96}+\frac{415}{1.08}+\frac{440}{1.1}}{5}$$=408.4 P/kWh
Change =434.4-408.4=26 P/kWh
% Change = $$\frac{26}{408.4}\times 100$$ = 6.5%

What was the approximate average tariff in sector 3 in 1991-92?
Average tariff in sector 3= (428/1.08 + 478/.96 + 432/1.06 + 441/1.1 + 439/1.08)/5 = 421.8 ~ 420
In 1994-95, if there was 10% decrease in the domestic consumption of power as compared to that in 1991-92, what was the consumption of power in the rural sector in 1991-92?
In this data, all the tarrif rates are given. The table does not mention the consumption of electricity in any of the given years. Hence the consumption cannot be determined.
In the given 2 years, what is the total tariff paid by the urban sector?
As we do not know the population of the urban sector and its usage of current, we cannot determine the total cost.

Which of the following statements is true?
Average tariff in region 4 = $$\frac{415 + 423 + 441+ 451}{4}$$ = $$\frac{1730}{4}$$ = 432.5 p/kWh => A is wrong.
In all the four sectors, tariff in region 2 is higher than tariff in region 5.
=> Average tariff in region 2 is higher than average tariff in region 5 => Option B is correct.
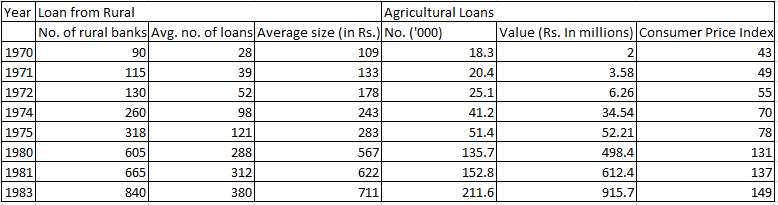
In 1974, the amount of agricultural loans formed what percentage of the total loans?
Total loan from rural in 1974 = $$260 \times 98 \times 243$$ = 6 million (nearly)
Loan for agriculture in 1974 = 34.5 million
Total = 34.5 + 6 = 40.5
%Agriculture loan = $$\frac{34.5}{40.5} \times 100$$ = 85% (Nearly)
From the given data, the number of rural loans up to 1980 formed approximately what percentage of those in 1983?
Number of loans in 1970 = 90*28 = 2520
Number of loans in 1971 = 115*39 = 4485
Number of loans in 1972 = 130*52 = 6760
Number of loans in 1974 = 260*98 = 25480
Number of loans in 1975 = 318*121 = 38478
Number of loans in 1980 = 605*288 = 174240
Sum of these loans = 251963
Number of loans in 1983 = 840*380 = 319200
Ratio = $$\frac{251963}{319200}$$ = 80% approximately.

Which of the following pairs of years showed the maximum increase in the number of rural bank loans?
Number of loans in 1970 = 90 * 28 = 2520
Number of loans in 1971 = 115*39 = 4485
Number of loans in 1972 = 130 * 52 = 6760Number of loans in 1974 = 260 * 98 = 25480
Number of loans in 1975 = 318 * 121 = 38478
Number of loans in 1980 = 605 * 288 = 174240
Number of loans in 1981 = 665 * 312 = 207480
So, the maximum increase in number of loans is in 1980 - 81
What is the value(in millions) of the agricultural loans in 1983 at 1970 prices?
To change the prices from one year to another year, we have to use the Consumer Price Index.
Value in 1983 = 915.7 millions
CPI in 1983 = 149
CPI in 1970 = 43
Required value in 1970 = $$\frac{43}{149}*915.7$$ = Rs 264 million
In which year was the number of rural bank loans per rural bank least?
The second column in the rural bank loans gives us the average number of loans, which is same as the number of rural bank loans per rural bank.
This field is least in 1970.
Hence, 1970 is the answer.

What is the simple annual rate of increase in the number of agricultural loans from 1970 to 1983?
Change = 211.6 - 18.3 = 193.3
% increase = $$\frac{193.3}{18.3}*100$$ = 1056%
This is distributed over 13 years => Average yearly increment = $$\frac{1056}{13}$$ = 81%
If the consumer price index for 1970 is to be taken as 105 and the indices for the subsequent years are to be corrected accordingly, by roughly how many points do the indices for 1983 and 1975 differ?
Difference between CPI of 1983 and 1975 = 149 - 78 = 71
If CPI of 1970, which is 43, is changed to 105, then the value of 71 changes to $$\frac{105}{43}*71$$ = 174
If the consumer price index for 1970 is to be taken as 105 and the indices for the subsequent years are to be corrected accordingly, what is the approximate value of the agricultural loans in 1980 at 1983 prices?
Since the consumer price indices for all years change, the ratios will remain the same as before.
Value of the agricultural loans in 1980 at 1983 prices = 498.4 * 149 / 131 = 570 approx.

A certain race is made up of three stretches: A, B and C, each 2 km long, and to be covered by a certain mode of transport. The following table gives these modes of transport for the stretches, and the minimum and maximum possible speeds (in km/hr) over these stretches. The speed over a particular stretch is assumed to be constant. The previous record for the race is 10 min.
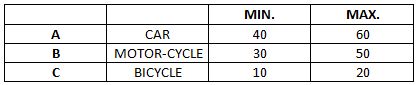
Anshuman travels at minimum speed by car over A and completes stretch B at the fastest speed. At what speed should he cover stretch C in order to break the previous record?
Anshuman travels at a minimum speed by car over A, so the time taken = $$\frac{2}{40}$$*60= 3 min
Anshuman travels stretch B at the fastest speed, so the time taken = $$\frac{2}{50}$$*60= 12/5 min
So in order to break the record, he has to cover the three stretches in less than 10 min
10-(3+$$\frac{12}{5}$$) = $$\frac{23}{5}$$
So the time taken to cover stretch C should be less than $$\frac{23}{5}$$ min.
Let x kmph be the speed at which he covers stretch C
$$\frac{2}{x}$$*60 < $$\frac{23}{5}$$
x > 26.08 kmph but the maximum speed at which he can cover stretch C is 20 kmph.
Hence it is not possible for him to break his previous record.
C is the correct answer.
Mr Hare completes the first stretch at the minimum speed and takes the same time for stretch B. He takes 50% more time than the previous record to complete the race. What is Mr Hare's speed for the stretch C?
Total time taken by Mr. Hare to complete the race = 50% more of (10 min.) = 15 min.= $$\frac{1}{4}$$ hr.
Or $$\frac{1}{4} = \frac{2}{40} + \frac{2}{40} + \frac{2}{v}$$ ( i.e. complete time for strech A,B and C Where v is velocity at strech C)
Or v= 13.3 km./hr
Mr Tortoise completes the race at an average speed of 20 km/hr. His average speed for the first two stretches is four times that for the last stretch. Find the speed over stretch C.
Average speed to cover complete race = 20 km/hr = $$\frac{2+2+2}{t_1 + t_2 + t_3}$$ (Where $$t_1$$ is time taken to cover the distance A, $$t_2$$ is time taken to cover the distance B and $$t_3$$ is time taken to cover the distance C)
So total time =$$ t_1 + t_2 + t_3 = 18$$ min.
Avg. speed for first two streches = $$\frac{4}{t_1 + t_2}$$
Avg. speed for last strech = $$\frac{2}{t_3}$$
Given: $$\frac{4}{t_1 + t_2} = 4 \times \frac{2}{t_3}$$
Or $$2t_1 + 2t_2 = t_3$$
Or $$t_3 = 12$$ min.
So $$V_3 = \frac{2}{12} \times 60$$ = 10 km/hr

What is the average weight of the students in group D?
As data regarding weights of people is not given, hence we can't determine the avg. weight of people in group D
If one student from group A is shifted to group B, which of the following will be true?
As data regarding weights is not available, hence we can't say about the increment or decrement in group A an B
But avg. weight for overall class will remain same as no student went out or came inside to make any changes in total weight or total number of students.
If all the students of the class have the same weight, then which of the following is false?
Except option C, all are correct because if everyone has same weight than avg. weight of all groups remain same.
So avg. weight of D will be equal to avg. weight of A.

A student gets an aggregate of 60% marks in five subjects in the ratio 10 : 9 : 8 : 7 : 6. If the passing marks are 50% of the maximum marks and each subject has the same maximum marks, in how many subjects did he pass the examination?
Let's say he scored marks as $$10x,9x,8x,7x,6x$$ or total of $$40x$$ which is 60% of total maximum marks(T).
$$\frac{T \times 60}{100}=40x$$
So T (total maximum marks)=$$\frac{400x}{6}$$
Or Individual max. marks = $$\frac{T}{5}=\frac{80x}{6}$$
Passing marks =50% of individual max. marks =$$\frac{40x}{6}=6.66x$$
Hence he scored more than passing marks in four subjects as $$10x,9x,8x$$ and $$7x$$ and failed in one subject as scoring $$6x$$ marks which is less than passing marks of $$6.66x$$
In how many ways can eight directors, the vice chairman and chairman of a firm be seated at a round table, if the chairman has to sit between the the vice chairman and a specific director?
Chariman, Vice-Chairman and the director can be made as a group such that Chairman sits between the Vice-Chairman and the director. This group can be formed in 2 ways.
Each of the remaining 7 directors and the group can be arranged in 7! ways.
=> Total number of ways = 2 * 7!.
If $$\log_{2}{\log_{7}{(x^2 - x+37)}}$$ = 1, then what could be the value of ‘x’?
$$\log_{2}{\log_{7}{(x^2 - x+37)}}$$ = 1
$$\log_{7}{(x^2 - x+37)}$$ = $$2$$
$$(x^2 - x+37)$$ = $$7^{2}$$
Given eq. can be reduced to $$x^2 - x + 37 = 49$$
So x can be either -3 or 4.

After allowing a discount of 11.11%, a trader still makes a gain of 14.28%. At how many percentage above the cost price does he mark on his goods?
Let's say cost price is 100
gain = 14.28
selling price = 114.28
Marked price = x(say)
So $$x- \frac{11.11x}{100} = \frac{8x}{9} = 114.28$$
Or $$x = 128.52$$
So marked price is 28.52% more than cost price.
If n is an integer, how many values of n will give an integral value of $$\frac{(16n^2+ 7n+6)}{n}$$ ?
Expression can be reduced to 16n + 7 + $$\frac{6}{n}$$
Now to make above value an integer n can be 1,2,3,6,-1,-2,-3,-6
Hence answer will be D).
A dealer buys dry fruits at Rs. 100, Rs. 80 and Rs. 60 per kilogram. He mixes them in the ratio 3 : 4 : 5 by weight, and sells at a profit of 50%. At what price per kilogram does he sell the dry fruits?
Let's say he buy fruits of weights 3 kg., 4kg., 5 kg.
Total kilograms of dry fruits $$=3+4+5=12$$
Overall cost price $$=3\cdot100+4\cdot80+5\cdot60=300+320+300=920$$
So cost price per kg. $$=\dfrac{300+320+300}{12} = \dfrac{920}{12}$$
Selling price = $$\dfrac{920}{12} \times \dfrac{3}{2}$$ = 115 per kg (Since Profit is 50%)
Hence answer will be D.

Fresh grapes contain 90% water while dry grapes contain 20% water. What is the weight of dry grapes obtained from 20 kg fresh grapes?
Let the total weight of fresh grapes be 100 gm.
=> Fresh grapes have 90 gm of water and 10 gm of fruit.
When these grapes are dried, the amount of fruit does not change.
=> 10 grams will become 80% of the content in dry grapes
=> Weight of dry grapes = $$\frac{10}{0.8}$$ = 12.5 gm
So, the weight of fresh grapes reduces to 1/8th of its original weight.
=> 20 kg of fresh grapes give 2.5 kg of dry grapes.
An express train travelling at 80 km/hr overtakes a goods train, twice as long and going at 40 km/hr on a parallel track, in 54 s. How long will the express train take to cross a platform of 400 m long?
Let's say length of express train = $$x$$
So length of goods train = $$2x$$
Total length travelled by express train = $$3x = ((80-40) \times \frac{5}{18}) \times 54 $$ (Where $$(80-40) \times \frac{5}{18})$$ = relative velocity of express train w.r.t. goods train in meter/sec.)
So $$x =200$$ meter.
Now crossing a plateform of length 400 m., total length travelled by train = 600 m=$$t\times(80 \times \frac{5}{18})$$
$$t = 27$$ sec.
A student instead of finding the value of 7/8 of a number, found the value of 7/18 of the number. If his answer differed from the actual one by 770, find the number.
let's say number is x.
So $$\frac{7x}{8} - \frac{7x}{18} = 770$$
or $$x = 1584$$

P and Q are two positive integers such that PQ = 64. Which of the following cannot be the value of P + Q?
When PQ = 64
Possible values of P and Q are as follows:
64 and 1 ; 32 and 2 ; 16 and 4 ; 8 and 8
So possible sums are 65,34,20 and 16
Hence answer would be D)
The average marks of a student in 10 papers are 80. If the highest and the lowest scores are not considered, the average is 81. If his highest score is 92, find the lowest.
Total marks = 80 x 10 = 800
Total marks except highest and lowest marks = 81 x 8 = 648
So Summation of highest marks and lowest marks will be = 800 - 648 = 152
When highest marks is 92, lowest marks will be = 152-92 = 60
If the roots $$x_1$$ and $$x_2$$ are the roots of the quadratic equation $$x^2 -2x+c=0$$ also satisfy the equation $$7x_2 - 4x_1 = 47$$, then which of the following is true?
$$x_1 + x_2 = 2$$
and $$7x_2 - 4x_1 = 47$$
So $$x_1 = -3$$ and $$x_2 = 5$$
And $$c = x_1 \times x_2 = -15$$
The sum of the areas of two circles, which touch each other externally, is $$153\pi$$. If the sum of their radii is 15, find the ratio of the larger to the smaller radius.
Given:
$$\pi((r_1)^2 + (r_2)^2) = 153\pi$$
So
$$(r_1)^2 + (r_2)^2 = 153$$
Or $$((r_1) + (r_2))^2 - 2(r_1)(r_2) = 153$$
Or $$(r_1)(r_2) = 36$$ and $$(r_1) + (r_2) = 15$$
$$r_1 = 12$$
$$r_2 = 3$$
Ratio = 4
If m and n are integers divisible by 5, which of the following is not necessarily true?
Let's say m=5k and n=5t
So m-n = 5(k-t) will be divisible by 5.
$$m^2 - n^2 = 25(k^2 - t^2)$$ will be divisible by 5.
$$m+n = 5(k+t)$$ will be divisible by 5 but not necessarily with 10.
Which of the following is true?
$$7^{(3^2)} = 7^9$$
$$(7^3)^2 = 7^6$$
So $$7^{(3^2)} > (7^3)^2$$

What is the maximum percentage of people who can watch all the three channels?
Let a be the number who watch only one channel, b be the number who watch only 2 channels and c be the number who watch all channels.
a+b+c = 100
a+2b+3c = 80+22+15 =117
Subtracting both equations,
b+2c = 117-100 = 17
Maximum c occurs when b = 0
2c = 17
c = 8.5
If 5% of people watched DD and CNN, 10% watched DD and BBC, then what percentage of people watched BBC and CNN only?
Applying AUBUC formula
Let x be the number who watch BBC and CNN and y be the number who watch all three channels.
100 = 80+22+15-(10+5+x)+y
x-y = 2
Hence only 2% people watch BBC and CNN only.
Referring to the previous question, what percentage of people watched all the three channels?
Applying AUBUC formula
Let x be the number who watch BBC and CNN and y be the number who watch all three channels.
100 = 80+22+15-(10+5+x)+y
x-y = 2
We cannot find the exact value of y.
Hence, the answer is "cannot be determined".

A man earns x% on the first Rs. 2,000 and y% on the rest of his income. If he earns Rs. 700 from income of Rs. 4,000 and Rs. 900 from Rs. 5,000 of income, find x%.
He earns x% on first 2000 and y% on rest of his income.
So on 4000 rs. , he will earn as follows:
$$2000 \frac{x}{100} + 2000 \frac{y}{100}$$ = 700
Or $$x+y = 35$$
Similarly on 5000 rs. ,he will earn 900 as follows:
$$2000 \frac{x}{100} + 3000 \frac{y}{100} = 900$$
Or $$20x + 30y = 900$$
On solving above equations, we will get value of x = 15
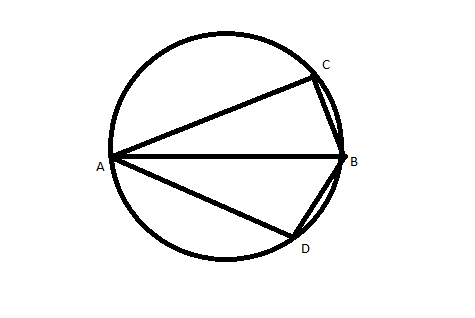
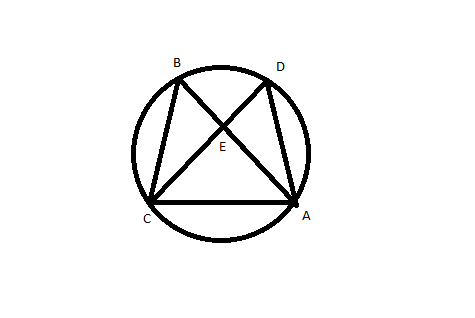
AB is the diameter of the given circle, while points C and D lie on the circumference as shown. If AB is 15 cm, AC is 12 cm and BD is 9 cm, find the area of the quadrilateral ACBD.
Since ACBD is cyclic quadrilateral with diagonals as AB = 15 ad CD.
So area = $$\frac{1}{2} \times (AB) \times (CD)$$ eq.(1)
Triangle ACB and ABD is right angled triangle
Let's say angle CBA = $$\theta$$
so $$CD = 2 \times (9 sin\theta)$$ (Where $$sin\theta$$ = $$\frac{12}{15}$$)
CD = $$\frac{72}{5}$$
Putting values in eq. (1) , we will get area = 108 sq.cm.
Hence answer will be D)
P, Q and R are three consecutive odd numbers in ascending order. If the value of three times P is 3 less than two times R, find the value of R.
Let's say three numbers are (a-2),a,(a+2)
So 3(a-2) = 2(a+2) - 3
a=7 and a+2 = R = 9

Given that $$x >y> z> 0$$. Which of the following is necessarily true?
Best approach to these type question remain assuming values and checking
Case - 1.x=8 ; y=7 ; z = 5
la (x,y,z) = 12
le (x,y,z) = 2
ma (x,y,z) = 7
Case -2: Let us try to find values for which la(x,y,z) and le(x,y,z) would be equal. In such a case, ma(x,y,z) would also be the same.
So max(x-y,y-z)= min(x+y, y+z)
As x>y>z>0, min(x+y, y+z) = y+z
So max(x-y, y-z) =y+z
Either x-y=y+z or y-z = y+z
So x=2y+z or z=0
But z cannot be 0 according to given condition.
So, x=2y+z
Let us assume y=2 and z=1
So x=5
la (x,y,z)= 3
le (x,y,z) = 3
ma (x,y,z)= 3
based on these two cases we can deduce that non of the given options holds true.
So the correct option to choose is D - None of these.
What is the value of ma(10, 4, le((la10, 5, 3), 5, 3))?
$$Ma(10, 4, le((la10, 5, 3), 5, 3))$$
Or $$Ma(10, 4, le(8, 5, 3))$$
Or $$Ma (10,4,3)$$
Or $$\frac{1}{2} (6+7) = 6.5$$
For x=15, y=10 and z=9 , find the value of le(x, min(y, x-z), le(9, 8, ma(x, y, z)).
Given expression can be reduced to
le(15, min(10,15-9) , le(9,8,12))
Or le(15,6,1) = 9

ABC is a three-digit number in which A > 0. The value of ABC is equal to the sum of the factorials of its three digits. What is the value of B?
The values of 1!, 2!, 3!, 4!, 5!, 6! and 7! are 1, 2, 6, 24, 120, 720 and 5040 respectively.
So, the digits must lie from 1 to 6 only to satisfy the conditions.
6 cannot be one of the digits as the at least one digit in the final number is more than 6.
145 = 1! + 4! + 5!
The adjoining figure shows a set of concentric squares. If the diagonal of the innermost square is 2 units, and if the distance between the corresponding corners of any two successive squares is 1 unit, find the difference between the areas of the eighth and the seventh squares, counting from the innermost square.

Diagonal of 8th square will be = 16
Side of 8th square = $$\frac{16}{\sqrt2}$$
Diagonal of 7th square will be = 14
Side of 7th square = $$\frac{14}{\sqrt2}$$
Difference in areas = $$(\frac{16}{\sqrt2})^2 - (\frac{14}{\sqrt2})^2$$ = 30
A, B and C are defined as follows.
A=$$( 2.000004) \div ((2.000004)^2+ 4.000008)$$ ;
B = $$(3.000003) \div ((3.000003)^2+9.000009)$$
C= $$(4.000002) \div ((4.000002)^2 + 8.000004)$$
Which of the following is true about the values of the above three expressions?
Given expressions can be reduced as follows
A = $$\frac{1}{4.000004}$$
B = $$\frac{1}{6.000003}$$
C = $$\frac{1}{6.000002}$$
Among all of them B is smallest.
The value of each of a set of coins varies as the square of its diameter, if its thickness remains constant, and it varies as the thickness, if the diameter remains constant. If the diameter of two coins are in the ratio 4 : 3, what should be the ratio of their thickness' be if the value of the first is four times that of the second?
Value of coin = $$k (2r)^2 t$$ (where k is proportionality constant, 2r is diameter and t is thickness)
So (value of first coin) = 4 (value of second coin)
$$k (2r_1)^2 t_1 = 4 \times (k(2r_2)^2 t_2)$$
or $$\frac{t_1}{t_2} = \frac{9}{4}$$ (As ratio of diameters 2r will be 9:4)
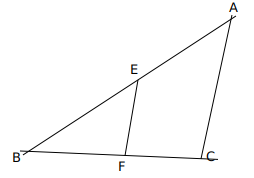
In ABC, points P, Q and R are the mid-points of sides AB, BC and CA respectively. If area of ABC is 20 sq. units, find the area of PQR.
As we know, the triangle joining midpoints of sides will divide it in 4 similar traingles of equal area.
So area will be = $$\frac{20}{4} = 5$$
In a rectangle, the difference between the sum of the adjacent sides and the diagonal is half the length of the longer side. What is the ratio of the shorter to the longer side?
Consider rectangle with shorter side as $$y$$, longer side as $$x$$ and diagonal as $$z$$.
So $$(x+y) - z = \frac{x}{2}$$ => x/2+y=z
Where $$z^2=x^2 + y^2$$
So, $$(x/2 +y)^2$$ = z
squaring on both sides and after putting value of z and solving we can get ratio of y to x as 3:4
Raja starts working on February 25(Sunday), 1996, and finishes the job on March 2, 1996. How much time would T and J take to finish the same job if both start on the same day as Raja?
Raja takes 7 days to complete the job.
Feb 25, 1996 is a Sunday.
If T and J start working on Sunday, they can complete the work by wednesday because T would have worked for 3 days and J would worked for 4 days, thereby matching the number of days worked by Raja.
Hence, they can complete the job in 4 days.
Starting on February 25, 1996 (Sunday), if Raja had finished his job on April 2, 1996, when would T and S together likely to have completed the job, had they started on the same day as Raja?
The number of days taken by Raja to complete the work is 5+31+2 = 38
So, cumulative number of days needed by T and S to complete the work is 38.
Both of them take two days off in a week as S takes of on Saturday and Sunday and T takes off on Tuesday and Thursday.
So, total number of man-working days per week by the duo is 10.
Hence, after three weeks, they finish 30 man working days.
i.e by end of 17th March 1996 (Sunday), 30 man working days are finished.
Both of them work on Monday,
S works on Tuesday
Both of them work on Wednesday
S works on Thursday
Both of them work on Friday and the remaining 8 man working days are also over.
Hence, the required date is 17+5 = 22 March 1996 (Friday)
If his journey, including stoppage, is covered at an average speed of 180 mph during the journey from Frankfurt to India, what is the distance between Frankfurt and India?
X leaves Frankfurt at 6 PM and reaches Boston at 10 AM, which is 6 AM in Frankfurt => 12-hour journey
Leaves Boston at 12 PM ad reaches India at 1 AM, which is 11 PM in Boston => 11-hour journey
=> Total time = 12 + 2 + 11 = 25 hours
Average speed = 180 mph
=> Distance = 25 * 180 = 4500 miles
If X had started the return journey from India at 2.55 a.m. on the same day that he reached there, after how much time would he reach Frankfurt?
X leaves Frankfurt at 6 PM and reaches Boston at 10 AM, which is 6 AM in Frankfurt => 12-hour journey
Leaves Boston at 12 PM ad reaches India at 1 AM, which is 11 PM in Boston => 11-hour journey
=> Total time = 12 + 2 + 11 = 25 hours
Return journey is 1 hour lesser => 25 - 1 = 24 hours.
What is X's average speed for the entire journey (to and fro)?
Distance is not known to find the average speed.
=> Data insufficient
In the adjoining figure, points A, B, C and D lie on the circle. AD = 24 and BC = 12. What is the ratio of the area of CBE to that of ADE?
As we know angles of same sectors are equal
Hence angle B and angle D will be equal. Angle BCE and angle EAD will be equal.
So triangles BCE and EAD will be similar triangles with sides ratio as 12:24 or 1:2.
Area will be in ratio of 1:4.
In the given figure, EADF is a rectangle and ABC is a triangle whose vertices lie on the sides of EADF and AE = 22, BE = 6, CF = 16 and BF = 2. Find the length of the line joining the mid-points of the sides AB and BC.
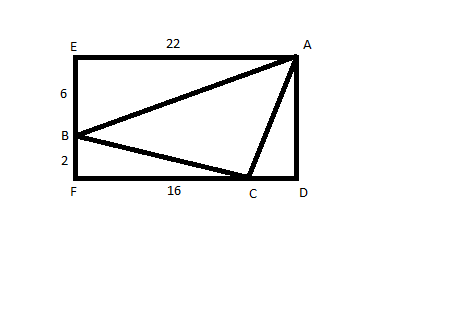
$$AC^2 = 8^2 + 6^2 = 100$$
So AC = 10
$$\frac{10}{EF}$$ = 2
EF = 5
Length of line joining mid-points will be = 5
At what time did X catch the thief?
Time taken to catch the thief = $$\frac{d}{v}$$ (Where d is relative distance achieved in 15 min. = 15km. and v is relative velocity of poiliceman i.e. = 65-60 = 5 kmph)
So time taken = 3hr.
Hence he will catch thief at 3:15 pm
If another policeman had started the same chase along with X, but at a speed of 60 km/hr, then how far behind was he when X caught the thief?
As relative velocity of other poilceman will be 0 , hence distance remain same as starting i.e. = 15 km.
What is the value of $$a^3 + b^3$$ ?
I. $$a^2 + b^2 = 22$$
II. $$ab = 3$$
Considering first statement only, nothing absolute can be said about the value of $$a^3 + b^3$$ similarly considering 2nd statement only nothing absolute can be said about the value of $$a^3 + b^3$$.
When we consider both statements together two values of (a+b) can be possible as $$\sqrt{28}$$ and $$-\sqrt{28}$$
By which two possible values of $$a^3 + b^3$$. Nothing absolute can be said about it.
Hence answer will be D).
Is the number completely divisible by 99?
I. The number is divisible by 9 and 11 simultaneously.
II. If the digits of the number are reversed, the number is divisible by 9 and 11.
99 = 9 * 11 => If the number is divisible by 9 and 11, then the number is divisible by 99.
=> We can answer the question using only statement I.
The divisibility rule of 9 is that the sum of the digits in the number must be divisible by 9.
The divisibility rule of 11 is that the difference of sums of digits in odd places and digits in even places must be a multiple of 11.
According to statement II, if the number is reversed then the number is divisible by 9 and 11 => Divisible by 99.
Now, on reversing the number again, the number is still divible by 99 because the sum of the digits remains the same and also the difference of sums of digits in odd places and digits in even places remains the same.
Hence, the question can be answered using either of the statements alone.
A person is walking from Mali to Pali, which lies to its north-east. What is the distance between Mali and Pali?
I. When the person has covered $$\frac{1}{3}$$ the distance, he is 3 km east and 1 km north of Mali.
II. When the person has covered $$\frac{2}{3}$$ the distance, he is 6 km east and 2 km north of Mali.
Considering first statement alone, we can calculate 1/3rd of the complete distance as $$\sqrt{1^2 + 3^2}$$ Hence, we can evaluate complete distance too.
Considering second statement alone, we can calculate 2/3rd of the complete distance as $$\sqrt{2^2 + 6^2}$$ Hence, we can evaluate complete distance too.
So answer will be B as complete distance can be calculated by using any of the statement alone.
What is the value of x and y?
I. 3x + 2y = 45
II. 10.5x + 7y = 157.5
Considering first statement alone,
As there are 2 variables x and y, and one equation we can't say anything absolute about values of x and y.
Considering second statement alone,
With 2 variables and one equation, we can't say anything absolute about variables x and y.
Even considering both statements together, we can't find values of x and y as equation in 2nd statement is same as in 1st statement after multiplying it 3.5
Three friends P, Q and R are wearing hats, either black or white. Each person can see the hats of the other two persons. What is the colour of P's hat? I. P says that he can see one black hat and one white hat. II. Q says that he can see one white hat and one black hat.
Considering first statement alone:
Nothing absolute can be said about the hats of Q and R, as Q might have black hat or white hat similarly R might have white or black hat as seen by P.
Considering second statement alone:
Nothing absolute can be said about the hats of P and R as they can have either Black or White caps
Even considering both statements together, we were not be able to reduce the possibilities of having black hats and white hats
Hence answer will be D.
What is the speed of the car?
I. The speed of a car is 10 (km/hr) more than that of a motorcycle.
II. The motorcycle takes 2 hr more than the car to cover 100 km.
Let the speed of the car be x.
Using both the statements, we get a quadratic equation in x.
This equation will have 2 roots, one positive root and one negative root. So, we have to consider only the positive root.
The question can, therefore, be answered by using both the statements together.
What is the ratio of the volume of the given right circular cone to the one obtained from it?
I. The smaller cone is obtained by passing a plane parallel to the base and dividing the original height in the ratio 1 : 2.
II. The height and the base of the new cone are one-third those of the original cone.
Considering 1st statement alone:
As height is reduced to 1/3rd of it, radius will also get reduced 1/3rd of complete cone
Now we know volume is directly proportional to product of square of radius and height , we can calculate ratio of volumes.
Similarly considering 2nd statement alone, we can calculate ratio of volumes as we will have sufficient information regarding radius and height.
So answer will be B
What is the area bounded by the two lines and the coordinate axes in the first quadrant?
I. The lines intersect at a point which also lies on the lines 3x - 4y = 1 and 7x - 8y = 5.
II. The lines are perpendicular, and one of them intersects the Y-axis at an intercept of 4.
Considering 1st statement alone:
We can find only one coordinate regarding both lines, which is insufficient information to calculate area.
Considering 2nd statement alone:
We have only one coordinate , regarding one line with insufficient information to calculate area.
Now if we consider both statements together, we can find points where lines are meeting co-ordinate axis and then area.
So our answer will be C.
What is the cost price of the chair?
I. The chair and the table are sold at profits of 15% and 20% respectively.
II. If the cost price of the chair is increased by 10% and that of the table is increased by 20%, the profit reduces by Rs. 20.
Let the cost price of the Chair be x and that of the table be y.
Using statement 1)
Hence we get the total selling price = 1.15x + 1.2y and profit = 0.15x + 0.2y
Using this alone we can't find the cost price of the chair.
Using Statement 2)
Total cost price = 1.10 x + 1.2y
Using Statement 1 and 2 together,
We get profit in second case = 0.05x.
Reduction in profit = (0.15x + 0.2y) - 0.05x = 0.1x + 0.2y = 20
Hence we can't deduce the value of x even after using both statements together.
After what time will the two persons Tez and Gati meet while moving around the circular track? Both of them start at the same point and at the same time.
I. Tez moves at a constant speed of 5 m/s, while Gati starts at a speed of 2 m/s and increases his speed by 0.5 m/s at the end of every second thereafter.
II. Gati can complete one entire lap in exactly 10 s.
From Statement 1, we know the speed of each runner.
From Statement 2, we can calculate the length of the track as we know the speed of runner every second.
But the answer cannot be determined as we do not know the direction of each runner.
Select the pair that best expresses a relationship similar to the one expressed in the question pair. Peel : Peal
Peel and Peal sound fairly similar but have completely different meanings. Peel is used to as a verb to remove the outer coating of fruits, etc. Peal is a noun and relates to the sound made by ringing bells. Similarly rain and reign sound fairly alike but mean very different and also have noun and verb difference.
Select the pair that best expresses a relationship similar to the one expressed in the question pair. Doggerel : Poet
Doggerel is a type of poetry and hence poet is associated with doggerel. Similarly pul fiction is a type of novel and hence novelist is associated with it.
Select the pair that best expresses a relationship similar to the one expressed in the question pair. Premise : Conclusion
In this analogy, a conclusion is derived from a premise. Similarly inference is derived from assumption. Marketing is not derived from brand. Neither is idea or books derived from hypothesis or knowledge. Option A is correct.
Select the pair that best expresses a relationship similar to the one expressed in the question pair.
Barge : Vessel
Barge and vessel are synonyms for a large boat.
Shovel and implement are synonyms for a tool used for a particular purpose.
Hence, shovel and implement share the same relationship as barge and vessel.
Select the pair that best expresses a relationship similar to the one expressed in the question pair. Love : Obsession
Obsession is an extreme form of love. Similarly Misery is an extreme form of Sorrow. Hence option d is correct.
Select the pair that best expresses a relationship similar to the one expressed in the question pair. Reptile : Adder
Adder is a type of a reptile.
Tyrannosauraus is a type of Dinosaur. The relationship is similar to that of Adder and Reptile.
Hence, option D is the answer.
Choose the set in which the third statement logically follows from the first two.
A. No bird is viviparous.
B. All mammals are viviparous.
C. Bats are viviparous.
D. No bat is a bird.
E. No bird is a mammal.
F. All bats are mammals.
Option A => ADC
No bird is viviparous or a bird. C is not related to this statement => ADC is wrong.
Option B => ABE
No bird is viviparous and all mammals are viviparou => We can infer that no bird is vivaparous => ABE is correct
Choose the set in which the third statement logically follows from the first two.
A. No mother is a nurse.
B. Some nurses like to work.
C. No woman is a prude.
D. Some prude are nurses.
E. Some nurses are women.
F. All women like to work.
Option A => ABE
No mother is nurse and some nurses like to work => We cannot infer anything from this information.
Option B => CED
No woman is a prude and some nurses are women => We can say that some nurses are not prude but statement D cannot be inferred.
Option C => FEB
Some nurses are women and all women like to work => Some nurses like to work.
=> Option C is the answer.
Choose the set in which the third statement logically follows from the first two.
A. Oranges are sweet.
B. All oranges are apples.
C. Some sweet are apples.
D. Some oranges are apples.
E. All sweet are sour.
F. Some apples are sour.
Option A: DAC
Oranges are sweet and some oranges are apples => Some apples are sweet.
We can also say that some sweet are apples.
Hence, C logically follows from D and A.
Choose the set in which the third statement logically follows from the first two.
A. Zens are Marutis.
B. Zens are fragile.
C. Marutis are fragile.
D. Opels are fragile.
E. Marutis are Opels.
F. Opels are stable.
Option A => ACB
Zens are Marutis and Marutis are fragile => Zens are fragile
Hence, option A is the answer.
Choose the set in which the third statement logically follows from the first two.
A. Dogs sleep in the open.
B. Sheep sleep indoors.
C. Dogs are like sheep.
D. All indoors are sheep.
E. Some dogs are not sheep.
F. Some open are not sheep.
Option A: AFE
Dogs sleep in the open and some open are not sheep. E need not follow these statements because there is a possibility that all dogs sleep in open that are sheep.
Option B: DCA
All indoors are sheep and dogs are like sheep. Statement A is unrelated to this. Hence, option B is wrong.
Option C: ABE
A and B contain 4 sets => Not related. Hence, E cannot be inferred.
=> None of these is the answer.
Select a pair of sentences that relate logically to the given statement. Either Sam is ill, or he is drunk.
A. Sam is ill.
B. Sam is not ill.
C. Sam is drunk.
D. Sam is not drunk.
Either Sam is ill, or he is drunk.
So, we can say "if Sam is not drunk then he is ill" and "if Sam is not ill, then he is drunk".
=> BC and DA can be answers.
Only DA is present in the options => Option B is the answer.
Select a pair of sentences that relate logically to the given statement. Whenever Ram hears of a tragedy, he loses sleep.
A. Ram heard of a tragedy.
B. Ram did not hear of a tragedy.
C. Ram lost sleep.
D. Ram did not lose sleep.
Whenever Ram hears of a tragedy he loses sleep.
Ram heard a tragedy => He lost sleep
Ram did not lose sleep => He did not hear a tragedy.
So, AC and DB are both answers.
Among the options, only DB is present.
Hence, option C is the answer.
Select a pair of sentences that relate logically to the given statement. Either the train is late, or it has derailed.
A. The train is late.
B. The train is not late.
C. The train is derailed.
D. The train is not derailed.
If the train is derailed, it is late but if the train is late that does not mean that the train is derailed. The train can be late due to several other factors of which derailing is only one of the factors. If the train is not late , this means that the train has not derailed.
Select a pair of sentences that relate logically to the given statement.
When I read a horror story I have a nightmare.
A. I read a story.
B. I did not read a horror story.
C. I did not have a nightmare.
D. I had a nightmare.
When I read a horror story I have a nightmare.
Read a horror story => Have a nightmare
No nightmare => Did not read a horror story.
According to this, CB is the correct answer.
Select a pair of sentences that relate logically to the given statement. When I eat berries I get rashes.
A. I ate berries.
B. I did not get rashes.
C. I did not eat berries.
D. I got rashes.
When I eat berries I get rashes means getting rashes is sure when I eat berries. Eating berries is in the domain of getting rashes. Not getting rashes is outside the domain of getting rashes which means not getting rashes means not eating berries. Hebce the answer is BC.
This government has given subsidies to the Navratnas but there is no telling 'whether the subsequent one will do'.
In the quoted portion, "whether the subsequent one will do" , the subsequent refers to the subsequent government. The correct usage will be "whether the subsequent one will do so."
Rahul Bajaj has done a great job of taking the company to its present status, but it is time that he 'let go off the reins'.
"Let go of the reins" means to loosen the control. Option A is correct.
With the pick up in the standard of education, expensive private schools have 'started blooming up in every corner of the country'.
Mushrooming means to spread and develop quickly. Hence option C is correct. Option A is incorrect as blooming means to flourish. The author wants to highlight the spreading of private schools. Hence blooming is incorrect.
'It is important that' whatever else happens, these two factors should not be messed around with.
This statement is contextually and grammatically correct and there is no error in this sentence.
'It must be noticed' that under no circumstance should the company go in for diversification.
When we notice something, we experience a glimpse of something or observe the event or the thing superficially. In this sentence must is used which conveys a sense of compulsion. Hence the correct answer is "It must be noted"
An act of justice closes the book on a misdeed; an act of vengeance ___.
"Justice" and "Vengeance" are contextually very different in meaning. A justice makes the victim feel satisfied, that is, it closes the book on misdeed. Whereas vengeance starts the chain and this act continues. Option C correctly summarizes the point.
This is about ___ a sociological analysis can penetrate.
This sentence tells the outer limits of sociological analysis can penetrate. The correct option is B. Option C and Option D are grammatically incorrect. "About" and "just" cannot be written simultaneously. Option A is incorrect as it does not make any sense. The best alternative is Option B.
I am always the first to admit that I have not accomplished anything that I ___ achieve five years ago.
The things which we want to accomplish are set out. So the correct usage is "I am always the first to admit that I have not accomplished anything that I set out to achieve five years ago."
This is not the first time that the management has done some ___.
Doing tough talking means to talk in a way such that one fears you. Option B is correct in this context.
In India the talent is prodigious, and it increases ___.
Talent cannot be measured. So the talent cannot be measured annually or each year. Between progressively and year by year, the latter one is a good fit.
Fill in the Blanks: The present constitution will see ___ amendments but its basic structure will survive.
Option C and Option D are grammatically incorrect. Amendments are countable noun so it is many more. The correct sentence is "The present constitution will see many more amendments but its basic structure will survive."
Fill in the Blanks: Taking risks, breaking the rules, and being a maverick have always been important for companies, but, today, they are ___.
Option b and option c are eliminated because they are incomplete comparisons. When we say "more crucial" it is in comparison to something else. Among option a and option d, option a is more suitable because it shows the urgency in much more plausible manner.
Fill in the Blanks: Education is central because electronic networks and software-driven technologies are beginning to ___ the economic barriers between nations.
"Break Down" is the correct usage as break down means to remove something.
Arrange sentences A, B, C and D between sentences 1 and 6, so as to form a logical sequence of six sentences.
1. Whenever technology has flowered, it has put man's language — developing skills into overdrive.
A. Technical terms are spilling into mainstream language almost as fast as junk — mail is slapped into e-mail boxes.
B. The era of computers is no less.
C. From the wheel with its axle to the spinning wheel with its bobbins, to the compact disc and its jewel box, inventions have trailed new words in their wake.
D. "Cyberslang is huge, but it's parochial, and we don't know what will filter into the large culture," said Tom Dalzell, who wrote the slang dictionary Flappers 2 Rappers.
6. Some slangs already have a pedigree.
The first sentence is putting man's skill into overdrive. Option C continues the theme where it substantiates with the help of an example. Option B introduces the computer era. Option A continues the theme of computer era. Option D continues the them where a slang is stated. 6 correctly concludes the sentence.
Arrange sentences A, B, C and D between sentences 1 and 6, so as to form a logical sequence of six sentences.
1. Until the MBA arrived on the scene the IIT graduate was king.
A. A degree from one of the five IITs was a passport to a well-paying job, great prospects abroad and, for some, a decent dowry to boot.
B. From the day he or she cracked the Joint Entrance Examination, the IIT student commanded the awe of neighbours and close relatives.
C. IIT students had, meanwhile, also developed their own special culture, complete with lingo and attitude, which they passed down.
D. True, the success stories of IIT graduates are legion and they now constitute the cream of the Indian diaspora.
6. But not many alumni would agree that the IIT undergraduate mindset merits a serious psychological study, let alone an interactive one.
The passage talks about IIT graduate being a king. Statement B should be the first sentence as it explains why IIT graduates were kings. Statement A further elaborates on the same point as B so it should follow B. We have two possible arrangements, BACD and BADC, The last statement starts with 'but' so the previous statement should have some positive talk about IIT. D is the statement which talks about IITians in positive light. So D should be the last sentence. Hence BACD is the right order.
Arrange sentences A, B, C and D between sentences 1 and 6, so as to form a logical sequence of six sentences.
1. Some of the maharajas, like the one at Kapurthala, had exquisite taste.
A. In 1902, the Maharaja of Kapurthala gave his civil engineer photographs of the Versailles Palace and asked him to replicate it, right down to the gargoyles.
B. Yeshwantrao Holkar of Indore brought in Bauhaus aesthetics and even works of modern artists like Brancusi and Duchamp.
C. Kitsch is the most polite way to describe them.
D. But many of them, as the available light photographs show, had execrable taste.
6. Like Ali Baba's caves, some of the palaces were like warehouses with the downright ugly next to the sublimely aesthetic.
Sentence A is the first sentence as it follows the tone of kings having aesthetic taste. Sentence B follows A as it continues with describing the aesthetic tastes of the kings. Sentence D extends the subject followed by sentence C. Sentence 6 concludes the passage.
Arrange sentences A, B, C and D between sentences 1 and 6, so as to form a logical sequence of six sentences.
1. There, in Europe, his true gifts unveiled.
A. Playing with Don Cherie, blending Indian music and jazz for the first time, he began setting the pace in the late 70s for much of what present — day fusion is.
B. John McLaughlin, the legendary guitarist whose soul has always had an Indian stamp on it, was seduced immediately.
C. Fusion by Gurtu had begun.
D. He partnered Gurtu for four years, and 'natured' him as a composer.
6. But for every experimental musician there's a critic nestling nearby.
Sentence A is the first sentence as it highlights he true gifts mentioned in the starting. Option B follows A which describes its impact on Laughlin. Option D follows B which mentions that he natured him as composer. Option C desribes the result and sentence 6 concludes it properly.
Arrange sentences A, B, C and D between sentences 1 and 6, so as to form a logical sequence of six sentences.
1. India, which has two out of every five TB patients in the world, is on the brink of a major public health disaster.
A. If untreated, a TB patient can die within five years.
B. Unlike AIDS, the great curse of modern sexuality, the TB germ is airborne, which means there are no barriers to its spread.
C. The dreaded infection ranks fourth among major killers worldwide.
D. Every minute, a patient falls prey to the infection in India, which means that over five lakh people die of the disease annually.
6. Anyone, anywhere can be affected by this disease.
Take a look at the last sentence of the paragraph:"Anyone, anywhere can be affected by this disease." This is connected to B. So B is the last sentence. Option C is the proper starting sentence which talks about its prevalence. Option A is the logical follwer of option C which highlights the status of India on TB. Option D follows A. The correct sequence is CADB.
Arrange the sentences A, B, C and D in a proper sequence so as to make a coherent paragraph.
A. It begins with an ordinary fever and a moderate cough.
B. India could be under attack from a class of germs that cause what are called atypical pneumonias.
C. Slowly, a sore throat progresses to bronchitis and then pneumonia and respiratory complications.
D. It appears like the ordinary flu, but baffled doctors find that the usual drugs don't work.
Sentence B introduces the main subject of the paragraph which is atypical pneumonias. Sentence D describes its appearance in human beings. Sentence A and C describe its symptoms and concludes thee passage. So the correct sequence is BDAC.
Arrange the sentences A, B, C and D in a proper sequence so as to make a coherent paragraph.
A. Chemists mostly don't stock it: only a few government hospitals do but in limited quantities.
B. Delhi's building boom is creating a bizarre problem: snakes are increasingly biting people as they emerge from their disturbed underground homes.
C. There isn't enough anti-snake serum, largely because there is no centralised agency that distributes the product.
D. If things don't improve, more people could face paralysis, and even death.
Sentence B introduces the main subject of the paragraph, i.e., snake bites. Sentence C extends the problem by giving the illustration of shortage of anti snake serums. Sentence A highlights the reason for C. Sentence D concludes it properly. The correct sequence is BCAD.
Arrange the sentences A, B, C and D in a proper sequence so as to make a coherent paragraph.
A. But the last decade has witnessed greater voting and political participation by various privileged sections.
B. If one goes by the earlier record of mid-term elections, it is likely that the turnout in 1998 will drop by anything between four and six percentage points over the already low polling of 58 per cent in 1996.
C. If this trend offsets the mid-term poll fatigue, the fall may not be so steep.
D. Notwithstanding a good deal of speculation on this issue, it is still not clear as to who benefits from a lower turnout.
Sentence B introduces the main subject of the passage where it states the low turnaround in the elections. Sentence A offers the present context of the issue presented in A. Sentence C offers the result of the trend in A. Sentence D concludes it properly.
The correct sequence is BACD
Arrange the sentences A, B, C and D in a proper sequence so as to make a coherent paragraph.
A. After several routine elections there comes a 'critical' election which redefines the basic pattern of political loyalties, redraws political geography and opens up political space.
B. In psephological jargon, they call it realignment.
C. Rather, since 1989, there have been a series of semi-critical elections.
D. On a strict definition, none of the recent Indian elections qualifies as a critical election.
Sentence A starts with the main subject of critical elections. Sentence B follows A as it extends the term to critical election, that is , realignment. Sentence D offers thee Indian context of critical election. Sentence C concludes it completely.
Hence the order is ABDC.
Arrange the sentences A, B, C and D in a proper sequence so as to make a coherent paragraph.
A. Trivial pursuits marketed by the Congress, is a game imported from Italy.
B. The idea is to create an imaginary saviour in times of crisis so that the party doesn't fall flat on its collective face.
C. Closest contenders are Mani Shankar Aiyar, who still hears His Master's Voice and V. George, who is frustrated by the fact that his political future remains Sonia and yet so far.
D. The current champion is Arjun for whom all roads lead to Rome, or in this case, 10 Janpath.
Option A starts the paragraph by mentioning the trivial pursuits of Congress. Option B highlights the method of the pursuit mentioned in A by mentioning imagining savior. Option D tells the name of this savior, Arjuna. option C concludes the passage.
The correct sequence is ABDC.
Arrange the sentences A, B, C and D in a proper sequence so as to make a coherent paragraph.
A. Good advertising can make people buy your products even if it sucks.
B. A dollar spent on brainwashing is more cost-effective than a dollar spent on product improvement.
C. That's important because it takes pressure off you to make good products.
D. Obviously, there's a minimum quality that every product has to achieve: it should be able to withstand the shipping process without becoming unrecognizable.
Sentence A starts the paragraph by introducing "Good Advertising." Sentence C highlights the importance of A. Sentence B extends sentence C by highlighting the aspect of brain washing and Sentence D concludes it properly.
The correct sequence is ACBD.
Arrange the sentences A, B, C and D in a proper sequence so as to make a coherent paragraph.
A. Almost a century ago, when the father of the modern automobile industry, Henry Ford, sold the first Model T car, he decided that only the best would do for his customers.
B. Today, it is committed to delivering the finest quality with over six million vehicles a year in over 200 countries across the world.
C. And for over 90 years, this philosophy has endured in the Ford Motor Company.
D. Thus, a vehicle is ready for the customer only if it passes the Ford 'Zero Defect Programme'.
Option A starts the paragraph were the author talks about the initiation of the quality measures of ford motors. Option C follows option A. Option B refers to the modern day scenario of ford motor's quality. Option D correctly concludes the paragraph.
Arrange the sentences A, B, C and D in a proper sequence so as to make a coherent paragraph.
A. But, clearly, the government still has the final say.
B. In the past few years, the Reserve Bank of India might have wrested considerable powers from the government when it comes to monetary policy.
C. The RBI's announcements on certain issues become effective only after the government notifies them.
D. Isn't it time the government vested the RBI with powers to sanction such changes, leaving their ratification for later?
Sentence B starts the paragraph where it highlights the situation of RBI presently. Sentence A follows next. Sentence C highlights the reason for A. Sentence D concludes it in the form of a questions. The answer is BACD.
Arrange the sentences A, B, C and D in a proper sequence so as to make a coherent paragraph.
A. I sat there frowning at the checkered tablecloth, chewing the bitter cud of insight.
B. That wintry afternoon in Manhattan, waiting in the little French restaurant, I was feeling frustrated and depressed.
C. Even the prospect of seeing a dear friend failed to cheer me as it usually did.
D. Because of certain miscalculations on my part, a project of considerable importance in my life had fallen through.
Option B starts the paragraph where it mentions the situation of the author. Option D mentions its reason. Option C highlights the extent of the frustration. Option A concludes it properly.
Arrange the sentences A, B, C and D in a proper sequence so as to make a coherent paragraph.
A. Perhaps the best known is the Bay Area Writing Project, founded by James Gray in 1974.
B. The decline in writing skills can be stopped.
C.Today's back-to-basics movement has already forced some schools to place renewed emphasis on writing skills.
D. Although the inability of some teachers to teach writing successfully remains a big stumbling block, a number of programmes have been developed to attack this problem.
Option B starts the paragraph while highlighting the issue. Option C talks about the measure raised in B. Option D highlights the limitation of the issue. Option A gives the example of programmes highlighted in D.
Three of the words are related to in some way. Select the word that does not fit in the relation.
Keen, willing and enthusiastic means the same, that is eager to do something.Kin means a relative which is different in this context.
Three of the words are related to in some way. Select the word that does not fit in the relation.
The words adept, skillful and proficient are synonyms of each other. 'Adept' means being accomplished at something. On the other hand, the word 'adapt' means 'to adjust to the circumstances'. So, it is the odd one out.
Three of the words are related to in some way. Select the word that does not fit in the relation.
Ring, circle and round are synonyms. They are used to represent a circular shape. On the other hand, 'bell' is a device for making a sound. So, it is the odd one out.
Three of the words are related to in some way. Select the word that does not fit in the relation.
Grid, internet and network represent a group of computers that are connected to each other. On the other hand, computer is a single machine. So, it is the odd one out in this context.
Three of the words are related to in some way. Select the word that does not fit in the relation.
The words suffer, bear and endure are synonyms and mean 'experience or be subjected to something unpleasant'. 'Withstand', on the other hand means 'remain undamaged or offer strong resistance to'. This is the odd one out among the four words.
Three of the words are related to in some way. Select the word that does not fit in the relation.
First three options suggest a gap. Break means "separated into pieces". Chasm means "a rift in the earth." Hiatus means "a pause in the continuity". Only option d is out of context as it means a path which connects two separate places.
I think that it would be wrong to ask whether 50 years of India's Independence are an achievement or a failure. It would be better to see things as evolving. It's not an either-or question. My idea of the history of India is slightly contrary to the Indian idea.
India is a country that, in the north, outside Rajasthan, was ravaged and intellectually destroyed to a large extent by the invasions that began in about AD 1000 by forces and religions that India had no means of understanding.
The invasions are in all the schoolbooks. But I don't think that people understand that every invasion, every war, every campaign, was accompanied by slaughter, a slaughter always of the most talented people in the country. So these wars, apart from everything else led to a tremendous intellectual depletion of the country.
I think that in the British period, and in the 50 years after the British period, there has been a kind of regrouping or recovery, a very slow revival of energy and intellect. This isn't an idea that goes with the vision of the grandeur of old India and all that sort of rubbish. That idea is a great simplification and it occurs because it is intellectually, philosophically easier for Indians to manage.
What they cannot manage, and what they have not yet come to terms with, is that ravaging of all the north of India by various conquerors. That was ruined not by the act of nature, but by the hand of man. It is so painful that few Indians have begun to deal with it. It is much easier to deal with British imperialism. That is a familiar topic, in India and Britain. What is much less familiar is the ravaging of India before the British.
What happened from AD 1000 onwards, really, is such a wound that it is almost impossible to face. Certain wounds are so bad that they can't be written about. You deal with that kind of pain by hiding from it. You retreat from reality. I do not think, for example, that the Incas of Peru or the native people of Mexico have ever got over their defeat by the Spaniards. In both places the head was cut off. I think the pre-British ravaging of India was as bad as that.
In the place of knowledge of history, you have various fantasies about the village republic and the Old Glory. There is one big fantasy that Indians have always found solace in: about India having the capacity for absorbing its conquerors. This is not so. India was laid low by its conquerors.
I feel the past 150 years have been years of every kind of growth. I see the British period and what has continued after that as one period. In that time, there has been a very slow intellectual recruitment. I think every Indian should make the pilgrimage to the site of the capital of the Vijayanagar empire, just to see what the invasion of India led to. They will see a totally destroyed town. Religious wars are like that. People who see that might understand what the centuries of slaughter and plunder meant. War isn't a game. When you lost that kind of war, your town was destroyed, the people who built the towns were destroyed. You are left with a headless population.
That's where modern India starts from. The Vijayanagar capital was destroyed in 1565. It is only now that the surrounding region has begun to revive. A great chance has been given to India to start up again, and I feel it has started up again. The questions about whether 50 years of India since Independence have been a failure or an achievement are not the questions to ask. In fact, I think India is developing quite marvelously, people thought — even Mr Nehru thought — that development and new institutions in a place like Bihar, for instance, would immediately lead to beauty. But it doesn't happen like that. When a country as ravaged as India, with all its layers of cruelty, begins to extend justice to people lower down, it's a very messy business. It's not beautiful, it's extremely messy. And that's what you have now, all these small politicians with small reputations and small parties. But this is part of growth, this is part of development. You must remember that these people, and the people they represent, have never had rights before.
When the oppressed have the power to assert themselves, they will behave badly. It will need a couple of generations of security, and knowledge of institutions, and the knowledge that you can trust institutions — it will take at least a couple of generations before people in that situation begin to behave well. People in India have known only tyranny. The very idea of liberty is a new idea. The rulers were tyrants. The tyrants were foreigners. And they were proud of being foreign. There's a story that anybody could run and pull a bell and the emperor would appear at his window and give justice. This is a child's idea of history — the slave's idea of the ruler's mercy. When the people at the bottom discover that they hold justice in their own hands, the earth moves a little. You have to expect these earth movements in India. It will be like this for a hundred years. But it is the only way. It's painful and messy and primitive and petty, but it’s better that it should begin. It has to begin. If we were to rule people according to what we think fit, that takes us back to the past when people had no voices. With self-awareness all else follows. People begin to make new demands on their leaders, their fellows, on themselves.
They ask for more in everything. They have a higher idea of human possibilities. They are not content with what they did before or what their fathers did before. They want to move. That is marvellous. That is as it should be. I think that within every kind of disorder now in India there is a larger positive movement. But the future will be fairly chaotic. Politics will have to be at the level of the people now. People like Nehru were colonial — style politicians. They were to a large extent created and protected by the colonial order. They did not begin with the people. Politicians now have to begin with the people. They cannot be too far above the level of the people. They are very much part of the people. It is important that self-criticism does not stop. The mind has to work, the mind has to be active, there has to be an exercise of the mind. I think it's almost a definition of a living country that it looks at itself, analyses itself at all times. Only countries that have ceased to live can say it's all wonderful.
The central thrust of the passage is that
Option B is incorrect as 'India is going back to its past status.' is never mentioned by the author.
Option D is incorrect. It is mentioned in the passage that glorious representation of India " is a great simplification and it occurs because it is intellectually, philosophically easier for Indians to manage" and it is not the central idea of the passage too.
Option A is incorrect, as it is a false inference of the central idea of the passage. The author does not want to express the new awakening of future India.
The central idea of the passage is that we have glorified our history, while actually, it was a significant loss of intellectuals. While in the latter half, the author explained that India post-independence is still trying to understand and come to terms with itself after such a chequered past.
Option C succinctly captures this idea and is the correct answer.
The writer's attitude is
The writer is not critical or cynical about India in general. In fact, he is optimistic about India's future. The author laments its past but does not write off its future. Moreover, when the author talks about how India's politics is evolving, the author feels that there are short-term problems but a longer term positive movement is afoot. Hence, we can eliminate the negative options A and C. The author's tone is not distant or lacking in emotion. Hence, we can eliminate option D.
Throughout the passage, he gives various insights about India's past. The attitude can be said to be 'insightful'. Option b) is the correct answer.
The writer has given the example of the Vijayanagar kingdom in order to drive home the point that
Through the Vijaynagar example, the author is definitely not trying to refer to a 'historic' past. He is of the opinion that every Indian should visit the site to understand what the invasion of India has led to. In other words, he wants Indians to come to terms with its past. Option c) is the correct answer.
The writer is against
The author cites a story-'that anyone could pull a bell and the emperor would appear at his door to deliver justice' he calls this a child's view of history, which like the slave's view talks about the mercy and generosity of emperors. The author is against this, because he believes that instead, people (even at the bottom) must hold justice in their own hands and not rely on a monarch. Hence, Option A is correct.
According to the writer, India's regeneration and revival took place
Refer to the following sentences: "I think that in the British period and in the 50 years after the ...revival of energy and intellect". From this, we understand that the revival took place during and after the British period. Option c) is the correct answer.
According to the passage, self-awareness is followed by
Refer to the following sentences: "...They have a higher idea of human possibilities...", "People begin to make more demands on their leaders...more in everything". From these sentences, we can infer that self-awareness is followed by a higher idea of human possibilities and a desire for more in everything. Option d) is the correct answer.
According to the passage, India's current situation is
At several places in the paragraph, the author refers to India's current position as 'primitive' and 'messy'. Option c) is the correct answer. Both 'bleak' and 'horrific' are not applicable in this context.
For a country to be alive and progressive, it is important that
Refer to the following sentences: "They are very much part of the people. It is important that self-criticism does not stop". These indicate that for a country to be alive and progressive, self-criticism does not stop. Option a) is the correct answer.
The writer's prognosis for India's future is that
Refer to the following sentence: "...But the future will be fairly chaotic". So, the writer's prognosis for the future of India is that it will be chaotic. Option b) is the correct answer.
One of the main features of the tyranny of foreign rulers was
Refer to the following lines: "The invasions are in all the schoolbooks. But I don't think that people understand that every invasion, every war, every campaign, was accompanied by slaughter, a slaughter always of the most talented people in the country." This point is mentioned in option C.
When talks come to how India has done for itself in 50 years of independence, the world has nothing but praise for our success in remaining a democracy. On other fronts, the applause is less loud. In absolute terms, India hasn't done too badly, of course, life expectancy has increased. So has literacy. Industry, which was barely a fledging, has grown tremendously. And as far as agriculture is concerned, India has been transformed from a country perpetually on the edge of starvation into a success story held up for others to emulate.
But these are competitive times when change is rapid, and to walk slowly when the rest of the world is running is almost as bad as standing still or walking backwards. Compared with large chunks of what was then the developing world — South Korea, Singapore, Malaysia, Thailand, Indonesia, China and what was till lately a separate Hong Kong — India has fared abysmally.
It began with a far better infrastructure than most of these countries had. It suffered hardly or not at all during the World War II. It had advantages like an English speaking elite, quality scientific manpower (including a Nobel laureate and others who could be ranked among the world's best) and excellent business acumen. Yet, today, when countries are ranked according to their global competitiveness, it is tiny Singapore that figures at the top. Hong Kong is an export powerhouse. So is Taiwan. If a symbol were needed of how far we have fallen back, note that while Korean Cielos are sold in India, no one in South Korea is rushing to buy an Indian car.
The reasons list themselves. Topmost is economic isolationism. The government discouraged imports and encouraged self-sufficiency. Whatever the aim was, the result was the creation of a totally inefficient industry that failed to keep pace with global trends and, therefore, became absolutely uncompetitive. Only when the trade gates were opened a little did this become apparent. The years since then have been spent in merely trying to catch up.
That the government actually sheltered its industrialists from foreign competition is a little strange. For, in all other respects, it operated under the conviction that businessmen were little more than crooks who were to be prevented from entering the most important areas of the economy, who were to be hamstrung in as many ways as possible, who were to be tolerated in the same way as an inexcisable wart. The high, expropriatory rates of taxation, the licensing laws, the reservation of whole swathes of industry for the public sector, and the granting of monopolies to the public sector firms were the principal manifestations of this attitude. The government forgot that before wealth could be distributed, it had to be created. The government forgot that it itself could not create, but only squander wealth.
Some of the manifestations of the old attitude have changed. Tax rates have fallen. Licensing has been all but abolished. And the gates of global trade have been opened wide. But most of these changes were forced by circumstances partly by the foreign exchange bankruptcy of 1991 and the recognition that the government could no longer muster the funds to support the public sector, leave alone expand it. Whether the attitude of the government itself, or that of more than a handful of ministers, has changed, is open to question.
In many other ways, however, the government has not changed one whit. Business still has to negotiate a welter of negotiations. Transparency is still a longer way off. And there is no exit policy. In defending the existing policy, politicians betray an inability to see beyond their noses. A no-exit policy for labour is equivalent to a no-entry policy for new business. If one industry is not allowed to retrench labour, other industries will think a hundred times before employing new labour.
In other ways too, the government hurts industries. Public sector monopolies like the department of telecommunications and Videsh Sanchar Nigam Ltd. make it possible for Indian businesses to operate only at a cost several times that of their counterparts abroad. The infrastructure is in shambles partly because it is unable to formulate a sufficiently remunerative policy for private business, and partly because it does not have the stomach to change market rates for services.
After a burst of activity in the early nineties, the government is dragging its feet. At the rate it is going, it will be another 50 years before the government realises that a pro-business policy is the best pro-people policy. By then of course, the world would have moved even farther ahead.
The writer's attitude towards the government is
The author has criticized the government throughout the passage when it mentions that the government sheltered the industrialists from the foreighn competitions. The author highlights the consequence of this measure and concludes that it had an adverse consequence on Indian Economy.
The writer is surprised at the government's attitude towards its industrialists because
Refer to thee following lines:"For, in all other respects, it operated under the conviction that businessmen were little more than crooks who were to be prevented from entering the most important areas of the economy, who were to be hamstrung in as many ways as possible, who were to be tolerated in the same way as an inexcisable wart" The writer is surprised because the government shielded the industrialist from the foreign competitors while considering them to be crooks.
The government was compelled to open the economy due to
Refer to thee following line:"And the gates of global trade have been opened wide. But most of these changes were forced by circumstances partly by the foreign exchange bankruptcy of 1991 and the recognition that the government could no longer muster the funds to support the public sector, leave alone expand it." This is the same reasn which is mentioned in C.
The writer ends the passage on a note of
The writer ends the note in pessimism when he states that if wwee hadn't taken these erroneous measures, then we would have been in the much better position as compared to today.
According to the writer, India should have performed better than the other Asian nations because
Refer to the following lines:"Compared with large chunks of what was then the developing world — South Korea, Singapore, Malaysia, Thailand, Indonesia, China and what was till lately a separate Hong Kong — India has fared abysmally. It began with a far better infrastructure than most of these countries had. It suffered hardly or not at all during the World War II. It had advantages like an English speaking elite, quality scientific man." It states that India was better in infrastructure in starting but couldn' perform well.
India was in a better condition than the other Asian nations because
Refer to the following sentences: "It began with a far better infrastructure than....an English speaking elite". From this, we can understand that the India was in a better condition than the other south Asian nations because a) it did not have to face the ravages of the second world war and b) it had an English speaking populace.
Option d) is the correct answer.
The major reason for India's poor performance is
Refer to the following sentences: "The reasons list themselves. Topmost is economic isolationism". Economic isolationism led to an inefficient industry. So, the major reason is economic isolationism. Option a) is the correct answer.
One of the features of the government's protectionist policy was
Refer to the following sentences: "The government discouraged imports and encouraged self-sufficiency....absolutely uncompetitive". So, discouragement of imports was one of the features of government policy. Option d) is the correct answer.
The example of the Korean Cielo has been presented to highlight
Refer to the following lines:"So is Taiwan. If a symbol were needed of how far we have fallen back, note that while Korean Cielos are sold in India, no one in South Korea is rushing to buy an Indian car. The reasons list themselves. Topmost is economic isolationism." This point highlights India's poor performance in the international market.
According to the writer,
Refer to the following lines:"Transparency is still a longer way off. And there is no exit policy. In defending the existing policy, politicians betray an inability to see beyond their noses." It means that the Indian politicians are shallow in their vision.
When Deng Xiaoping died a few months ago, the Chinese leadership barely paused for a moment before getting on with the business of governing the country. Contrast that with the chaotic contortions on India's political stage during the past month, and it is easy to conclude that democracy and democratic freedoms are serious obstacles to economic progress.
When the Chinese leadership wants a power plant to be set up, it just goes ahead. No fears of protracted litigation, of environmental protests, or of lobbying by interested parties. It — or the economy — is not held to ransom by striking truckers or air traffic controllers. Certainly, there is much that is alluring about an enlightened dictatorship.
But there the trouble begins. First, there is no guarantee that a dictatorship will be an enlightened one. Myanmar has been ruled by a dictator for decades, and no one would claim that it is better off than even Bangladesh which has itself suffered long stretches of dictatorship. Nor can Mobuto Sese Seko, much in the news these days, be described as enlightened by any reckoning. The people of Israel, almost the only democracy in a region where dictatorships (unenlightened ones) are the norm, are much better off than their neighbours.
Second, dictatorships can easily reverse policies. China was socialist as long as Mao Zedong was around. When Deng Xiaoping took over in what was essentially a palace coup, he took the country in the opposite direction. There is little to ensure that the process will not be repeated. In India such drastic reversals are unlikely.
Six years ago Indian politicians agreed that industries should be de-licensed, that imports should be freed or that investment decisions should be based on economic considerations. Now few think otherwise. Almost all politicians are convinced of the merits of liberalisation though they may occasionally lose sight of the big picture in pandering to their constituencies. India has moved slower than China on liberalisation, but whatever moves it has made are more permanent.
Democracies are also less likely to get embroiled in destructive wars. Had Saddam Hussain been under the obligation of facing free elections every five years, he would have thought ten times before entangling his people in a long confrontation with the West. Germany, Italy and Japan were all dictatorships when they launched the World War II. The price was paid by the economies. Democracies make many small mistakes. But dictatorships are more susceptible to making huge ones and risking everything on one decision — like going to war. Democracies are the political equivalent of free markets, Companies know they can't fool the consumer too often; he will simply switch to the competition. The same goes for political parties. When they fail to live up to their promises in government, the political consumer opts for the competition.
Democratic freedoms too are important for the economy, especially now that information is supreme. Few doubt that the Internet will play an important part in the global economy in the decades to come. But China, by preventing free access to it, is already probably destroying its capabilities in this area. As service industries grow in importance, China may well be at a disadvantage though that may not be apparent today when its manufacturing juggernaut is rolling ahead.
India has stifled its entrepreneurs through its licensing policies. That was an example of how the absence of economic freedom can harm a country. But right-wing dictatorships like South Korea erred in the opposite direction. They forced their businesses to invest in industries, which they (the dictators) felt had a golden future. Now many of those firms are trying to retreat from those investments. Statism is bad, no matter what the direction in which it applies pressure. At this moment, China and other dictatorships may be making foolish investment decisions. But as industries are subsidized and contrary voices not heard, the errors will not be realised until the investments assume gargantuan proportions.
India's hesitant ways may seem inferior to China's confident moves. But at least we know what the costs are. That is not the case with China. It was only years after the Great Leap Forward and only such experiments that the cost in human lives (millions of them) became evident to the world. What the cost of China's present experiments is we may not know for several years more. A nine per cent rate of growth repeated year after year may seem compelling. But a seven per cent rate of growth that will not falter is more desirable. India seems to be on such a growth curve, whatever the shenanigans of our politicians.
According to the passage,
Throughout the passage, the author is of the opinion that though the moves of China have been more confident than the nimble steps of India, it is better to go India's way rather than the way of China's dictatorship. Options a) and c) are incorrect. Also, there is nothing in the passage to suggest that India has failed as a democracy. Option d) is the correct answer.
The passage says that
Refer to the following lines:"But there the trouble begins. First, there is no guarantee that a dictatorship will be an enlightened one." This is highlighted in option B.
It can be implied from the passage that
Refer to the last few sentences of the passage. The author is of the opinion that it is better to have a slow and stable rate of growth than a high and unstable rate of growth. This is best captured in option c). Option c) is the correct answer.
Vis-a-vis democracies, dictatorships run the risk of
Refer to the following sentences: "Democracies make many small mistakes. But dictatorships are more susceptible to making huge ones and risking everything on one decision". Option c) brings out this idea clearly.
The writer's conclusion in the passage is that
Option a) is incorrect. The author feels that it is better to have a democracy that is faulty than to have a dictatorship that is benign. Statements in options c) and d), though correct, are not the conclusions that the author is drawing from the passage. Option b) is the correct answer. The conclusion that the author is drawing is that statism should not replace the voice of the people under any circumstances.
Democracy has been compared to the free market, as
Refer to the following sentences: "Democracies are like political equivalents of free markets....The same goes for political parties...competition". From these sentences, we can infer that options a), b) and c) are all correct. So, option d) all of the above is the correct answer.
It can be inferred from the passage that
Refer to the following sentence: "Few doubt that the Internet will play an important role in the global economy in the decades to come". Option c) is correct. However, there is nothing in the passage from which we can infer that India stands to gain from its Internet policy. We can rule out options b) and d). Option c) is the correct answer.
According to the passage, a democratic set up works as a check on the
The authors mentions that in a democratic country like India the actions and the decisions of the leaders are scrutinized while Chinese leadership can go ahead with any decision without opposition. He further states that the growth of a democratic economy may be slower because the process of decision making will take in account the contrary views too. Hence C is the answer.
India's moves on liberalisation are more permanent than China's because
Refer to the given lines in the passage:"Almost all politicians are convinced of the merits of liberalization though they may occasionally lose sight of the big picture in pandering to their constituencies. India has moved slower than China on liberalization, but whatever moves it has made are more permanent. Democracies are also less likely to get embroiled in destructive wars." The author wants to highlight that the liberalization measures can be embroiled in difficulties if there is a dictatorship in a country.
According to the passage,
Option A is incorrect as the author mentions Israel to be the only democratic nation where dictatorship is the norm.
Option B is incorrect as the author compares Myanmar with Bangladesh and not with Israel.
Option C is incorrect as the author says that policies can be reversed in a dictatorship and highlights Israel to be a dictatorship.
Of each of the great leaders, it is said by his followers, long after he is gone, he made us do it. If leadership is the art of persuading your people to follow your bidding, without their realising your involvement, the archetype of its practice is N. R. Narayana Murthy, the chairman and managing director of the Rs. 143.81 crore Infosys Technologies (Infosys). For, the 52-year-old CEO of the globalised software corporation — which he founded with six friends, and a combined capital of Rs. 10,000 in 1981 and which now occupies the front ranks of the country's most admired corporations, leads with the subtlest of weapons: personal example.
Infosys ranks only 578th among the country's listed companies, and sixth in the software sector, in terms of its turnover. But it is setting new standards for India Inc. through its practices of inter alia awarding stock options to its employees, putting the value of its intellectual assets and its brands on its balancesheet, and conforming to the disclosure standards of the Securities and Exchange Commission (SEC:of the US. Behind all this is the stubborn personal subscription of its CEO to the underlying causes of wealthcreation- people-power and transparency. "What were choices earlier are compulsions now," asserts Murthy.
In fact, the mirror images of Murthy, the Man, can be found all over Infosys, his company. His egalitarianism — which finds expression in such habits as using the same table and chair as anyone else in the organization — is practised firmly when it comes to charting a course for the company's future: everyone has a voice. "We have no hierarchy just for the sake of control.
" Brimming with the conviction that customer satisfaction is the key to success, Murthy has built a fleetfooted human resource management system that treats employees as customers, using the resources of the organisation to meet their professional and personal needs. His instruments are not just top-of-themarket salaries, but also operational empowerment as well as every facility that an employee needs to focus on the job.
Just what methods does Murthy use to ensure that his DNA is replicated in his company? Not for him are the classical leadership genre — transactional or transformational, situational or visionary. His chosen style, instead, is to lead by example, ensuring that the CEO's actions set the template for all Infoscions.
Murthy believes that the betterment of man can be brought about through the ‘creation of wealth, legally and ethically’. The personal example that he has set enabled his company to mirror those beliefs, tying his own rewards, and measuring his value to the company, to his ability to create wealth, and erecting systems for the company's wealth to be shared by its people. Sums up Nandan Nilekani, 41, deputy managing director, Infosys: "This is the future model of the corporation. Run an excellent company, and let the market increase its value to create wealth." Although Murthy is one of the prime beneficiaries of the philosophy — his 10 per cent stake in Infosys is worth Rs. 130 crore today — in his book, the leader leads not by grabbing the booty but by teaching others to take what they deserve. That's why, on the Infosys' balancesheet, the value of Murthy's intellectual capital is nowhere near the top, on the rationale, that the CEO, at 52, is worth far less to his company than, say, a bright young programmer of 26. To spread the company's wealth, Murthy has instituted stock options — the first to do so in the country — for employees, creating 300 millionaires already. By 2000, he wants the number to climb to 1000.
To act as a beacon for his version of the learning organisation, Murthy not only spends an hour a day surfing the Internet to learn about new technological developments in his field, he also makes as many luncheon appointments as he can with technical people and academicians — dons from the Indian Institutes of Technology for instance — systematically plumbing their depths for an understanding of new developments in infotech. Murthy's objective is not just to stay abreast of the state-of-the-art, but also to find a way to use that knowledge for the company.
Following Murthy's example, Infosys has set up a technology advancement unit, whose mandate is to track, evaluate, and assimilate new techniques and methodologies. In fact, Murthy views learning not just as amassing data, but as a process that enables him to use the lessons from failure to achieve success. This self-corrective loop is what he demonstrates through his leadership during a crisis.
In 1995, for example, Infosys lost a Rs. 15 crore account — then 20 per cent of its revenues — when the $69 billion GE yanked its business from it. Instead of recriminations, Murthy activated Infosys' machinery to understand why the business was taken away and to leverage the learning for getting new clients instead. Feeling determined instead of guilty, his employees went on to sign up high profile customers like the $20 billion Xerox, the $7 billion Levi Strauss, and the $14 billion Nynex.
"You must have a multi-dimensional view of paradigms," says the multi-tasking leader. The objective is obvious: ensure that Infosys' perspective on its business and the world comes from as many vantage points as possible so that corporate strategy can be synthesised not from a narrow vision, but from a wide angle lens. In fact, Murthy still regrets that, in its initial years, Infosys didn't distil a multi-pronged understanding of the environment into its strategies, which forced it onto an incremental path that led revenues to snake up from Rs. 0.02 crore to just Rs. 5 crore in the first 10 years.
It was after looking around itself instead of focusing on its initial business of banking software, that Infosys managed to accelerate. Today the company operates with stretch targets setting distant goals and working backwards to get to them. The crucial pillar on which Murthy bases his ethical leadership is openness. Transparency, he reckons, is the clearest signal that one has nothing to hide. The personal manifestations of that are inter alia the practice of always giving complete information whenever any employee, customer, or investor asks for it: the loudly proclaimed insistence that every Infoscion pay taxes and file returns: and a perpetually open office into which anyone can walk.
But even as he tries to lead Infosys into cloning his own approach to enterprise, is Murthy choosing the best future for it? If Infosys grows with the same lack of ambition, the same softness of style, and the same absence of aggression, is it not cutting off avenues of growth that others may seize? As Infosys approaches the 21st century it is obvious that Murthy's leadership will have to set ever-improving role models for his ever-learning company. After all, men grow old; companies shouldn't.
One of the ways in which Infosys spreads the company's wealth among its employees is
Option A can be inferred from the following lines:"But it is setting new standards for India Inc. through its practices of inter alia awarding stock options to its employees, putting the value of its intellectual assets and its brands on its balance sheet, and conforming to the disclosure standards of the Securities and Exchange Commission (SEC:of the US)."
According to the passage, at Infosys
Option B can be confirmed from the following lines:"His egalitarianism — which finds expression in such habits as using the same table and chair as anyone else in the organization — is practised firmly when it comes to charting a course for the company's future: everyone has a voice. "We have no hierarchy just for the sake of control."
Murthy believes in
The answer to this question can be inferred from the given lines:" Murthy believes that the betterment of man can be brought about through the ‘creation of wealth, legally and ethically’"
The example of the Rs. 15 crore account highlights
In this passage, the example of 15 crore highlights that Murthy analysed the reason behind the crisis and removed the weakness to win more clients. This incident highlights all the characteristics of Murthy as mentioned in the passage.
According to Murthy, learning is
Refer to the following lines:"In fact, Murthy views learning not just as amassing data, but as a process that enables him to use the lessons from failure to achieve success." This implies that Murthy considers learning as an enabler of success.
According to the passage,
Refer to the following lines:"It was after looking around itself instead of focusing on its initial business of banking software, that Infosys managed to accelerate. Today the company operates with stretch targets setting distant goals and working backwards to get to them." Option D can be concluded from these lines.
Openness at Infosys includes
Refer to the following lines:"The crucial pillar on which Murthy bases his ethical leadership is openness. Transparency, he reckons, is the clearest signal that one has nothing to hide. The personal manifestations of that are inter alia the practice of always giving complete information whenever any employee, customer, or investor asks for it: the loudly proclaimed insistence that every Infoscion pay taxes and file returns: and a perpetually open office into which anyone can walk. " In these lines, the author wants to state the openness of information in infosys and paying of taxes completely without hiding anything.
It is evident from the passage that
"Men grow old but companies shouldn't" means the companies should devising new strategies to keep themselves young. Option A correctly summarizes the answer.
The cornerstone of Murthy's human resource management system is
Consider the following sentence: "Brimming with the conviction that customer satisfaction is the key....to meet their professional and personal needs". So, the cornerstone of Murthy's human resource management is the satisfaction of their personal needs. Option d) is the correct answer.
According to the passage,
Refer to the following sentence: "In fact, mirror images of Murthy, the Man, can be found all over Infosys". So, we can say that according to the passage, Infosys is a reflection of its CEO, Narayana Murthy. Option a) is the correct answer.
Last fortnight, news of a significant development was tucked away in the inside pages of newspapers. The government finally tabled a bill in Parliament seeking to make primary education a fundamental right. A fortnight earlier, a Delhi-based newspaper had carried a report about a three-month interruption in the Delhi Government's ‘Education for All’ programme. The report made for distressing reading. It said that literacy centres across the city were closed down, volunteers beaten up and enrolment registers burnt. All because the state government had, earlier this year, made participation in the programme mandatory for teachers in government schools. The routine denials were issued and there probably was a wee bit of exaggeration in the report.
But it still is a pointer to the enormity of the task at hand. That economic development will be inherently unstable unless it is built on a solid base of education, specially primary education, has been said so often that it is in danger of becoming a platitude. Nor does India's abysmal record in the field need much reiteration. Nearly 30 million children in the six to ten age group do not go to school — reason enough to make primary education not only compulsory but a fundamental right. But is that the Explanation? More importantly, will it work? Or will it remain a mere token, like the laws providing for compulsory primary education? It is now widely known that 14 states and four Union Territories have this law on their statute books.
Believe it or not, the list actually includes Bihar, Madhya Pradesh (MP) and Rajasthan, where literacy and education levels are miles below the national average. A number of states have not even notified the compulsory education law. This is not to belittle the decision to make education a fundamental right. As a statement of political will, a commitment by the decision-makers, its importance cannot be undervalued. Once this commitment is clear, a lot of other things like resource allocation will naturally fall into place. But the task of universalizing elementary education (UEE) is complicated by various socio-economic and cultural factors which vary from region to region and within regions. If India's record continues to appall, it is because these intricacies have not been adequately understood by the planners and administrators.
The trouble has been that education policy has been designed by grizzled mandarins ensconced in Delhi and is totally out of touch with the ground reality. The key then is to decentralise education planning and implementation. What's also needed is greater community involvement in the whole process. Only then can school timings be adjusted for convenience, school children given a curriculum they can relate to and teachers made accountable. For proof, one has only to look at the success of the district primary education programme, which was launched in 1994. It has met with a fair degree of success in the 122 districts it covers. Here the village community is involved in all aspects of education — allocating finances to supervising teachers to fixing school timings and developing curriculum and textbooks — through district planning teams. Teachers are also involved in the planning and implementation process and are given small grants to develop teaching and learning material, vastly improving motivational levels. The consequent improvement in the quality of education generates increased demand for education.
But for this demand to be generated, quality will first have to be improved. In MP, the village panchayats are responsible for not only constructing and maintaining primary schools but also managing scholarships, besides organising non-formal education. How well this works in practice remains to be seen (though the department claims the schemes are working very well) but the decision to empower panchayats with such powers is itself a significant development. Unfortunately, the Panchayat Raj Act has not been notified in many states.
After all, delegating powers to the panchayats is not looked upon too kindly by vested interests. More specifically, by politicians, since decentralisation of education administration takes away from them the power of transfer, which they use to grant favours and build up a support base. But if the political leadership can push through the bill to make education a fundamental right, it should also be able to persuade the states to implement the laws on Panchayat Raj. For, UEE cannot be achieved without decentralisation. Of course, this will have to be accompanied by proper supervision and adequate training of those involved in the administration of education. But the devolution of powers to the local bodies has to come first.
One of the problems plaguing the education system in India is
Consider the following sentence: "But the task of universalizing elementary education (UEE) is complicated by various socio-economic and cultural factors...within regions". So, diverse cultural and socio-economic factors is one of the problems plaguing Indian education system. Option b) is the correct answer.
In the context of the passage, the term 'grizzled mandarins' means
The term "grizzled" refers to the grey or white hair indicating older people. "mandarin" is a word used to indicate bureaucrats - China was one of the earliest countries to have a civil service and thus members of the Indian Civil Service are sometimes referred to as mandarins. Hence, the phrase refers to old bureaucrats. Option d) is the correct answer.
One of the reasons contributing to India's poor performance on the education front is that
Refer to the following lines:"The trouble has been that education policy has been designed by grizzled mandarins ensconced in Delhi and is totally out of touch with the ground reality." Here the author states that the people who make education policies are not in touch with reality.
The only way in which the education system can be improved is by
The answer to this question can be concluded directly if we refer to these lines:"The trouble has been that education policy has been designed by grizzled mandarins ensconced in Delhi and is totally out of touch with the ground reality. The key then is to decentralise education planning and implementation. What's also needed is greater community involvement in the whole process. " Here the author states that the key to solve the problems is to decentralize education,
Very low education levels are visible in
Refer to the following sentence: "Believe it or not, this list actually includes Bihar, Madhya Pradesh (MP) and Rajasthan". So, very low education levels are visible in these three states. Option c) is the correct answer.
The district primary education programme
"One has only to look at the success of the district primary education programme, which was launched in 1994. It has met with a fair degree of success in the 122 districts it covers."
From these lines, we can say that the programme was launched in 1994 and it was successful in 122 districts.
The village panchayats in Madhya Pradesh are responsible for
"In MP, the village panchayats are responsible for not only constructing and maintaining primary schools but also managing scholarships, besides organising non-formal education."
Through the above information, we can say that both B and C are true.
The successful implementation of education policies is obstructed by
"Unfortunately, the Panchayat Raj Act has not been notified in many states. After all, delegating powers to the panchayats is not looked upon too kindly by vested interests. More specifically, by politicians, since decentralisation of education administration takes away from them the power of transfer, which they use to grant favours and build up a support base."
Through these sentences, we can infer that politicians obstruct successful implementation of educational policies.
Primary education
Primary education is not a fundamental right yet. A bill was tabled seeking to make primary education a fundamenta right.
It is not mentioned in the passage that primary education is only for privileged sections of the society.
Hence, none of the options are true.
One of the ways in which education policy can be successfully implemented as mentioned in the passage, is
Refer to the following lines:"The key then is to decentralise education planning and implementation. What's also needed is greater community involvement in the whole process." This is highlighted in option A.

Educational materials for CAT preparation
