Sign in
Please select an account to continue using cracku.in
↓ →
The first table gives the number of saris (of all the eight colours) stocked in six regional showrooms. The second gives the number of saris (of all the eight colours) sold in these six regional showrooms. The third table gives the percentage of saris sold to saris stocked for each colour in each region. The fourth table gives the percentage of saris of a specific colour sold within that region. The fifth table gives the percentage of saris of a specific colour sold across all the regions. Study the tables and for each of the following questions, choose the best alternative.
Table 1
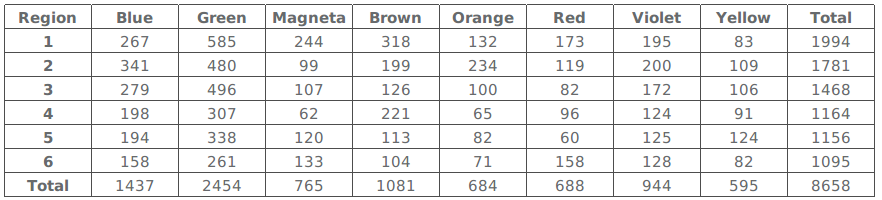
Table 2
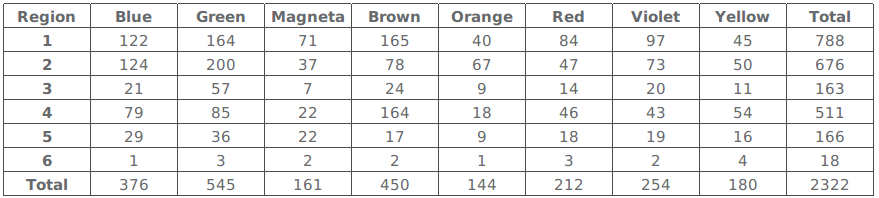
Table 3
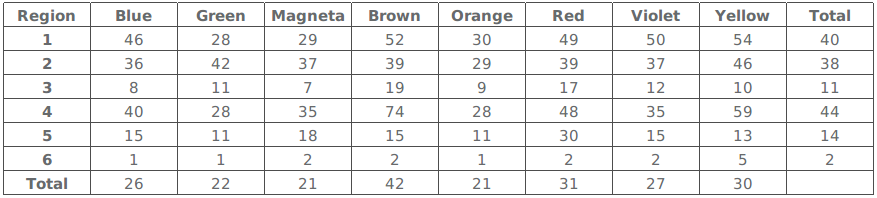
Table 4
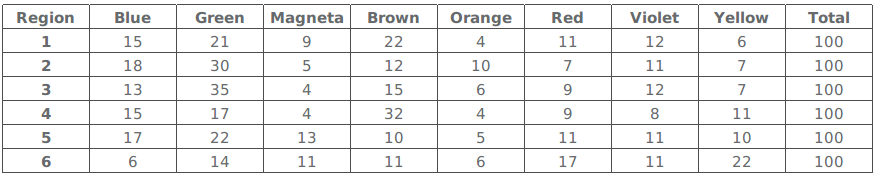
Table 5
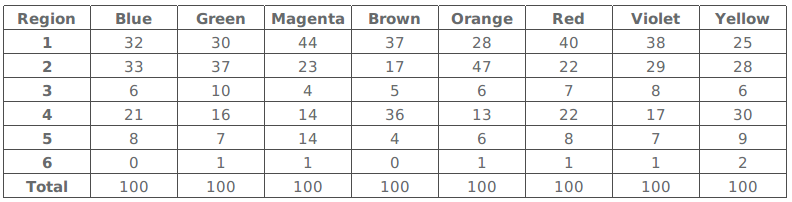
As the most popular colours will have more sale than any other colour
Since table 2 gives us value of sales, Brown colour in region 1 has maximum no. of sales
Hence, our answer will be Brown.
Create a FREE account and get:
Book Free CAT Mentorship
Get personalized CAT strategy from a 99%iler
500+ students mentored
OTP Verification
Enter the 6-digit code sent to your phone
Booking Summary
Enter OTP
Didn't receive the OTP?

Educational materials for CAT preparation

Ask our AI anything

AI can make mistakes. Please verify important information.
AI can make mistakes. Please verify important information.