Which of the following statements is correct?
Sign in
Please select an account to continue using cracku.in
↓ →
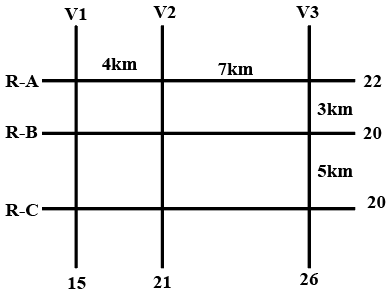
The figure below shows a network with three parallel roads represented by horizontal lines R-A, R-B, and R-C and another three parallel roads represented by vertical lines V1, V2, and V3. The figure also shows the distance (in km) between two adjacent intersections.Six ATMs are placed at six of the nine road intersections. Each ATM has a distinct integer cash requirement (in Rs. Lakhs), and the numbers at the end of each line in the figure indicate the total cash requirements of all ATMs placed on the corresponding road. For example, the total cash requirement of the ATM(s) placed on road R-A is Rs. 22 Lakhs.
The following additional information is known.
1. The ATMs with the minimum and maximum cash requirements of Rs. 7 Lakhs and Rs. 15 Lakhs are placed on the same road.
2. The road distance between the ATM with the second highest cash requirement and the ATM located at the intersection of R-C and V3 is 12 km.
Which of the following statements is correct?
This is the figure that has been given to us,
We are given the information that, out of the 9 intersections in the figure, 6 of them have ATMs. That means, 3 of these intersections are empty.
We are also told that, the ATMs with the highest and lowest capacity are on the same road, highest capacity being 15L and lowest being 7L.
This information not only gives us clues about the location of these two ATMs but also, now we know the upper and lower bounds for cash in the six ATMs with distinct cash.
Next piece of information that is given is that, road distance between the ATM with the second highest cashrequirement and the ATM located at the intersection of R-C and V3 is12 km. Since we can only traverse on the roads, from (RC, V3) we have to either traverse the 5km road or the 7km road. The only way it can add up to 12 is 5+7. That means, ATM with the second highest capacity is at (RB, V2).
Now, let us start arranging the ATM's.
We are told that 15 and 7 are on the same road. Since we are given the total capacities on the roads, we need to identify the roads with capacity higher or equal to 22.
There are only two possible choice, either RA or V3.
Looking at V3, we see that 15L ATM cannot come at (RB, V3) or (RC, V3) since the RB and RC capacity is 20, and the minimum ATM limit is 7L, if a 15L ATM is on a road with total capacity 20L, this is a situation that is not possible since there cannot be an ATM with 5L capacity.
The same is the case with the intersection (RA, V2). So, we can narrow down the fact that the 15L ATM has to either be at (RA, V1) or (RA, V3)
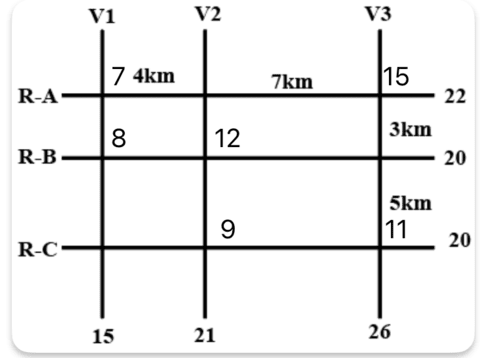
Case 1: 15L ATM is on the intersection (RA, V3)
.png)
We see that, for V3 to add upto 26, there has to be an ATM with cash of 11L, there cannot be two ATM's since the minimum capacity is 7L.
We can place the 11L ATM at (RB, V3) or (RC, V3), if we place them at either of these intersections, the remaining ATM has to have a capacity of 9L for the same reason. 9L cannot be at (RC, V1) or (RB, V1) since the total capacity of V1 is 15L and there cannot be an ATM with 6L. And it also cannot be at (RB, V2) since there is already an ATM with 11L that means the ATM with the second highest capacity cannot be 9. So that means 9L has to be at (RC, V2). And then filling in the rest of the numbers we get the final arrangement for Case-1.
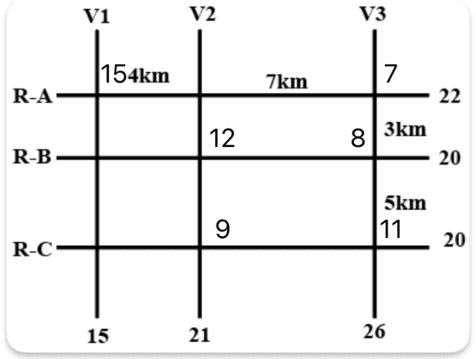
Case 2: When 15L is at (RA, V1)
There can be no other ATM on V1 in this scenario, 7L ATM which is on RA cannot be on (RA, V2) considering the sum of the numbers on V2 is 21, and there cannot be 7+7 or a 14L ATM since the capacity of both RB and RC is 20. So, 7L has to be on V3, and since there cannot be a single ATM of 19L on V3, there has to be two other ATMs on V3 adding up to 19. Rearranging the numbers, we get the scenario for the second case.
Using the two cases, we can answer the given questions.
The only statement that is correct considering both the cases is Option B
"The ATM placed at the (R-C, V2) intersection has a cash requirement of Rs. 9 Lakhs."
How many ATMs have cash requirements of Rs. 10 Lakhs or more?
This is the figure that has been given to us,
We are given the information that, out of the 9 intersections in the figure, 6 of them have ATMs. That means, 3 of these intersections are empty.
We are also told that, the ATMs with the highest and lowest capacity are on the same road, highest capacity being 15L and lowest being 7L.
This information not only gives us clues about the location of these two ATMs but also, now we know the upper and lower bounds for cash in the six ATMs with distinct cash.
Next piece of information that is given is that, road distance between the ATM with the second highest cashrequirement and the ATM located at the intersection of R-C and V3 is12 km. Since we can only traverse on the roads, from (RC, V3) we have to either traverse the 5km road or the 7km road. The only way it can add up to 12 is 5+7. That means, ATM with the second highest capacity is at (RB, V2).
Now, let us start arranging the ATM's.
We are told that 15 and 7 are on the same road. Since we are given the total capacities on the roads, we need to identify the roads with capacity higher or equal to 22.
There are only two possible choice, either RA or V3.
Looking at V3, we see that 15L ATM cannot come at (RB, V3) or (RC, V3) since the RB and RC capacity is 20, and the minimum ATM limit is 7L, if a 15L ATM is on a road with total capacity 20L, this is a situation that is not possible since there cannot be an ATM with 5L capacity.
The same is the case with the intersection (RA, V2). So, we can narrow down the fact that the 15L ATM has to either be at (RA, V1) or (RA, V3)
Case 1: 15L ATM is on the intersection (RA, V3)
We see that, for V3 to add upto 26, there has to be an ATM with cash of 11L, there cannot be two ATM's since the minimum capacity is 7L.
We can place the 11L ATM at (RB, V3) or (RC, V3), if we place them at either of these intersections, the remaining ATM has to have a capacity of 9L for the same reason. 9L cannot be at (RC, V1) or (RB, V1) since the total capacity of V1 is 15L and there cannot be an ATM with 6L. And it also cannot be at (RB, V2) since there is already an ATM with 11L that means the ATM with the second highest capacity cannot be 9. So that means 9L has to be at (RC, V2). And then filling in the rest of the numbers we get the final arrangement for Case-1.
Case 2: When 15L is at (RA, V1)
There can be no other ATM on V1 in this scenario, 7L ATM which is on RA cannot be on (RA, V2) considering the sum of the numbers on V2 is 21, and there cannot be 7+7 or a 14L ATM since the capacity of both RB and RC is 20. So, 7L has to be on V3, and since there cannot be a single ATM of 19L on V3, there has to be two other ATMs on V3 adding up to 19. Rearranging the numbers, we get the scenario for the second case.
Using the two cases, we can answer the given questions.
Three ATM's with 10L or more: 15L, 12L and 11L. Answer is 3.
Which of the following two statements is/are DEFINITELY true?
Statement A: Each of R-A, R-B, and R-C has two ATMs.
Statement B: Each of V1, V2, and V3 has two ATMs.
This is the figure that has been given to us,
We are given the information that, out of the 9 intersections in the figure, 6 of them have ATMs. That means, 3 of these intersections are empty.
We are also told that, the ATMs with the highest and lowest capacity are on the same road, highest capacity being 15L and lowest being 7L.
This information not only gives us clues about the location of these two ATMs but also, now we know the upper and lower bounds for cash in the six ATMs with distinct cash.
Next piece of information that is given is that, road distance between the ATM with the second highest cashrequirement and the ATM located at the intersection of R-C and V3 is12 km. Since we can only traverse on the roads, from (RC, V3) we have to either traverse the 5km road or the 7km road. The only way it can add up to 12 is 5+7. That means, ATM with the second highest capacity is at (RB, V2).
Now, let us start arranging the ATM's.
We are told that 15 and 7 are on the same road. Since we are given the total capacities on the roads, we need to identify the roads with capacity higher or equal to 22.
There are only two possible choice, either RA or V3.
Looking at V3, we see that 15L ATM cannot come at (RB, V3) or (RC, V3) since the RB and RC capacity is 20, and the minimum ATM limit is 7L, if a 15L ATM is on a road with total capacity 20L, this is a situation that is not possible since there cannot be an ATM with 5L capacity.
The same is the case with the intersection (RA, V2). So, we can narrow down the fact that the 15L ATM has to either be at (RA, V1) or (RA, V3)
Case 1: 15L ATM is on the intersection (RA, V3)
We see that, for V3 to add upto 26, there has to be an ATM with cash of 11L, there cannot be two ATM's since the minimum capacity is 7L.
We can place the 11L ATM at (RB, V3) or (RC, V3), if we place them at either of these intersections, the remaining ATM has to have a capacity of 9L for the same reason. 9L cannot be at (RC, V1) or (RB, V1) since the total capacity of V1 is 15L and there cannot be an ATM with 6L. And it also cannot be at (RB, V2) since there is already an ATM with 11L that means the ATM with the second highest capacity cannot be 9. So that means 9L has to be at (RC, V2). And then filling in the rest of the numbers we get the final arrangement for Case-1.
Case 2: When 15L is at (RA, V1)
There can be no other ATM on V1 in this scenario, 7L ATM which is on RA cannot be on (RA, V2) considering the sum of the numbers on V2 is 21, and there cannot be 7+7 or a 14L ATM since the capacity of both RB and RC is 20. So, 7L has to be on V3, and since there cannot be a single ATM of 19L on V3, there has to be two other ATMs on V3 adding up to 19. Rearranging the numbers, we get the scenario for the second case.
Using the two cases, we can answer the given questions.
We see that in both cases, RA RB and RC have two ATMs
Only in the first case V1 V2 and V3 have two ATM's, in the second case V3 has 3 ATMs and V1 has 1.
Hence only Statement A is correct.
What best can be said about the road distance (in km) between the ATMs having the second highest and the second lowest cash requirements?
This is the figure that has been given to us,
We are given the information that, out of the 9 intersections in the figure, 6 of them have ATMs. That means, 3 of these intersections are empty.
We are also told that, the ATMs with the highest and lowest capacity are on the same road, highest capacity being 15L and lowest being 7L.
This information not only gives us clues about the location of these two ATMs but also, now we know the upper and lower bounds for cash in the six ATMs with distinct cash.
Next piece of information that is given is that, road distance between the ATM with the second highest cashrequirement and the ATM located at the intersection of R-C and V3 is12 km. Since we can only traverse on the roads, from (RC, V3) we have to either traverse the 5km road or the 7km road. The only way it can add up to 12 is 5+7. That means, ATM with the second highest capacity is at (RB, V2).
Now, let us start arranging the ATM's.
We are told that 15 and 7 are on the same road. Since we are given the total capacities on the roads, we need to identify the roads with capacity higher or equal to 22.
There are only two possible choice, either RA or V3.
Looking at V3, we see that 15L ATM cannot come at (RB, V3) or (RC, V3) since the RB and RC capacity is 20, and the minimum ATM limit is 7L, if a 15L ATM is on a road with total capacity 20L, this is a situation that is not possible since there cannot be an ATM with 5L capacity.
The same is the case with the intersection (RA, V2). So, we can narrow down the fact that the 15L ATM has to either be at (RA, V1) or (RA, V3)
Case 1: 15L ATM is on the intersection (RA, V3)
We see that, for V3 to add upto 26, there has to be an ATM with cash of 11L, there cannot be two ATM's since the minimum capacity is 7L.
We can place the 11L ATM at (RB, V3) or (RC, V3), if we place them at either of these intersections, the remaining ATM has to have a capacity of 9L for the same reason. 9L cannot be at (RC, V1) or (RB, V1) since the total capacity of V1 is 15L and there cannot be an ATM with 6L. And it also cannot be at (RB, V2) since there is already an ATM with 11L that means the ATM with the second highest capacity cannot be 9. So that means 9L has to be at (RC, V2). And then filling in the rest of the numbers we get the final arrangement for Case-1.
Case 2: When 15L is at (RA, V1)
There can be no other ATM on V1 in this scenario, 7L ATM which is on RA cannot be on (RA, V2) considering the sum of the numbers on V2 is 21, and there cannot be 7+7 or a 14L ATM since the capacity of both RB and RC is 20. So, 7L has to be on V3, and since there cannot be a single ATM of 19L on V3, there has to be two other ATMs on V3 adding up to 19. Rearranging the numbers, we get the scenario for the second case.
Using the two cases, we can answer the given questions.
Second highest is 12L and second lowest is 8L
In Case 1 the distance between 12L and 8L ATM is 4km and in Case 2 the distance between 12L and 8L ATM is 7km.
Hence the answer is either 4km or 7km.
What is the number of ATMs whose locations and cash requirements can both be uniquely determined?
This is the figure that has been given to us,
We are given the information that, out of the 9 intersections in the figure, 6 of them have ATMs. That means, 3 of these intersections are empty.
We are also told that, the ATMs with the highest and lowest capacity are on the same road, highest capacity being 15L and lowest being 7L.
This information not only gives us clues about the location of these two ATMs but also, now we know the upper and lower bounds for cash in the six ATMs with distinct cash.
Next piece of information that is given is that, road distance between the ATM with the second highest cashrequirement and the ATM located at the intersection of R-C and V3 is12 km. Since we can only traverse on the roads, from (RC, V3) we have to either traverse the 5km road or the 7km road. The only way it can add up to 12 is 5+7. That means, ATM with the second highest capacity is at (RB, V2).
Now, let us start arranging the ATM's.
We are told that 15 and 7 are on the same road. Since we are given the total capacities on the roads, we need to identify the roads with capacity higher or equal to 22.
There are only two possible choice, either RA or V3.
Looking at V3, we see that 15L ATM cannot come at (RB, V3) or (RC, V3) since the RB and RC capacity is 20, and the minimum ATM limit is 7L, if a 15L ATM is on a road with total capacity 20L, this is a situation that is not possible since there cannot be an ATM with 5L capacity.
The same is the case with the intersection (RA, V2). So, we can narrow down the fact that the 15L ATM has to either be at (RA, V1) or (RA, V3)
Case 1: 15L ATM is on the intersection (RA, V3)
We see that, for V3 to add upto 26, there has to be an ATM with cash of 11L, there cannot be two ATM's since the minimum capacity is 7L.
We can place the 11L ATM at (RB, V3) or (RC, V3), if we place them at either of these intersections, the remaining ATM has to have a capacity of 9L for the same reason. 9L cannot be at (RC, V1) or (RB, V1) since the total capacity of V1 is 15L and there cannot be an ATM with 6L. And it also cannot be at (RB, V2) since there is already an ATM with 11L that means the ATM with the second highest capacity cannot be 9. So that means 9L has to be at (RC, V2). And then filling in the rest of the numbers we get the final arrangement for Case-1.
Case 2: When 15L is at (RA, V1)
There can be no other ATM on V1 in this scenario, 7L ATM which is on RA cannot be on (RA, V2) considering the sum of the numbers on V2 is 21, and there cannot be 7+7 or a 14L ATM since the capacity of both RB and RC is 20. So, 7L has to be on V3, and since there cannot be a single ATM of 19L on V3, there has to be two other ATMs on V3 adding up to 19. Rearranging the numbers, we get the scenario for the second case.
Using the two cases, we can answer the given questions.
ATMs that can be uniquely determines are the ATMs with cash 9L, 11L and 12L. Hence the answer is 3.
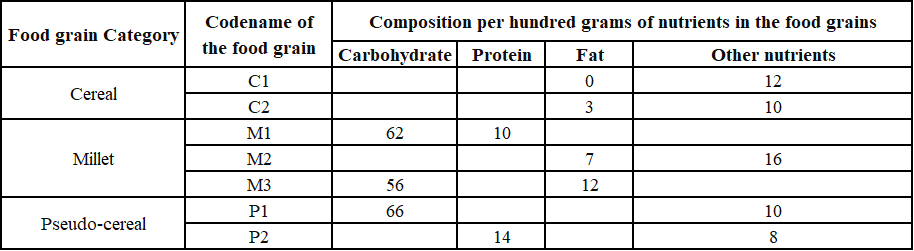
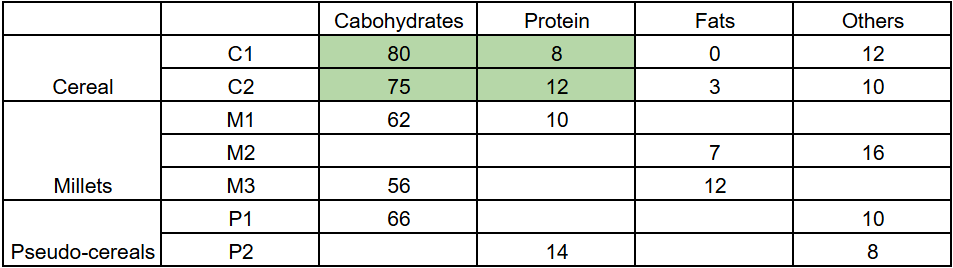
The table given below shows the amount, in grams, of carbohydrate, protein, fat and all other nutrients, per 100 grams of nutrients in seven food grains. The first column shows the food grain category and the second column its codename. The table has some missing values.
The following additional facts are known.
1. Both the pseudo-cereals had higher amounts of carbohydrate as well as higher amounts of protein than any millet.
2. Both the cereals had higher amounts of carbohydrate than any pseudo-cereal.
3. All the missing values of carbohydrate amounts (in grams) for all the food grains are non-zero multiples of 5.
4. All the missing values of protein, fat and other nutrients amounts (in grams) for all the food grains are non-zero multiples of 4.
5. P1 contained double the amount of protein that M3 contains.
How many foodgrains had a higher amount of carbohydrate per 100 grams ofnutrients than M1?
The set's starting point is that the sum of each row must be 100
Clue 3 tells us that all the missing elements in the Carbs column are multiple of 5. Similarly, clue 4 tells us that the missing elements of the other three columns are multiples of 4.
Note that we look at clue 1, which says that the carbs in C1 and C2 must be more than any carbs in any pseudo cereal.
We have the reference point of P1 at 66
Trying to fill in for C1:
The possible values are 75, 80, 85, 90, 95
Since 12 grams is of other nutrients, we can eliminate 90 and 95.
If we take 85, 85+12 = 97, which would leave 3 grams of protein, but from clue 4, we know this has to be a multiple of 4.
Taking 75, 75+12 = 87 would leave 13 grams of protein, which, too, is eliminated.
Leaving only 80 grams of carb in C1 and 8 grams of protein.
Similar logic is to be applied for C2; we have 13 grams already present, so the values of 90 and 95 are eliminated.
Taking 85 carbs would give 2 grams of protein, which can be eliminated.
80 and 70 would also not work for the same reason.
Leavin has only 75 grams of carbs, leaving 12 grams of protein.
Using clues 1 and 2 together, we can determine that the carbs in P2 must be less than 75 but at least greater than 62.
The only possible values are 65 and 70
Putting 65 grams of carbs in P2 gives us 100-65-14-8 = 13 grams of protein, which is invalid.
Putting 70 grams of carbs in P2 gives 100-70-14-8 = 8 grams of protein.
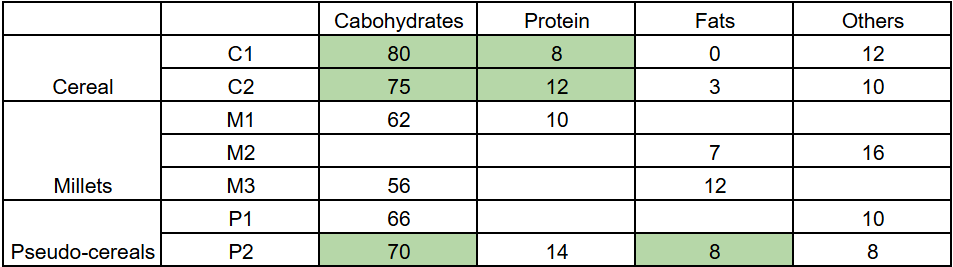
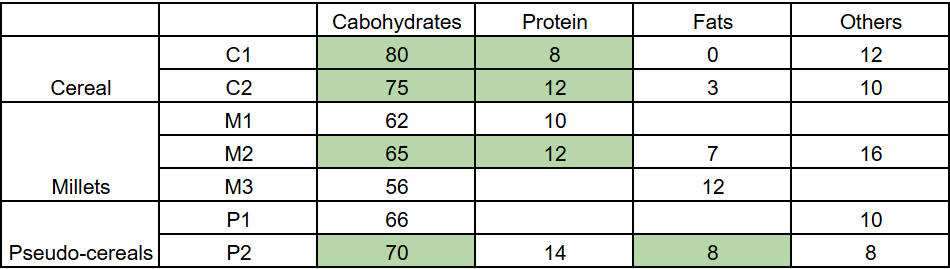
Clue 1 gives us that the protein in M2 should be less than that present in either of the pseudo-cereals, which we right now have a baseline of 14.
So the protein in M2 (and M3) can be 12, 8, 4, 0
The protein and carbs in M2 should add up to 100-7-16 = 77
This is only possible if the protein count is 12, giving carbs as 65
The protein in M3 can be 0, 4, 8 or 12
We are given in clue five that the protein in P1 is double that in M3.
The protein in P1 thus can be 0, 8, 16 or 24
Since this P1 protein also has to be more than M1 and M2 protein, it can not be 0 or 8
Leaving only 16 or 24 as the valid values.
The protein and fats in P1 must add up to 100-66-10 = 24
If P1 had 24 grams of protein, then it would have 0 grams of fat, but in clue 4, we are given that all missing fats are non-zero multiples of 4
Hence, the only possible protein value in P1 is 16, with 8 grams of fats. Giving 8 grams of protein in M3 and 24 grams of others in M3.
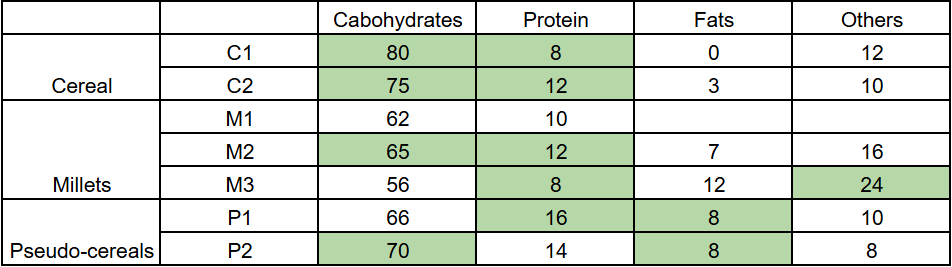
We can see that all other foodgrains except M3 had more carbohydrates than M1.
Therefore, 5 is the correct answer.
How many grams of protein were there in 100 grams of nutrients in M2?
The set's starting point is that the sum of each row must be 100
Clue 3 tells us that all the missing elements in the Carbs column are multiple of 5. Similarly, clue 4 tells us that the missing elements of the other three columns are multiples of 4.
Note that we look at clue 1, which says that the carbs in C1 and C2 must be more than any carbs in any pseudo cereal.
We have the reference point of P1 at 66
Trying to fill in for C1:
The possible values are 75, 80, 85, 90, 95
Since 12 grams is of other nutrients, we can eliminate 90 and 95.
If we take 85, 85+12 = 97, which would leave 3 grams of protein, but from clue 4, we know this has to be a multiple of 4.
Taking 75, 75+12 = 87 would leave 13 grams of protein, which, too, is eliminated.
Leaving only 80 grams of carb in C1 and 8 grams of protein.
Similar logic is to be applied for C2; we have 13 grams already present, so the values of 90 and 95 are eliminated.
Taking 85 carbs would give 2 grams of protein, which can be eliminated.
80 and 70 would also not work for the same reason.
Leavin has only 75 grams of carbs, leaving 12 grams of protein.

Using clues 1 and 2 together, we can determine that the carbs in P2 must be less than 75 but at least greater than 62.
The only possible values are 65 and 70
Putting 65 grams of carbs in P2 gives us 100-65-14-8 = 13 grams of protein, which is invalid.
Putting 70 grams of carbs in P2 gives 100-70-14-8 = 8 grams of protein.

Clue 1 gives us that the protein in M2 should be less than that present in either of the pseudo-cereals, which we right now have a baseline of 14.
So the protein in M2 (and M3) can be 12, 8, 4, 0
The protein and carbs in M2 should add up to 100-7-16 = 77
This is only possible if the protein count is 12, giving carbs as 65

The protein in M3 can be 0, 4, 8 or 12
We are given in clue five that the protein in P1 is double that in M3.
The protein in P1 thus can be 0, 8, 16 or 24
Since this P1 protein also has to be more than M1 and M2 protein, it can not be 0 or 8
Leaving only 16 or 24 as the valid values.
The protein and fats in P1 must add up to 100-66-10 = 24
If P1 had 24 grams of protein, then it would have 0 grams of fat, but in clue 4, we are given that all missing fats are non-zero multiples of 4
Hence, the only possible protein value in P1 is 16, with 8 grams of fats. Giving 8 grams of protein in M3 and 24 grams of others in M3.

We can see that there were 12 grams of protein in M2.
How many grams of other nutrients were there in 100 grams of nutrients in M3?
The set's starting point is that the sum of each row must be 100
Clue 3 tells us that all the missing elements in the Carbs column are multiple of 5. Similarly, clue 4 tells us that the missing elements of the other three columns are multiples of 4.
Note that we look at clue 1, which says that the carbs in C1 and C2 must be more than any carbs in any pseudo cereal.
We have the reference point of P1 at 66
Trying to fill in for C1:
The possible values are 75, 80, 85, 90, 95
Since 12 grams is of other nutrients, we can eliminate 90 and 95.
If we take 85, 85+12 = 97, which would leave 3 grams of protein, but from clue 4, we know this has to be a multiple of 4.
Taking 75, 75+12 = 87 would leave 13 grams of protein, which, too, is eliminated.
Leaving only 80 grams of carb in C1 and 8 grams of protein.
Similar logic is to be applied for C2; we have 13 grams already present, so the values of 90 and 95 are eliminated.
Taking 85 carbs would give 2 grams of protein, which can be eliminated.
80 and 70 would also not work for the same reason.
Leavin has only 75 grams of carbs, leaving 12 grams of protein.
Using clues 1 and 2 together, we can determine that the carbs in P2 must be less than 75 but at least greater than 62.
The only possible values are 65 and 70
Putting 65 grams of carbs in P2 gives us 100-65-14-8 = 13 grams of protein, which is invalid.
Putting 70 grams of carbs in P2 gives 100-70-14-8 = 8 grams of protein.
Clue 1 gives us that the protein in M2 should be less than that present in either of the pseudo-cereals, which we right now have a baseline of 14.
So the protein in M2 (and M3) can be 12, 8, 4, 0
The protein and carbs in M2 should add up to 100-7-16 = 77
This is only possible if the protein count is 12, giving carbs as 65
The protein in M3 can be 0, 4, 8 or 12
We are given in clue five that the protein in P1 is double that in M3.
The protein in P1 thus can be 0, 8, 16 or 24
Since this P1 protein also has to be more than M1 and M2 protein, it can not be 0 or 8
Leaving only 16 or 24 as the valid values.
The protein and fats in P1 must add up to 100-66-10 = 24
If P1 had 24 grams of protein, then it would have 0 grams of fat, but in clue 4, we are given that all missing fats are non-zero multiples of 4
Hence, the only possible protein value in P1 is 16, with 8 grams of fats. Giving 8 grams of protein in M3 and 24 grams of others in M3.
There were 24 grams of other nutrients in M3.
What is the median of the number of grams of protein in 100 grams of nutrients among these food grains?
The set's starting point is that the sum of each row must be 100
Clue 3 tells us that all the missing elements in the Carbs column are multiple of 5. Similarly, clue 4 tells us that the missing elements of the other three columns are multiples of 4.
Note that we look at clue 1, which says that the carbs in C1 and C2 must be more than any carbs in any pseudo cereal.
We have the reference point of P1 at 66
Trying to fill in for C1:
The possible values are 75, 80, 85, 90, 95
Since 12 grams is of other nutrients, we can eliminate 90 and 95.
If we take 85, 85+12 = 97, which would leave 3 grams of protein, but from clue 4, we know this has to be a multiple of 4.
Taking 75, 75+12 = 87 would leave 13 grams of protein, which, too, is eliminated.
Leaving only 80 grams of carb in C1 and 8 grams of protein.
Similar logic is to be applied for C2; we have 13 grams already present, so the values of 90 and 95 are eliminated.
Taking 85 carbs would give 2 grams of protein, which can be eliminated.
80 and 70 would also not work for the same reason.
Leavin has only 75 grams of carbs, leaving 12 grams of protein.
Using clues 1 and 2 together, we can determine that the carbs in P2 must be less than 75 but at least greater than 62.
The only possible values are 65 and 70
Putting 65 grams of carbs in P2 gives us 100-65-14-8 = 13 grams of protein, which is invalid.
Putting 70 grams of carbs in P2 gives 100-70-14-8 = 8 grams of protein.
Clue 1 gives us that the protein in M2 should be less than that present in either of the pseudo-cereals, which we right now have a baseline of 14.
So the protein in M2 (and M3) can be 12, 8, 4, 0
The protein and carbs in M2 should add up to 100-7-16 = 77
This is only possible if the protein count is 12, giving carbs as 65
The protein in M3 can be 0, 4, 8 or 12
We are given in clue five that the protein in P1 is double that in M3.
The protein in P1 thus can be 0, 8, 16 or 24
Since this P1 protein also has to be more than M1 and M2 protein, it can not be 0 or 8
Leaving only 16 or 24 as the valid values.
The protein and fats in P1 must add up to 100-66-10 = 24
If P1 had 24 grams of protein, then it would have 0 grams of fat, but in clue 4, we are given that all missing fats are non-zero multiples of 4
Hence, the only possible protein value in P1 is 16, with 8 grams of fats. Giving 8 grams of protein in M3 and 24 grams of others in M3.
The proteins in the foodgrains, when arranged in ascending order, are: 8, 8, 10, 12, 12,14, 16
Giving the median as 12.
Comprehension:
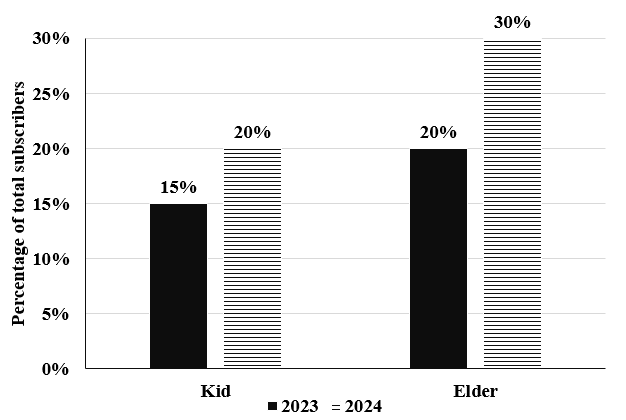
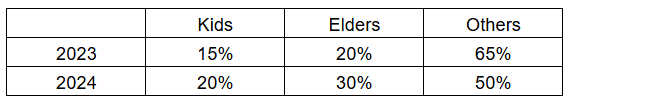
Over the top (OTT) subscribers of a platform are segregated into three categories: i) Kid, ii)Elder, and iii) Others. Some of the subscribers used one app and the others used multiple apps to access the platform. The figure below shows the percentage of the total number of subscribers in 2023 and 2024 who belong to the ‘Kid’ and ‘Elder’ categories.
The following additional facts are known about the numbers of subscribers.
1. The total number of subscribers increased by 10% from 2023 to 2024.
2. In 2024, 1/2 of the subscribers from the ‘Kid’ category and 2/3 of the subscribers from the ‘Elder’ category subscribers use one app.
3. In 2023, the number of subscribers from the ‘Kid’ category who used multiple apps was the same as the number of subscribers from the ‘Elder’ category who used one app.
4. 10,000 subscribers from the ‘Kid’ category used one app and 15,000 subscribers from the ‘Elder’ category used multiple apps in 2023.
How many subscribers belonged to the ‘Others’ category in 2024?
Reading the bar graphs, we can find the distribution of the subscribers as:
Taking clue one into consideration, let's take the total number of subscribers in 2023 as 100x and in 2204 as 110x
This would give the split of subscribers as follows:
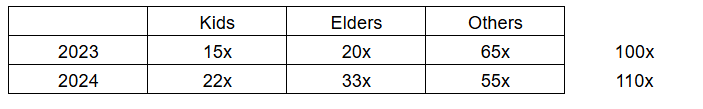
Clue 2 says that half of 22x, which is 11x and 2/3 of 33x, which is 22x, used one app, given that in 2024, out of 55x, 33x used one app.
Clues 3 and 4 are to be used with each other.
Clue 4 says that out of 15x kids, 10,000 used one app, and out of 20x Elders, 15,000 used multiple apps.
Clue 3 says that the kids who used multiple apps (15x - 10000) were the same as Elders who used one app (20x - 15000)
Equating these two we get:
15x- 10000 = 20x - 15000
5x = 5000
x = 1000
The first question asks about the number of others in 2024, which is 55x, or simply 55,000
Therefore, Option C is the correct answer.
What percentage of subscribers in the ‘Kid’ category used multiple apps in 2023?
Reading the bar graphs, we can find the distribution of the subscribers as:
Taking clue one into consideration, let's take the total number of subscribers in 2023 as 100x and in 2204 as 110x
This would give the split of subscribers as follows:
Clue 2 says that half of 22x, which is 11x and 2/3 of 33x, which is 22x, used one app, given that in 2024, out of 55x, 33x used one app.
Clues 3 and 4 are to be used with each other.
Clue 4 says that out of 15x kids, 10,000 used one app, and out of 20x Elders, 15,000 used multiple apps.
Clue 3 says that the kids who used multiple apps (15x - 10000) were the same as Elders who used one app (20x - 15000)
Equating these two, we get:
15x- 10000 = 20x - 15000
5x = 5000
x = 1000
There are 15x, that is, 15,000 kids in 2023, of which we are given that 10,000 use one app.
So, 5,000 use multiple apps.
The percentage of kids using multiple apps in 2023 would hence be $$\frac{5000}{15000}\times\ 100=\frac{100}{3}=33.33\%$$
Therefore, Option A is the correct answer.
What was the percentage increase in the number of subscribers in the ‘Elder’ categoryfrom 2023 to 2024?
Reading the bar graphs, we can find the distribution of the subscribers as:
Taking clue one into consideration, let's take the total number of subscribers in 2023 as 100x and in 2204 as 110x
This would give the split of subscribers as follows:
Clue 2 says that half of 22x, which is 11x and 2/3 of 33x, which is 22x, used one app, given that in 2024, out of 55x, 33x used one app.
Clues 3 and 4 are to be used with each other.
Clue 4 says that out of 15x kids, 10,000 used one app, and out of 20x Elders, 15,000 used multiple apps.
Clue 3 says that the kids who used multiple apps (15x - 10000) were the same as Elders who used one app (20x - 15000)
Equating these two, we get:
15x- 10000 = 20x - 15000
5x = 5000
x = 1000
In 2023, there were 20,000 elders; in 2024, there were 33,000 elders.
The increase in percentage would be $$\frac{33000-20000}{20000}\times\ 100=\frac{13}{20}\times\ 100=65\%$$
Therefore, Option C is the correct answer.
What could be the minimum percentage of subscribers who used multiple apps in 2024?
Reading the bar graphs, we can find the distribution of the subscribers as:
Taking clue one into consideration, let's take the total number of subscribers in 2023 as 100x and in 2204 as 110x
This would give the split of subscribers as follows:
Clue 2 says that half of 22x, which is 11x and 2/3 of 33x, which is 22x, used one app, given that in 2024, out of 55x, 33x used one app.
Clues 3 and 4 are to be used with each other.
Clue 4 says that out of 15x kids, 10,000 used one app, and out of 20x Elders, 15,000 used multiple apps.
Clue 3 says that the kids who used multiple apps (15x - 10000) were the same as Elders who used one app (20x - 15000)
Equating these two, we get:
15x- 10000 = 20x - 15000
5x = 5000
x = 1000
In clue 2, we were given that 33000 kids and elders out of 55000 kids and elders use one app, showing that 22000 use multiple apps. To minimize the total usage of multiple apps, we can assume that all 55000 other subscribers use one app.
Giving the percentage of multiple app users as: $$\frac{22,000}{110,000}\times\ 100=\frac{100}{5}=20\%$$
Therefore, Option B is the correct answer.
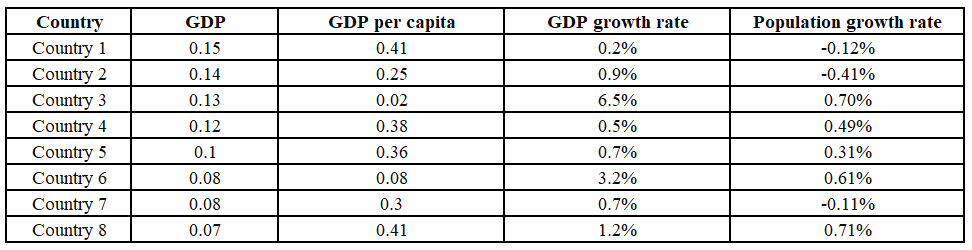
Out of 10 countries -- Country 1 through Country 10 -- Country 9 has the highest gross domestic product (GDP), and Country 10 has the highest GDP per capita. GDP per capita is the GDP of a country divided by its population. The table below provides the following data about Country 1 through Country 8 for the year 2024.
• Column 1 gives the country's identity.
• Column 2 gives the country’s GDP as a fraction of the GDP of Country 9.
• Column 3 gives the country’s GDP per capita as a fraction of the GDP per capita of Country10.
• Column 4 gives the country’s annual GDP growth rate.
• Column 5 gives the country’s annual population growth rate.
Assume that the GDP growth rates and population growth rates of the countries will remain constant for the next three years.
Which one among the countries 1 through 8, has the smallest population in 2024?
We are given the following table,
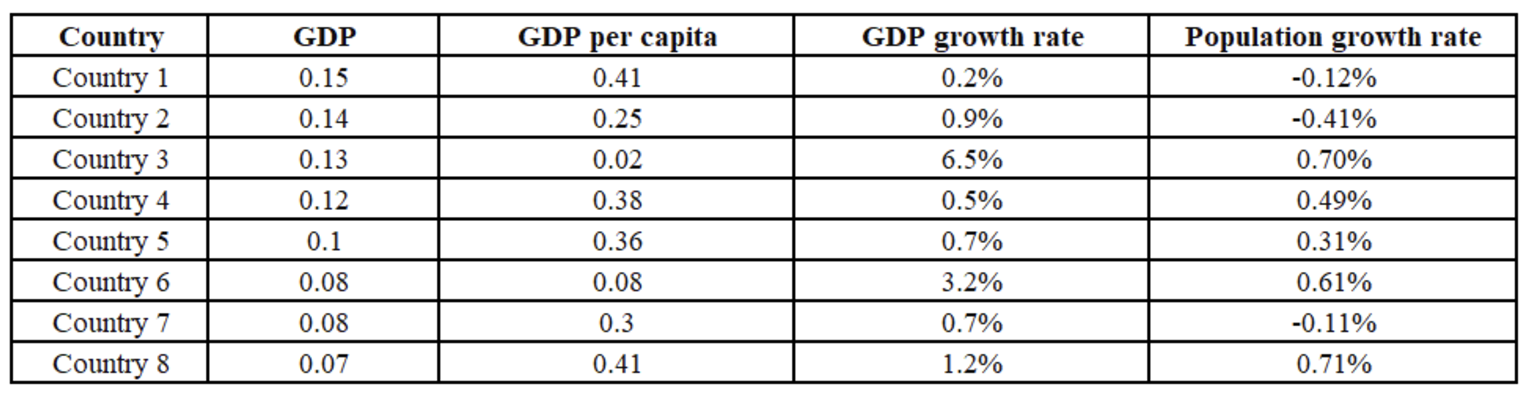
This table compares the GDP, GDP per capita, and population of eight countries, all of which are referenced using a consistent set of units.
Specifically, the GDP values are all given with the same country as the reference point (The reference point being Country 9)
Similarly, the GDP per capita among the eight countries in the table is given using the same reference point (The reference point being Country 10)
As a result, when comparing two countries from the list in terms of GDP, GDP per capita, or population, we can directly use the values presented in the table, since they are all based on a uniform reference point.
We can compare the population of two countries using the formula, $$Population=\dfrac{GDP}{GDP\ Per\ Capita}$$
For example, to compare the GDP of Country A and Country B, we can simply use the values listed under "GDP" in the table, as both are referenced using the same country throughout. This eliminates the need for additional conversions or adjustments.
In this question we are asked to find which of the countries among the four options has the least population in 2024 (The current year)
Option A: Country 8
GDP=0.07 and GDP Per Capita=0.41
Population=0.07/0.41 or $$\frac{7}{41}$$
Option B: Country 3
GDP=0.13 and GDP Per Capita=0.02
Population=0.13/0.02 or $$\frac{13}{2}$$
Option C: Country 7
GDP=0.08 and GDP Per Capita=0.3
Population=0.08/0.3 or $$\frac{8}{30}$$
Option D: Country 5
GDP=0.1 and GDP Per Capita=0.36
Population=0.1/0.36 or $$\frac{10}{36}$$
Comparing the four values, we are looking for the smallest values among the four,
$$\frac{7}{41}$$, $$\frac{13}{2}$$, $$\frac{8}{30}$$, $$\frac{10}{36}$$
$$\frac{7}{41}$$ is the smallest value among the four, hence Option A or Country 8 is the answer.
The ratio of Country 4’s GDP to Country 5’s GDP in 2026 will be closest to
We are given the following table,
This table compares the GDP, GDP per capita, and population of eight countries, all of which are referenced using a consistent set of units.
Specifically, the GDP values are all given with the same country as the reference point (The reference point being Country 9)
Similarly, the GDP per capita among the eight countries in the table is given using the same reference point (The reference point being Country 10)
As a result, when comparing two countries from the list in terms of GDP, GDP per capita, or population, we can directly use the values presented in the table, since they are all based on a uniform reference point.
We can compare the population of two countries using the formula, $$Population=\dfrac{GDP}{GDP\ Per\ Capita}$$
For example, to compare the GDP of Country A and Country B, we can simply use the values listed under "GDP" in the table, as both are referenced using the same country throughout. This eliminates the need for additional conversions or adjustments.
We are given the GDP growth rate and we are told it is constant over the next three years,
Country 4 GDP: 0.12 and the given growth rate is 0.5%
GDP of Country 4 in 2026 will be $$0.12\times\ \left(1.005\right)^2$$ this equals 0.121203
Country 4 GDP: 0.1 and the given growth rate is 3.2
GDP of Country 5 in 2026 will be $$0.1\times\ \left(1.007\right)^2$$ this equals 0.1014049
Ratio will be, $$\dfrac{0.121203}{0.1065024}$$ this equals 1.19523
Hence, the answer is Option A
Which one among the countries 1, 4, 5, and 7 will have the largest population in 2027?
We are given the following table,
This table compares the GDP, GDP per capita, and population of eight countries, all of which are referenced using a consistent set of units.
Specifically, the GDP values are all given with the same country as the reference point (The reference point being Country 9)
Similarly, the GDP per capita among the eight countries in the table is given using the same reference point (The reference point being Country 10)
As a result, when comparing two countries from the list in terms of GDP, GDP per capita, or population, we can directly use the values presented in the table, since they are all based on a uniform reference point.
We can compare the population of two countries using the formula, $$Population=\dfrac{GDP}{GDP\ Per\ Capita}$$
For example, to compare the GDP of Country A and Country B, we can simply use the values listed under "GDP" in the table, as both are referenced using the same country throughout. This eliminates the need for additional conversions or adjustments.
The given question asks us to compare the population of countries between 1, 4, 5, and 7 in the year 2027
Country 1: Population in 2024 will be 0.15/0.41 or 15/41 and the population is decreasing at the rate 0.12%
Country 4: Population in 2024 will be 0.12/0.38 or 12/38 and the population is increasing at the rate of 0.49%
Country 5: Population in 2024 will be 0.1/0.36 or 10/36 and the population is increasing at the rate 0.31%
Country 7: Population in 2024 will be 0.08/0.3 or 8/30 and the population is decreasing at the rate 0.11%
Simplifying and comparing the four fractions in order, $$\frac{15}{41}$$, $$\frac{6}{19}$$, $$\frac{5}{18}$$, $$\frac{4}{15}$$
The decimal values of the following are: 0.36586, 0.315789, 0.2777, 0.2666
Right away we can eliminate Country 7 since the population is not only the least, but it is decreasing, so there is no chance it will have the highest population in three years time.
For the other three countries,
Country 1: $$\left(0.36585\right)\times\ \left(0.9988\right)^3$$ this equals 0.36453
Country 4: $$\left(0.315789\right)\times\ \left(1.0049\right)^3$$ this equals 0.32045
Country 7: $$\left(0.2777\right)\times\ \left(1.0031\right)^3$$ this equals 0.2803612
Hence, Country 1 will have the largest population among these four countries.
For how many countries among Country 1 through Country 8 will the GDP per capita in 2027 be lower than that in 2024?
We are given the following table,
This table compares the GDP, GDP per capita, and population of eight countries, all of which are referenced using a consistent set of units.
Specifically, the GDP values are all given with the same country as the reference point (The reference point being Country 9)
Similarly, the GDP per capita among the eight countries in the table is given using the same reference point (The reference point being Country 10)
As a result, when comparing two countries from the list in terms of GDP, GDP per capita, or population, we can directly use the values presented in the table, since they are all based on a uniform reference point.
We can compare the population of two countries using the formula, $$Population=\dfrac{GDP}{GDP\ Per\ Capita}$$
For example, to compare the GDP of Country A and Country B, we can simply use the values listed under "GDP" in the table, as both are referenced using the same country throughout. This eliminates the need for additional conversions or adjustments.
We are asked to find the number of countries where the GDP per capita is lower in 2027 than it was in 2024.
For the GDP per capita to be lower in the consequent years, the population growth rate has to exceed the GDP growth rate, since GDP per capita is nothing but GDP divided by the population. That means if the population growth rate is lesser than that of the GDP growth rate, the GDP per capita will only increase.
We can clearly see that none of the following countries fall in the scenario where GDP growth rate is lesser than that of the population growth rate. Countries 1, 2 and 7 have actually decreasing population rates thereby definitely increasing the GDP per capita.
The rest of the countries have GDP growth rates larger than the population growth rates.
Hence, we can conclude that, none of the countries will have a smaller GDP per capita in 2027 when compared to 2024.
The air-conditioner (AC) in a large room can be operated either in REGULAR mode or in POWER mode to reduce the temperature.
If the AC operates in REGULAR mode, then it brings down the temperature inside the room(called inside temperature) at a constant rate to the set temperature in 1 hour. If it operates in POWER mode, then this is achieved in 30 minutes.
If the AC is switched off, then the inside temperature rises at a constant rate so as to reach the temperature outside at the time of switching off in 1 hour.
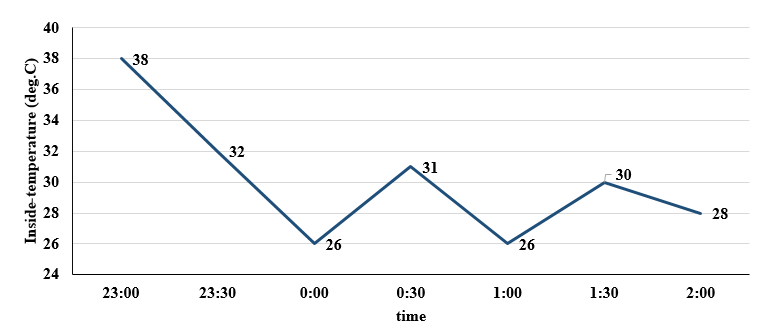
The temperature outside has been falling at a constant rate from 7 pm onward until 3 am on a particular night. The following graph shows the inside temperature between 11 pm (23:00)and 2 am (2:00) that night.
The following facts are known about the AC operation that night.
• The AC was turned on for the first time that night at 11 pm (23:00).
• The AC setting was changed (including turning it on/off, and/or setting different temperatures) only at the beginning of the hour or at 30 minutes after the hour.
• The AC was used in POWER mode for longer duration than in REGULAR mode during this 3-hour period.
How many times the AC must have been turned off between 11:01 pm and 1:59 am?
The set's starting point is the conclusion that the temperature rises only when the AC is turned off.
When the AC is turned off, the temperature rises linearly, reaching the temperature at the time it was turned off in one hour.
The temperature rises in two instances,
From 0:00 to 0:30, it rises from 26 to 31, so by 1:00, it would have reached 36 degrees, meaning that the temperature at 0:00 would have been 36 degrees Celsius.
From 1:00 to 1:30, it rises from 26 to 30, so by 2:00, it would have reached 34 degrees, meaning the temperature at 1:00 would have been 34 degrees Celcius.
Calculating either of these would have been enough as we have the starting temperature at 23:00 at 38 degree celsius. Since the temperature decreases linearly, we can find the temperature at every instance using another data point.
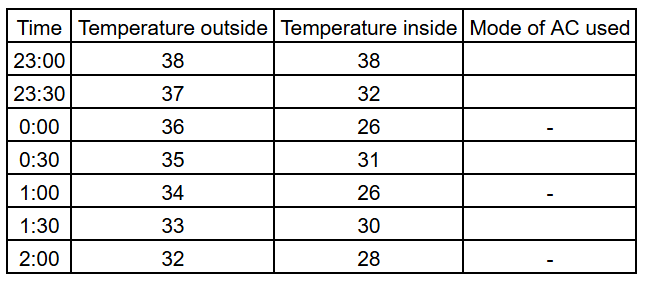
Drawing out the temperature outside, we get:
From this alone, we can answer the first question:
The AC was turned off for only two instances between 11:01 pm and 1:59 am:
Once at 0:00 and once at 1:00
Therefore, Option B is the correct answer.
What was the temperature outside, in degree Celsius, at 1 am?
The set's starting point is the conclusion that the temperature rises only when the AC is turned off.
When the AC is turned off, the temperature rises linearly, reaching the temperature at the time it was turned off in one hour.
The temperature rises in two instances,
From 0:00 to 0:30, it rises from 26 to 31, so by 1:00, it would have reached 36 degrees, meaning that the temperature at 0:00 would have been 36 degrees Celsius.
From 1:00 to 1:30, it rises from 26 to 30, so by 2:00, it would have reached 34 degrees, meaning the temperature at 1:00 would have been 34 degrees Celcius.
Calculating either of these would have been enough as we have the starting temperature at 23:00 at 38 degree celsius. Since the temperature decreases linearly, we can find the temperature at every instance using another data point.
Drawing out the temperature outside, we get:
From the table, we can determine that the temperature outside at 1 am was 34 degrees Celsius.
Therefore, 34 is the correct answer.
What was the temperature outside, in degree Celsius, at 9 pm?
The set's starting point is the conclusion that the temperature rises only when the AC is turned off.
When the AC is turned off, the temperature rises linearly, reaching the temperature at the time it was turned off in one hour.
The temperature rises in two instances,
From 0:00 to 0:30, it rises from 26 to 31, so by 1:00, it would have reached 36 degrees, meaning that the temperature at 0:00 would have been 36 degrees Celsius.
From 1:00 to 1:30, it rises from 26 to 30, so by 2:00, it would have reached 34 degrees, meaning the temperature at 1:00 would have been 34 degrees Celcius.
Calculating either of these would have been enough as we have the starting temperature at 23:00 at 38 degree celsius. Since the temperature decreases linearly, we can find the temperature at every instance using another data point.
Drawing out the temperature outside, we get:
Extrapolating this linear chain of temperature drop (2 degrees drop every hour), we can see that the temperature at 22:00 would be 40 degrees Celsius, and the temperature at 21:00 or 9 pm would be 42 degrees Celsius.
Therefore, 42 is the correct answer.
What best can be concluded about the number of times the AC must have either been turned on or the AC temperature setting been altered between 11:01 pm and 1:59 am?
The set's starting point is the conclusion that the temperature rises only when the AC is turned off.
When the AC is turned off, the temperature rises linearly, reaching the temperature at the time it was turned off in one hour.
The temperature rises in two instances,
From 0:00 to 0:30, it rises from 26 to 31, so by 1:00, it would have reached 36 degrees, meaning that the temperature at 0:00 would have been 36 degrees Celsius.
From 1:00 to 1:30, it rises from 26 to 30, so by 2:00, it would have reached 34 degrees, meaning the temperature at 1:00 would have been 34 degrees Celcius.
Calculating either of these would have been enough as we have the starting temperature at 23:00 at 38 degree celsius. Since the temperature decreases linearly, we can find the temperature at every instance using another data point.
Drawing out the temperature outside, we get:
We can see that the AC was turned on at 0:30, 1:30 and 23:00.
We do not know about the status at 23:30
We are to count the times after 11:01 pm; hence, turning on the AC at 23:00 does not count.
Hence, the answer should be 2 or 3.
But in the final clue, we are given that POWER mode was used longer than REGULAR mode.
Since there are 4 periods of 30 minutes each, the combinations possible are POWER-3, REGULAR-1, and POWER-4, REGULAR-0
If the AC were on REGULAR mode at 23:00, it would have functioned for 1 hour, and the power mode would have also functioned for 1 hour (total), which would go against the final clue.
The following would be the cases.
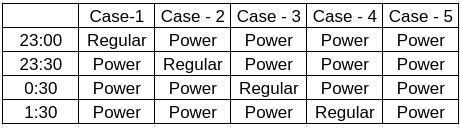
But there were three instances of activation between 11:01 and 1:59
Hence, Option D would be the correct answer.
What was the maximum difference between temperature outside and inside temperature, in degree Celsius, between 11:01 pm and 1:59 am?
The set's starting point is the conclusion that the temperature rises only when the AC is turned off.
When the AC is turned off, the temperature rises linearly, reaching the temperature at the time it was turned off in one hour.
The temperature rises in two instances,
From 0:00 to 0:30, it rises from 26 to 31, so by 1:00, it would have reached 36 degrees, meaning that the temperature at 0:00 would have been 36 degrees Celsius.
From 1:00 to 1:30, it rises from 26 to 30, so by 2:00, it would have reached 34 degrees, meaning the temperature at 1:00 would have been 34 degrees Celcius.
Calculating either of these would have been enough as we have the starting temperature at 23:00 at 38 degree celsius. Since the temperature decreases linearly, we can find the temperature at every instance using another data point.
Drawing out the temperature outside, we get:
(Side note: We cannot consider the temperatures outside and inside at 23:00 and 2:00 since the time limit does not include those.)
The maximum difference between the elements of the outside and inside is maximum at 0:00 when the outside temperature is 36, and the inside temperature is 26.
Giving the maximum difference as 10
Therefore,10 is the correct answer.

Educational materials for CAT preparation
