CAT 2019 Slot 2 Question Paper
To compare the rainfall data, India Meteorological Department (IMD) calculated the Long Period Average (LPA) of rainfall during period June-August for each of the 16 states. The figure given below shows the actual rainfall (measured in mm) during June-August, 2019 and the percentage deviations from LPA of respective states in 2018. Each state along with its actual rainfall is presented in the figure.

CAT 2019 Slot 2 - Question 41
What is the average rainfall of all states that have actual rainfall of 600 mm or less in 2019 and have a negative deviation from LPA?
CAT 2019 Slot 2 - Question 42
The LPA of a state for a year is defined as the average rainfall in the preceding 10 years considering the period of June-August. For example, LPA in 2018 is the average rainfall during 2009-2018 and LPA in 2019 is the average rainfall during 2010-2019. It is also observed that the actual rainfall in Gujarat in 2019 is 20% more than the rainfall in 2009. The LPA of Gujarat in 2019 is closest to
The first year students in a business school are split into six sections. In 2019 the Business Statistics course was taught in these six sections by Annie, Beti, Chetan, Dave, Esha, and Fakir. All six sections had a common midterm (MT) and a common endterm (ET) worth 100 marks each. ET contained more questions than MT. Questions for MT and ET were prepared collectively by the six faculty members. Considering MT and ET together, each faculty member prepared the same number of questions.
Each of MT and ET had at least four questions that were worth 5 marks, at least three questions that were worth 10 marks, and at least two questions that were worth 15 marks. In both MT and ET, all the 5-mark questions preceded the 10-mark questions, and all the 15- mark questions followed the 10-mark questions.
The following additional facts are known.
i. Annie prepared the fifth question for both MT and ET. For MT, this question carried 5 marks.
ii. Annie prepared one question for MT. Every other faculty member prepared more than one questions for MT.
iii. All questions prepared by a faculty member appeared consecutively in MT as well as ET.
iv. Chetan prepared the third question in both MT and ET; and Esha prepared the eighth question in both.
v. Fakir prepared the first question of MT and the last one in ET. Dave prepared the last question of MT and the first one in ET.
CAT 2019 Slot 2 - Question 44
How many 5‐mark questions were there in MT and ET combined?
CAT 2019 Slot 2 - Question 46
Which of the following questions did Beti prepare in ET?
_pluB7JG.png)
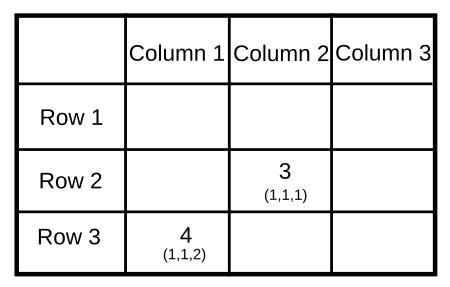
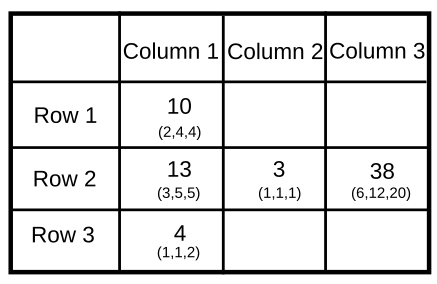
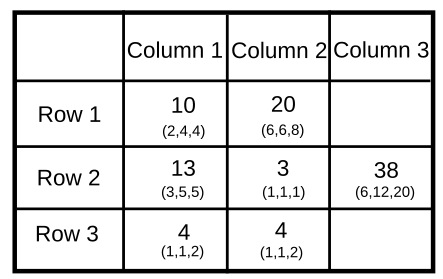
Three pouches (each represented by a filled circle) are kept in each of the nine slots in a 3 × 3 grid, as shown in the figure. Every pouch has a certain number of one-rupee coins. The minimum and maximum amounts of money (in rupees) among the three pouches in each of the nine slots are given in the table. For example, we know that among the three pouches kept in the second column of the first row, the minimum amount in a pouch is Rs. 6 and the maximum amount is Rs. 8.
There are nine pouches in any of the three columns, as well as in any of the three rows. It is known that the average amount of money (in rupees) kept in the nine pouches in any column or in any row is an integer. It is also known that the total amount of money kept in the three pouches in the first column of the third row is Rs. 4.
CAT 2019 Slot 2 - Question 47
What is the total amount of money (in rupees) in the three pouches kept in the first column of the second row?
789
456
123
0.-
Clear All
CAT 2019 Slot 2 - Question 48
How many pouches contain exactly one coin?
789
456
123
0.-
Clear All
CAT 2019 Slot 2 - Question 49
What is the number of slots for which the average amount (in rupees) of its three pouches is an integer?
789
456
123
0.-
Clear All
CAT 2019 Slot 2 - Question 50
The number of slots for which the total amount in its three pouches strictly exceeds Rs. 10 is
789
456
123
0.-
Clear All


.png)


