CAT 1998 Question Paper
The following table gives the quantities of apples (in tonnes) arriving at New Delhi market from various states in a particular year. The month in which demand was more than supply, the additional demand was met by the stock from cold storage.
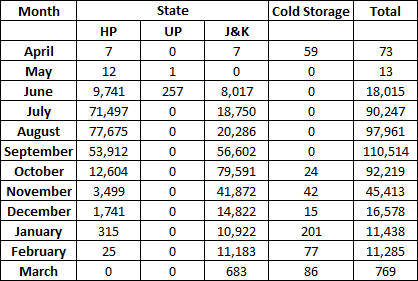
CAT 1998 - Question 1
What was the maximum percentage of apples supplied by any state in any of the months?
CAT 1998 - Question 2
Which state supplied the maximum number of apples?
CAT 1998 - Question 3
Which state supplied the highest percentage of apples from the total apples supplied?

CAT 1998 - Question 4
In which of the following periods was the supply greater than or equal to the demand?
CAT 1998 - Question 5
If the yield per tree was 40 kg, then from how many trees were the apples supplied to New Delhi (in millions) during the year?
CAT 1998 - Question 6
Using the data in the earlier question, if there were 250 trees per hectare, then how many hectares of land was used?

Answer the questions based on the following information. The following bar chart gives the growth percentage in the number of households in the middle, upper-middle and high-income categories in the four regions for the period between 1987-88 and 1994-95.
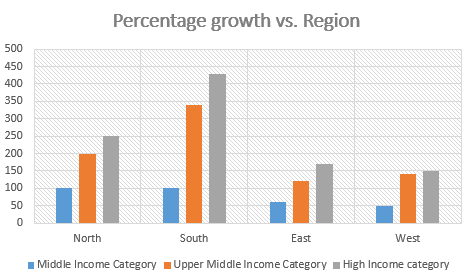
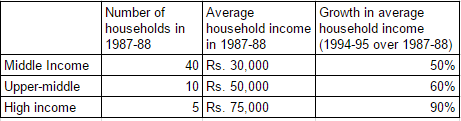
(Number of households in thousands)
CAT 1998 - Question 7
Which region showed the highest percentage growth in number of households in all the income categories for the period?
CAT 1998 - Question 8
What was the total household income in northern region for upper-middle class?
CAT 1998 - Question 9
What is the percentage increase in total number of households for the northern region (upper-middle class) over the given period?

CAT 1998 - Question 10
What was the average income of the high-income group in 1987-88?
