Sign in
Please select an account to continue using cracku.in
↓ →
The graph given below shows the quantity of milk and food grains consumed annually along with female and male population (in millions). Use the data to answer the questions that follow.
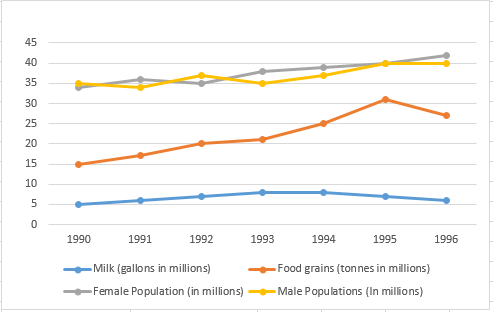
The population is increasing steadily, but the milk consumed decreased significantly in 1996.
Hence, the only two years we need to check for the least per capita milk consumption are the first year (1990) and 1996.
Milk consumed in 1990 is 5 million gallons.
Total population in 1990 is 34+35 = 69 million.
Hence, per capita consumption of milk in 1990 is 0.072 gallon per person.
Milk consumed in 1996 is 6 million gallons.
Total population in 1996 is 40+42 = 82 million.
Hence, per capita consumption of milk in 1996 is 0.073 gallon per person.
Hence, the year with the least per capita consumption of milk is 1990.
Create a FREE account and get:
Book Free CAT Mentorship
Get personalized CAT strategy from a 99%iler
500+ students mentored
OTP Verification
Enter the 6-digit code sent to your phone
Booking Summary
Enter OTP
Didn't receive the OTP?

Educational materials for CAT preparation

Ask our AI anything

AI can make mistakes. Please verify important information.
AI can make mistakes. Please verify important information.