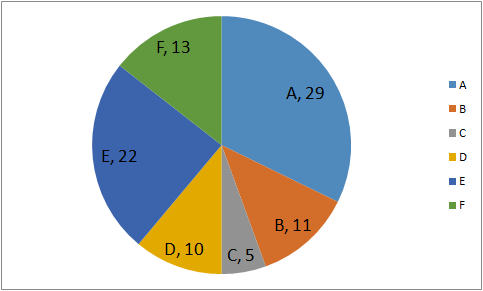
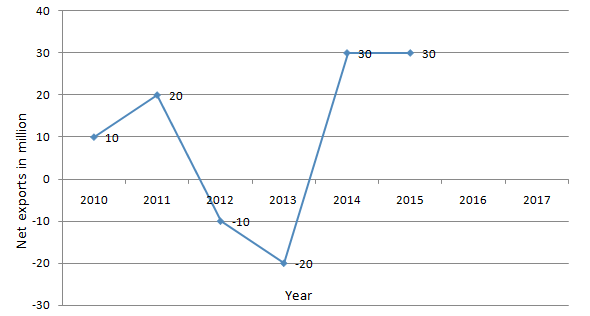
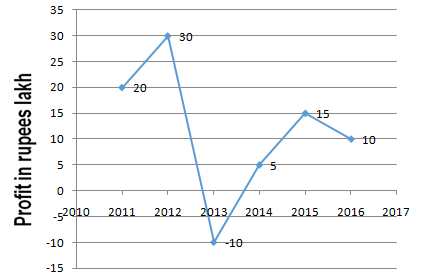
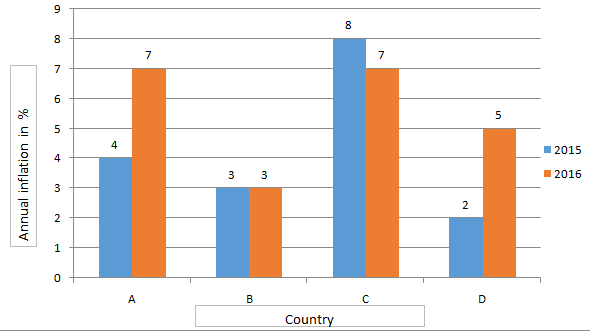
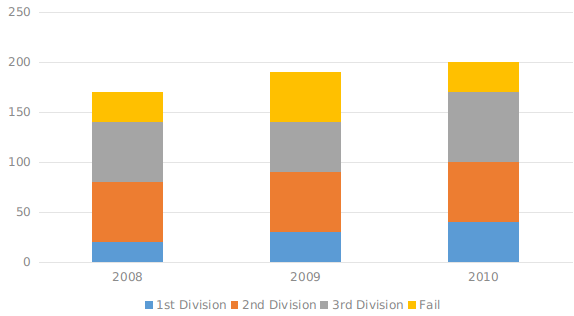
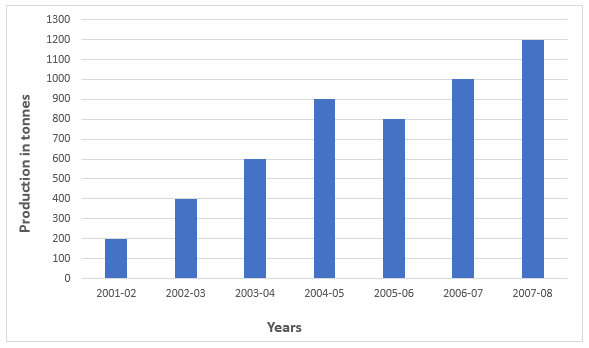
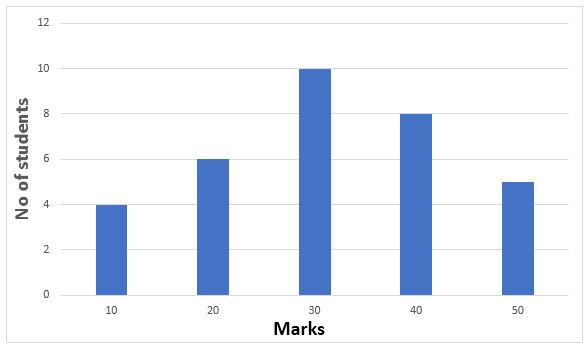
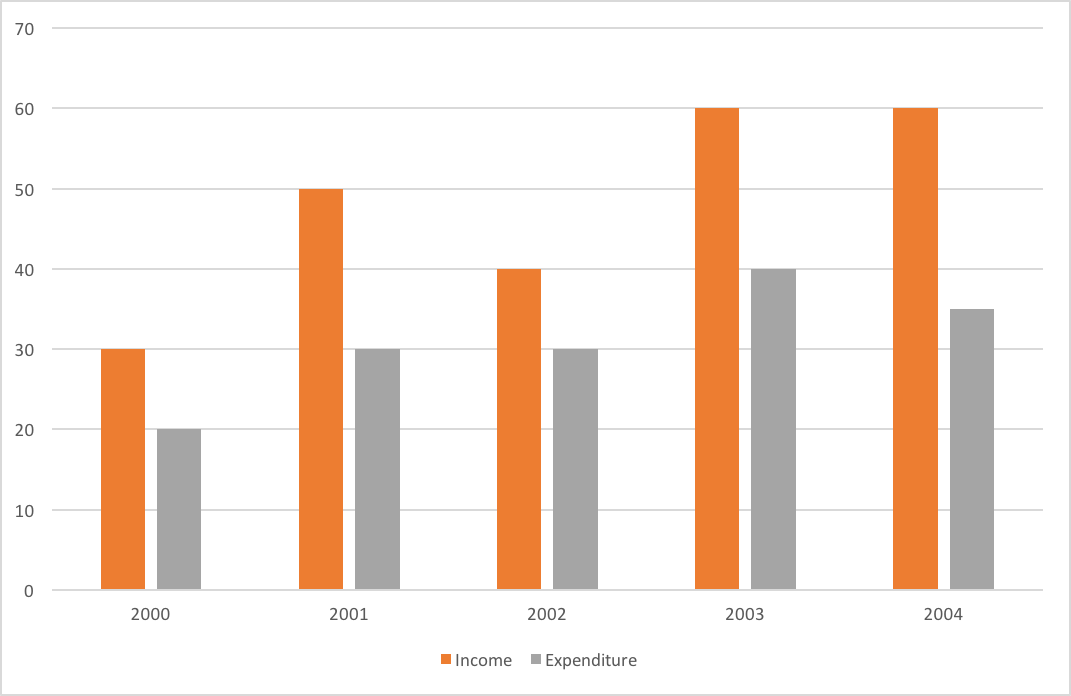
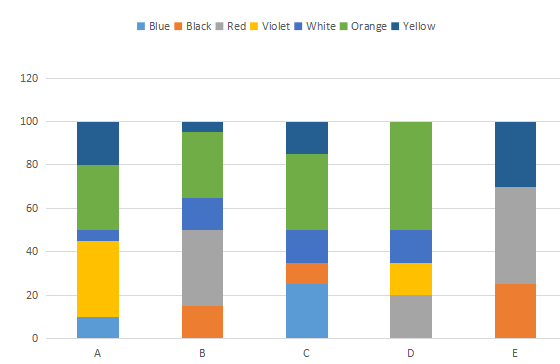
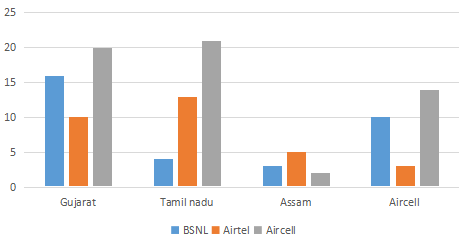
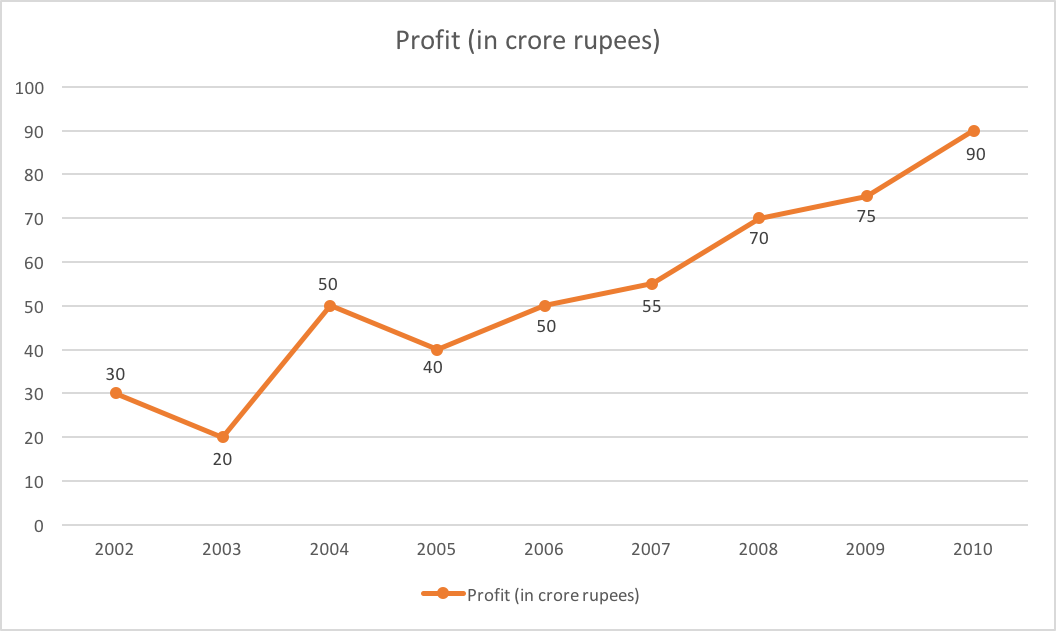
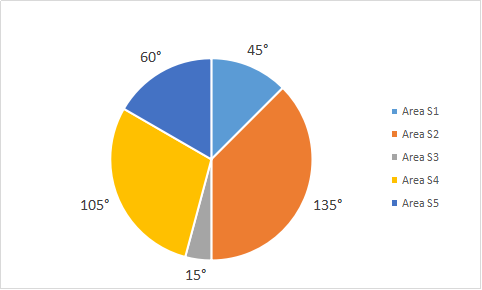
Study the given histogram that shows the marks obtained by students in an examination and answer the question that follows.
The number of students who obtained less than 250 marks is what per cent more than the number of students who obtained 400 or more marks? (correct to one decimal place)
Question 2
The given bar graph shows the number of students of two schools over a period of six years.
In the bar graph, what is the ratio of the students taken for years the 2008, 2012, 2013 together from school A to the students taken for the years 2009, 2010, 2011 together from school B?
Question 3
The given bar graph shows the sales of cars from six branches of a dealer B1, B2, B3, B4, B5, B6, during two consecutive years 2018 and 2019. Blue colour corresponds to the year 2018 and red colour corresponds to the year 2019.
Question 4
Study the given histogram that shows the marks obtained by students in an examination and answer the question that follows
The number of students who obtained less than 250 marks is:
Question 5
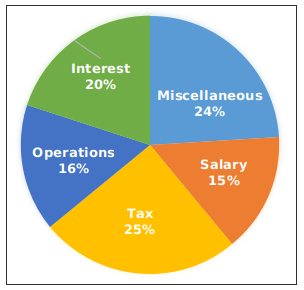
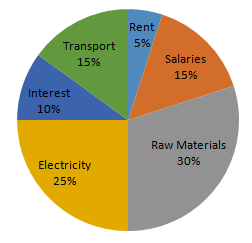
The following pie chart shows percentage expenditure of a country on different heads. The total expenditure is 1,680 (in billions). Study the chart and answer the question.
The central angle of the sector representing expenditure on Interest payment is:
Question 6
The following histogram shows the weights of students of class X in a school on a particular day. Total number of students enrolled in class X = 200.
The number of students weighing less than 55 kg is what percentage less than the number of students weighing 55 kg to 65 kg?
Question 7
Study the given histogram that shows the marks obtained by students in an examination and answer the question that follows
If the total marks obtained by students be represented as a pie chart, then the central angle of the sector representing marks 200 or more but less than 300, is: (correct to the nearest degree)
Question 8
The given histogram shows the height of the students.
What is the percentage of students whose height is in the class interval 165 - 175 ? (correct to the nearest integer)
Question 9
The following pie chart shows percentage expenditure of a country on different heads. The total expenditure is 21,680 (in billions). Study the chart and answer the question.
The amount of expenditure on Defence is what percentage more than the expenditure on Education?
Question 10
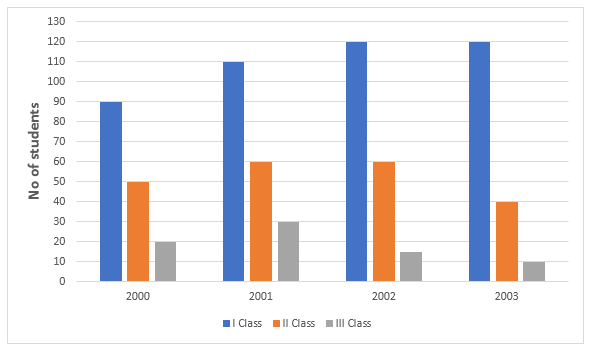
The number of students in Class XI in Science, Arts and Commerce streams of a school over a period of 4 years (2011 - 2014) has been depicted through the bar chart given below.
What is the difference between the averages of the number of Science and Commerce students in the given class over he given period of 4 years time ?
Question 11
The given bar graph shows the number of students of two schools over a period of six years.
In the bar graph, what is the ratio of the average of total students from school B to the average of total students from school A?
Question 12
The given bar graph shows the sales of cars from six branches of a dealer B1, B2, B3, B4, B5, B6, during two consecutive years 2018 and 2019. Blue colour corresponds to the year 2018 and red colour corresponds to the year 2019.
The total sale of cars from all the branches in the year 2018 is what percentage less than the total sales of cars from all the branches in the year 2019? (correct to one decimal place)
Question 13
Study the given histogram that shows the marks obtained by students in an examination and answer the question that follows.
If the total marks obtained by students be represented as a pie chart, then the central angle corresponding to marks 250 or more but less than 300 is: (correct to the nearest degree)
Question 14
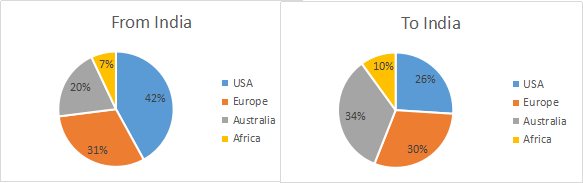
The given pie charts represent the popularity of ice-cream flavours in the years 2005 and 2015.
If a percentage point shift results in annual additional sales of ₹ 5,000, how much(in ₹), did the combined annual strawberry and butterscotch sales increase from 2005 to 2015?
Question 15
The given histogram shows the height of the students.
The number of students whose height is in the class interval 165-170 is what percentage less than the number of students whose height is in the interval 150-155? (correct to one decimal place)
Question 16
The following pie chart shows percentage expenditure of a country on different heads. The total expenditure is ₹1, 680 (in billions). Study the chart and answer the question.
The expenditure on Education is what percentage less than the expenditure on Defence?
Question 17
The given pie chart represents the popularity of ice-cream flavours in the year 2015.
In 2015, if the total sale of chocolate flavour is for ₹ 5,160, then the total sale (in ₹) for vanilla flavour is:
Question 18
The following pie chart shows percentage expenditure of a country on different heads. The total expenditure is ₹1,680 (in billions). Study the chart and answer the question.
The expenditure for Proceeds to state (in billions ₹) is:
Question 19
The following pie chart shows percentage expenditure of a country on different heads. The total expenditure is ₹ 1,680 (in billions). Study the chart and answer the question.
The central angle of the sector representing expenditure on Subsidy is :
Question 20
The given bar graph shows the number of students of two schools over a period of six years.
In the bar graph, in which year is the absolute difference of the students from schools A to B taken together, the maximum?
Question 21
The given bar graph shows the sales of cars from six branches of a dealer B1, B2. B3, B4, B5. B6, during two consecutive years 2018 and 2019. Blue colour corresponds to the year 2018 and red colour corresponds to the year 2019.
In the bar graph, the ratio of the total sales from branches B1, B2 and B3 taken together for the year 2018 to the sales from the branches B6, B4 and BS for the year 2019, is:
Question 22
The number of students in Class XI in Science, Arts and Commerce streams of a school over a period of 4 years (2011 - 2014) has been depicted through the bar chart given below.
What is the average of the number of Arts students in the given class over the given period of 4 years?
Question 23
The following pie chart shows percentage expenditure of a country on different heads. The total expenditure is ₹ 1,680 (in billions). Study the chart and answer the question.
The total amount of expenditure for education and Health (in billions ₹) is:
Question 24
Study the given histogram that shows the marks obtained by students in an examination and answer the question that follows.
The number of students who obtained less than 350 marks is what per cent more than the number of students who obtained 400 or more marks?(correct to one decimal place)
Question 25
The fasting blood sugar level (F) and the post prandial blood sugar level (PP) of a patient was monitored for four weeks W1, W2, W3, W4, and the readings (in mg/dl) for the four weeks are as follows: F/PP: 170/220, 150/180, 120/150, 90/120. These have been presented through a bar graph. The normal rangeis considered to be: F/PP: 70 - 100/100 - 130.
During which week was the fasting blood sugar level of the patient approximately 115.4% above the upper limit of normal pp blood sugar level?
Question 26
Study the given histogram that shows the marks obtained by students in an examination and answer the question that Students follows.
The number of students who obtained less than 200 marks is:
Question 27
The given pie chart represents the popularity of ice-cream flavours in the year 2005.
In 2005, if 40% of the ‘other’ category is mix fruit flavour and 1570 people surveyed preferred mix fruit flavour, then how many people were surveyed?
Question 28
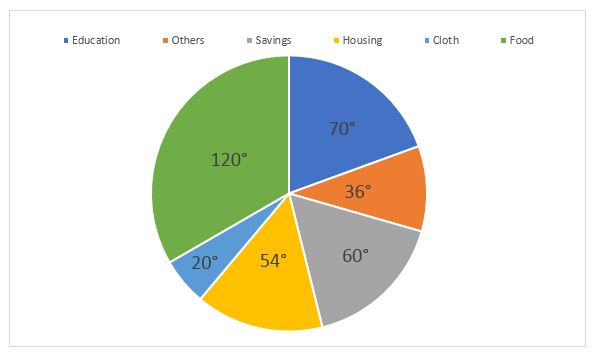
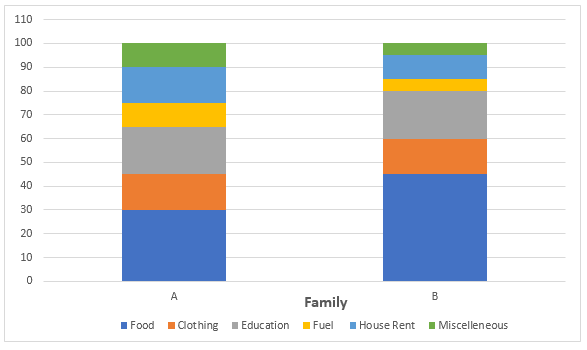
Pie-Chart shows the degree wise breakup of expenditure of a family in a month. Total income of the family is ₹144000.
The expenditure on education = $$\frac{60}{360}\times$$144000
= ₹24000
Hence, the correct answer is Option B
Question 29
Study the following table and answer the question: Number of cars sold by dealers A, B, C, D & E during first six months of 2018.
The ratio of the total number of cars sold by dealer B in January. April and June to the total number of cars sold by dealers A and D in March is:
Question 30
Study the following table and answer the question: Number of students Appeared (A) and Passed (P) in an annual examination from four schools Q, R, S & T in five years (2014 to 2018)
The total number of students passed from school Q in 2014 and 2018 is what percent less than the total number of students appeared from schools R and S in 2017?
Question 31
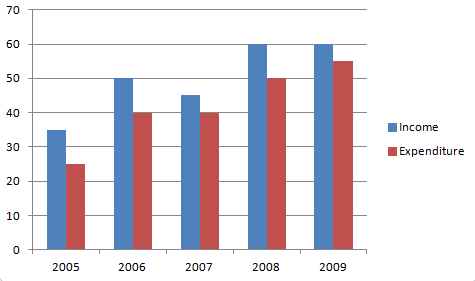
Study the given graph and answer the question that follows.
The ratio of the actual production of AC's in February and April to that of the target production of AC's in January and April is:
Question 32
Study the given pie chart and answer the question that follows:
The pie chart shows the break-up of the total number of employees of a company in 2019, in five departments A, B, C, D and E.
Total number of employees = 4500
If 30% of the employees in department B are transferred to department D, then the difference between the number of employees in department C and D is $$x$$, which lies between:
Question 33
study the given pie chat, and answer the question that follows.
The given chart represents the percentage-wise distribution of the total number of vanilla cakes and chocolate cakes sold on each day of the week. The total number of cakes sold in a week = 10500.
If the ratio of vanilla cakes sold to chocolate cakes sold on Wednesday is 13: 8, then how many vanilla cakes are sold on that day?
Question 34
Study the graph and answer the question given below. The given graph represents the number of workers getting daily wages (in ₹) Total number of workers = 200
The total number of workers whose daily wages are less than ₹550 is what percentage less than the total number of workers whose daily wages are ₹550 and above?
Question 35
Study the table and answer the question. The data given in the table shows the number of students studying in four different disciplines in 5 institutes.
Number of students studying commerce in institute D is what percent of the total number of students of the 5 institutes?
Question 36
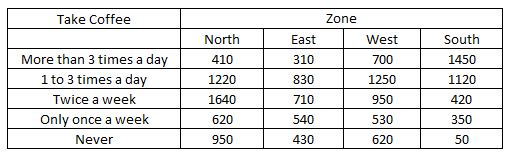
Table shows District-wise data of number of primary school teachers posted in schools of a city.
What is the difference between the total number of male teachers in the districts East, North, West taken together and the total number of female teachers in the districts East and South?
The total marks obtained by Anuj in all the five subjects = $$\frac{80}{100}\times75+\frac{55}{100}\times80+\frac{68}{100}\times100+\frac{66}{100}\times50+\frac{84}{100}\times150$$
= 60 + 44 + 68 + 33 + 126
= 331
Hence, the correct answer is Option A
Question 40
Study the following table and answer the question: Percentage of marks obtained by six students in five subjects A, B, C, D & E.
The average marks of Manju, Rekha and Abhi in subject B are?
Marks obtained by Majnu in subject B = $$\frac{85}{100}\times$$80 = 68
Marks obtained by Rekha in subject B = $$\frac{75}{100}\times$$80 = 60
Marks obtained by Abhi in subject B = $$\frac{65}{100}\times$$80 = 52
The average marks of Manju, Rekha and Abhi in subject B = $$\frac{68+60+52}{3}$$
= $$\frac{180}{3}$$
= 60
Hence, the correct answer is Option B
Question 41
Study the given graph and answer the question that follows.
If a pie chart is drawn for the data related to the expenditure of the company in five years, then the central angle of the sector representing expenditure in 2016 will lie between:
Question 42
Study the pie-chart which shows the sales distribution of products A, B, C, D and E of a company XYZ in 2019, and answer the question that follows.
The number of units of product C sold by the company exceeds the total number of units of products A and B by x. The value of x lies between:
Question 43
The given histogram represents the marks obtained by 128 students. Read the graph and answer the question that follows.
Number of persons earning ₹300 or more = 50 - 34 = 16
Required ratio = 12 : 16
= 3 : 4
Hence, the correct answer is Option B
Question 45
Study the bar graph and answer the question that follows. The extent of construction of new railway tracks (in km) in four railway sectors A, B, C, D during two consecutive financial years Y1 and Y2 is presented through the given bar graph.
How much is the percentage increase in the railway track length from Y1 to Y2 greater for B than that for D from Y1 and Y2?
Question 46
Study the following table and answer the question: Number of students enrolled for Vocational Courses (VC) in institutes A, B, C, D, E & F.
The difference between the average number of students enrolled for VC in institute F in 2015, 2017 and 2018 and the average number of students enrolled in all the six institutes in 2014, is:
The average number of students enrolled for VC in institute F in 2015, 2017 and 2018 = $$\frac{230+220+210}{3}$$ = 220
The average number of students enrolled for VC in all the six institutes in 2014 = $$\frac{110+120+140+125+150+165}{6}$$ = $$\frac{810}{6}$$ = 135
Required difference = 220 - 135 = 85
Hence, the correct answer is Option D
Question 47
Study the given graph and answer the question that follows.
In which office of the company is the number of male employees 25% more than the average number of female employees in all five offices?
Question 48
Study the given pie chart and answer the question that follows:
The given pie chart shows the distribution ( degree wise) of students in a college playing different sports.
The average number of students playing tennis and hockey is what per cent more than the number of students playing badminton?
Question 49
Table shows income (in ₹) received by 4 employees of a company during the month of December 2020 and all their income sources.
By what percent is the bonus of Varun less than the bonus of Amit and Nitin taken together?
Question 50
The data given in the table shows the number of boys and girls enrolled in three different streams in a school over 5 years.
By what percent is the total number of boys in Arts stream more than the total number of boys in Science stream in the years 2012 to 2020?
Question 51
The number of teachers and students in five school A, B, C, D and E in a city has been depicted through the given bar graph, where the number of students has been prensented as multiples of ten. Study the bar graph and answer the question that follows.
What is the proportion of the student to teacher ratios across the five school A, B, C, D, E?
Question 52
Study the following bar graph and answer the question given below. The given bar graph represents the total of number of applications received for the B.Com course by two different colleges A and B in five different years.
The number of applications received by college A in 2016 is what percentage of the total number of applications received by A college from 2015 to 2019?
Question 53
Study the following graph that shows the number of boys and girls who appeared for the Class X examination in a school XYZ, in different years.
What is the ratio of the total number of boys who appeared for the Class X examination in 2012 and 2013 to that of girls who appeared in 2012 and 2015?
Question 54
Study the following table and answer the question: Percentage of marks obtained by six students in five subjects A, B, C, D & E.
Total marks obtained by Amit, Abhi and Anuj in subject E is what percent more than the total marks obtained by all the six students in subject B? (correct to one decimal! place)
Question 55
Study the given graph and answer the question that follows.
In which year was the production of computers by the company 25% more than the average exports of computers during 2016 to 2018?
Question 56
Study the given graph and answer the question that follows.
In which year is the revenue of the company equal to 1.2 times the average expenditure during 2014, 2016 and 2018?
Question 57
Study the pie-chart which shows the sales distribution of products A, B, C, D and E of a company XYZ in 2019, and answer the question that follows.
The total number of units of products B and D sold by the company was:
Question 58
The bar graph shows the number of students enrolled for a science course in institutes A and B during 5 years from 2014 to 2018
What is the ratio of the total numbers of students enrolled in institute B in 2015 and 2017 to that of students enrolled in institute A in 2014 and 2016?
Question 59
The data given in the table shows the number of boys and girls enrolled in three different streams in a school over 5 years.
What is the ratio of the total number of boys in the year 2014 to the total number of girls in the year 2020?
Ratio of the total number of boys in the year 2014 to the total number of girls in the year 2020 = (42+42+32) : (43+30+41)
= 116 : 114
= 58 : 57
Hence, the correct answer is Option A
Question 60
The year-wise student enrollment of two schools over a period of 5 years has been presented in the following bar graph.
In which year is the difference of enrollment in the two schools, the least?
Question 61
Study the following pie chart and table and answer the question that follows. The number of people in a company working in various fields Total number of people working = 2800
Percentage of females in the company working in various fields:
The number of females working in HR is what percentage of the total number of people working in all the fields together?
Question 62
Study the pie chart and answer the question that follows.
The number of people applying for a passport from a city was monitored, and it was found that the numbers (in multiples of hundred) during the first five months of 2019 were as follows: January (M1)-248, February (M2)-134, March (M3)-162, April (M4)-94, May (M5)-72. These have been represented through the given pie chart.
The number of people in M5 is what percentage (correct up to two decimal places) of that of the two months M3 and M4 combined?
Question 63
Table shows the number of trees planted in 4 cities from 2016 to 2020.
From 2016 to 2020, how many more trees were planted in Ahmedabad as compared to trees planted in Pune?
Question 64
The following Bar Graph represents the Production of Fertilizers by Company A and Company B (in 10000 tonne) Over the Years from 2005 to 2010. The X-axis represents the years, and the Y-axis represents the Production of Fertilizers (in 10000 tonne). (Note: The data shown below is only for mathematical exercise. They do not represent the actual figures of the companies)
What is the average production (in 10000 tonne) of fertilizers in 2008, 2009 and 2010 of Company A?
Question 65
The given bar graph shows the sum invested by 4 different persons. A, B, C and D, in a bank on simple interest. Study the graph and answer the question given below.
Find the amount received by C after 3 years if the rate of interest is 8.5% p.a.
Question 66
The given Pie-Chart shows the degree wise breakup of expenditure of a family in a month. Total income of a family is ₹43,200.
Expenditure on food is what percent more than expenditure on rent?
Question 67
The given pie charts show the number of candidates who enrolled for a medical entrance examination in 2010, and those who qualified 1be examination in seven medical institutes of India. The total number of candidates who appeared for the entrance examination were 1,80,000, and those who qualified were 75,000. Study the charts carefully and answer the question that follows.
What is the ratio of the number of candidates who enrolled in institute A to the number of candidates who qualified in institute G?
Question 68
A company produced a new energy drink of three different flavours - P, Q and R - for athletes. The production of the three flavours over a period of six years from 2001 to 2006 has been expressed in the bar graph shown below. Study the graph and answer the question that follows.
What is the difference between the average production of bottles of flavour Q in 2004, 2005 and 2006 and the average production of flavour P in 2001. 2002 and 2003?
Question 69
Study the following graph that shows the number of boys and girls who appeared for the Class X examination in a school XYZ, in different years.
The total number of girls who appeared in 2012, 2013, 20 14 and 2015 is what percentage less than the total number of boys who appeared in all the five years? ( correct to one decimal place)
Question 70
Study the following pie chart and table and answer the question that follows. The number of people in a company working in various fields Total number of people working = 2800
Percentage of females in the company working in various fields:
The number of females working in the field of Design is:
Question 71
Study the following table and answer the question: Number of students Appeared (A) and Passed (P) in an annual examination from four schools Q, R, S & T in five years (2014 to 2018)
The total number of students passed from school S in 2014 and 2017 is what percent of 90% of the total number of students appeared from school T in 2015, 2016 and 2017? (correct to one decimal place)
Study the given bar graph that shows the number of students (boys and girls) in different schools on 1 July 2019 and answer the question that follows .
75% of the total number of boys in schools A and D is what percentage less than the total number of students in school E (correct to one decimal place)?
Question 73
Study the given graph and answer the question that follows.
In which year are the exports of the country 87.5% of the average imports during 2016, 2017 and 20 18?
Question 74
The pie chart shows the percentage distribution of a total of 800 employees in different departments of a company.
How many employees are working in the field of marketing?
Question 75
Study the following graph that shows the number of boys and girls who appeared for the Class X examination in a school XYZ, in different years.
The average of the number of boys who appeared in 2011, 2013 and 2015 is what percentage less than the number of girls who appeared in 2012 (correct to one decimal place)?
Question 76
Study the following table and answer the question: Number of students enrolled for Vocational Courses (VC) in five institutes - A, B, C, D & E.
The ratio of the total number of students enrolled for VC in institutes A, C and E in 2016 to the total number of students enrolled in institutes B and D in 2018, is
Question 77
Table shows District-wise data of the number of primary school teachers posted in schools of a city. Study the table and answer the question:
What is the average number of female teachers in the five districts?
Question 78
The data given in the table shows the number of students studying in 4 different disciplines in 5 institutes. Study the table and answer the question:
What is the ratio of number of students studying Science in institutes C and D taken together to the number of students studying Computer Science in institutes A and E taken together?
Number of students studying Science in institutes C and D taken together = 36 + 48 = 84
Number of students studying Computer Science in institutes A and E taken together = 57 + 55 = 112
Required ratio = 84 : 112
= 3 : 4
Hence, the correct answer is Option D
Question 79
The given bar graph shows the imports and exports (in crore 2) of steel for 5 years from 2014 to 2018.
What is the ratio of average export to average import over the five years?
Question 80
The table shows the daily income (in ₹) of 50 persons.
How many persons earn ₹200 or more but less than ₹300?
Question 81
In a factory, there are 39 workers who have been categorised into five groups (A, B, C, D, E) on the basis of the range of their daily wages (in multiples of ₹100), It is ensured that the daily wage of no worker is an exact multiple of ₹100. The distribution is presented through the given histogram.
If two Managers are engaged to supervise the workers, with daily wages ranging between ₹700 and ₹800, then what will be the average daily wage (nearest to a ₹) of all members of staff of the factory?
Question 82
In the table, production and sale (in 1000 tonnes) of a certain product of a company over 5 years is given. Study the table and answer the question.
In which year(s) sale is 80% or more but less than 90% of the production?
Percentage increase in production of 2016 compared to 2015 = $$\frac{150}{1250}\times$$100 = 12%
Percentage increase in production of 2017 compared to 2016 = $$\frac{50}{1400}\times$$100 = 3.57%
Percentage increase in production of 2018 compared to 2017 = $$\frac{50}{1450}\times$$100 = 3.44%
Percentage increase in production of 2019 compared to 2018 = $$\frac{100}{1500}\times$$100 = 6.67%
$$\therefore$$ Only in 2016, the production increases by more than 10% of that in the previous year.
Hence, the correct answer is Option D
Question 84
Study the following graph and answer question that follows.
The expenditure of the company in 2016 is what percentage more then the average revenue (per year) in 2014, 2015 and 2018 (correct to the nearest integer)?
Study the following pie chart and table and answer the question given below. The given chart represents the percentage distribution of the popu1ation of six villages A, B, C, D, E and F in 2016.
If the population below the poverty line in village D is 12408, then the population below the poverty line in village F is:
Question 86
Study the following table and answer the question: Number of students Appeared (A) and Passed (P) in an annual examination from four schools Q, R, S & T in five years (2014 to 2018)
The ratio of the total number of students appeared from school Q in 2017 and from school S$ in 2018 to the total number of students passed from school R in 2018 and school T in 2014, is:
Question 87
Study the given pie chart and answer the question that follows:
The pie chart shows the break-up of the total number of employees of a company in 2019, in five departments A, B, C, D and E.
Total number of employees = 4500
If the ratio of male employees to female employees in department A is 3:4. then the number of employees in department C is what percentage more than the number of female employees in departmnent A (nearest to an integer)?
Question 88
Study the graph and answer the question given below. The given graph represents the number of workers getting daily wages (in ₹) Total number of workers = 200
The ratio of the total number of workers whose daily wages are less than ₹500 to the total number of workers whose daily wages are ₹600 and above is:
Question 89
Study the table and answer the question. Table shows District-wise data of the number of primary school teachers posted in schools of a city.
What is the ratio of the number of male teachers to the number of female teachers in the city?
Question 90
Pie-chart shows the distribution of percentage of students in various courses. Total number of students is 1400
What is the ratio of number of girls in B.Sc. Maths to number of boys in B.Sc. C. Sci.?
Question 91
Study the following graph and answer the question that follows.
The ratio of the actual production of AC's in March and April to that of the combined target production of AC's in January and April, is:
Question 92
Study the following graph and answer the question that follows.
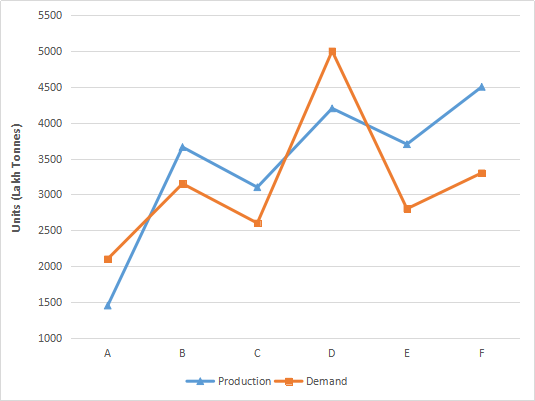
The company whose production of motorcycles is approximately 12% more than the demand is:
Question 93
Study the given bar graph that shows the number of students (boys and girls) in different schools on 1 July 2019 and answer the question that follows.
If a pie chart is drawn for the data related to the number of girls in the five schools, then the central angle (in degrees) of the sector representing the number of girls in school C will be:
Question 94
Study the given graph and answer the question that follows.
If a pie chart is drawn for the data related to the imports of the country over the 5 years, then what will be the central angle (in degrees) of the sector representing the imports in 2015?
Question 95
Table shows the number of trees planted in 4 cities from 2016 to 2020.
In which city were maximum trees planted in 2016 and 2019 taken together?
Trees planted in Chandigarh in 2016 and 2019 together = 1800 + 2440 = 4240
Trees planted in Ahmedabad in 2016 and 2019 together = 2500 + 1950 = 4450
Trees planted in Pune in 2016 and 2019 together = 1800 + 1900 = 3700
Trees planted in Kolkata in 2016 and 2019 together = 2000 + 1600 = 3600
$$\therefore$$ In Ahmedabad, maximum trees planted in 2016 and 2019 taken together
Hence, the correct answer is Option B
Question 96
The following Bar Graphs represent the Export of Tea (in lakh tonnes) by two companies A and B during the years 2010 to 2015. Study the chart and answer the question written below: (Note: The data shown below is only for mathematical exercise. They do not represent the actual figures).
What is the ratio of the total exports of company B in 2011 and 2014 to the total exports of company A in 2012 and 2015?
Question 97
A company produced a new energy drink of three different flavours - P, Q and R-for athletes. The production of the three flavours over a period of six years from 2001 to 2006 has been expressed in the bar graph shown below. Study the graph and answer the question that follows.
For which of the following years is the percentage of increase/decrease in production from the previous year the highest for flavour R?
Question 98
Bar graph shows the number of students enrolled for a vocational course in institutes A and B during 5 years from 2014 to 2018.
The total number of students enrolled in institute B during 2014, 2016 and 2018 is what percent of the total number of students enrolled in institute A during the five Years?
Question 99
Study the following bar graph that shows the number of students enrolled for different courses in institutes A and B during 5 years, and answer the question that follows.
What is the ratio of the total number of students enrolled in A during 2015 and 2018 to that of students enrolled in B during 2014 and 2015?
Question 100
Study the following graph and answer the question that follows.
The average production of motorcycles of companies A, B and C is what percentage less than the demand of motorcycles of D?
Question 101
Study the following table and answer the question: Percentage of marks obtained by six students A, B, C, D, E and in five subjects.
What are the average marks of students B, C, D and F in Math?
The average marks of students B, C, D and F in Math = $$\frac{\frac{92}{100}\times150+\frac{80}{100}\times150+\frac{74}{100}\times150+\frac{84}{100}\times150}{4}$$
Study the following table and answer the question: Number of students enrolled for Vocational Courses (VC) in institutes A, B, C, D, E & F.
The total number of students enrolled for VC in institutes D and F in 2014 is what percent of the total number of students enrolled in institutes A, B and C in 2018? (correct to one decimal point)
Study the given pie chart and answer the question that follows. Break-up of the students studying in schools A, B, C, D and E managed by a society, in 2019
The ratio of the number of boys and girls in school B is 6 : 7, and 40% of the students in school D are boys. The total number of girls in schools B and D is:
Question 104
Study the following table and answer the question: Percentage of marks obtained by six students A, B, C, D, E and in five subjects.
Total marks obtained by student in all the five subjects are ?
Question 105
Table shows income (in ₹) received by 4 employees of a company during the month of December 2020 and all their income sources.
By what percent are the Arrears of Amit and Suresh taken together less than the Arrears of Nitin and Varun taken together?
Question 106
the following Pie charts represent the distribution of candidates who were enrolled for competitive examination and the candidates (out of those enrolled) who passed the exam from five different institutes P, Q, R, S and T. Fig.(i) Total number of candidates enrolled in five different institutes = 7500
Fig.(ii) Total number of candidates passed the examination from five Institutes = 4000
What is the pass percentage for institute Q? (correct up to one decimal place.)
Question 107
The number of students taking admission in first year of a degree course at a college in areas of Social Sciences in 2012 were as follows: Economics (SI)-96, Psychology (S2)-84, History (S3)-160, Political Science (S4)-120, Sociology (S5)-125. The break-up of students in different subjects has been presented through the given pie chart.
Study the pie chart and answer the question that follows.
In 2013, 20% of the sociology students, 25% of the political science students and one-sixth of the Economics students shifted to another college, and the number of History students got increased by 10% due to students shifting from other colleges. Over and above this, 10% of the remaining sociology students and One-Seventh of the psychology students got transferred to Economics. What will be the central angle (to the nearest degree) of the sector corresponding to History in the pie chart, representing the break-up in 2013?
Question 108
Cough syrup of three different flavors - A, B and C(in lakh bottles) manufactured by a medicine company overa period of five years from 2010 to 2014 has been shown in the bar graph.
The ratio of the average production of all flavors in 2012 to the difference of the average production of flavor A in 2012, 2013 and 2014 and the average production of flavor C in 2012. 2013 and 2014 is:
Question 109
The given bar graph shows the sum invested by 4 different persons, A, B, C and D, in a bank on simple interest. Study the graph and answer the question given below.
If the amount received by B after 5 years at rate of interest R% p.a. is equal to the amount received by D after $$3\frac{1}{2}$$ years at the same rate of interest p.a., then the value of R is:
Question 110
Study the following graph that shows the number of boys and girls who appeared for the Class X examination in a school, XYZ, in different years.
The total number of girls who appeared in 2012, 2013 and 2015 is what percentage less than the total number of boys who appeared in all the five years (correct to one decimal place)?
Question 111
Study the following table and answer the question: Number of students enrolled for Vocational Courses (VC) in five institutes - A, B, C, D & E.
The total number of students enrolled for VC in institute C in 2013, 2014 and 2017 is what percent of the total number of students enrolled in all the five institutes in 2018?
Question 112
Study the following table and answer the question: Number of students enrolled for Vocational Courses (VC) in institutes A, B, C, D, E & F.
The ratio of the total number of students enrolled for VC in institutes A, C and E in 2015 to the total number of students enrolled in institutes B and D in 2017, is:
Question 113
Study the following table and answer the question: Number of students Appeared (A) and Passed (P) in an annual examination from four schools Q, R, S & T in five years (2014 to 2018)
The difference between the average number of students passed from school R in 2015 to 2017 and the number of students passed from school Q in 2015 is x. The value of x lies between:
The difference between the average number of students passed from school R in 2015 to 2017 and the number of students passed from school Q in 2015 is x.
x = 320 - ($$\frac{285+294}{2}$$)
x = 320 - 289.5
x = 30.5
x lies between 30 and 35.
Hence, the correct answer is Option C
Question 114
Study the given graph and answer the question that follows.
By what percentage were the total exports of computers by the company during 2014 to 2018 more than the total production of computers during 2014,2015 and 2018?
Question 115
Study the pie chart and answer the question that follows.
The number of people applying for a passport from a city was monitored, and it was found that the numbers (in multiples of hundred) during the first five months of 2019 were as follows: January (M1)-248, February (M2)-134, March (M3)-162, April (M4)-94, May (M5)-72. These have been represented through the given pie chart.
What is the central angle (to the nearest degree) of the sector corresponding to M1?
Question 116
Table shows the number of trees planted in 4 cities from 2016 to 2020.
In which year were the maximum number of trees planted?
Question 117
The given pie charts show the number of candidates who enrolled for a medical entrance examination in 2010, and those who qualified the examination in seven medical institutes of India. The total number of candidates who appeared for the entrance examination were 1,80,000. and those who qualified were 75,000. Study the charts carefully and answer the question that follows.
Which of the following institutes has the highest percentage of qualified candidates with respect to the number of candidates enrolled in that institute? Given that the number of candidates enrolled in institutes B, E, F and G are 18,000, 28,800, 21,600 and 16,200, respectively.
Question 118
Study the following pie chart and table and answer the question given below. The given chart represents the percentage distribution of the popu1ation of six villages A, B, C, D, E and F in 2016.
The difference in the central angles of villages B and E is:
Question 119
Study the following table and answer the question: Number of cars sold by dealers A, B, C, D & E during first six months of 2018.
In July 2018, if the sales of cars by the dealer D increases by the same percentage as in June 2018 over its previous month, then what is the number of cars sold by D in July 2018?
Question 120
Study the given pie chart and answer the question that follows.
The given chart represents the percentage-wise distribution of the total number of vanilla cakes and chocolate cakes sold on each day of the week. The total number of cakes sold in a week =10500 .
The ratio of vanilla cakes sold to chocolate cakes sold on Friday is 4 : 3. If the price of one vanilla cake is ₹8 and that of one chocolate cake is ₹7, then the total amount earned by selling all vanilla cakes and chocolate cakes on Friday is:
Question 121
Study the given pie chart and answer the question that follows.
Total Number of Employees = 300. The total number of employees in offices C and E is what percentage less that the number of employees in office A?
Question 122
Study the given pie chart and answer the question that follows. Break-up of the students studying in schools A, B, C, D and E managed by a society, in 2019
The difference between the number of students in school B and the total number of students in schools D and E is p. The value of p lies between:
Question 123
Study the histogram and answer the question given below. The given graph represents the percentage of marks scored by students in class X Board Examination in 2018 in a school.
The difference between the percentage of students who scored less than 70% marks and the percentage of students who scored 80% and above is:
Question 124
Study the pie chart and answer the question that follows.
The number of people applying for a passport from a city was monitored, and it was found that the numbers (in multiples of hundred) during the first five months of 2019 were as follows: January (M1)-248, February (M2)-134, March (M3)-162, April (M4)-94, May (M5)-72. These have been represented through the given pie chart.
If the number of people during M2 and M5 had, respectively, been 50% less and 50% more than what has been presented in the pie chart, then what would be the central angle (nearest to degrees) of the sector corresponding to M5?
Question 125
Table shows the number of trees planted in 4 cities from 2016 to 2020.
What is the total number of trees planted in Chandigarh in 2017 and in Kolkata in 2020?
Number of trees planted in Chandigarh in 2017 = 2500
Number of trees planted in Kolkata in 2020 = 1750
The total number of trees planted in Chandigarh in 2017 and in Kolkata in 2020 = 2500 + 1750
= 4250
Hence, the correct answer is Option C
Question 126
The average marks of students of section A and section B of class XI in a school have been presented in the given bar graph. Study the graph and answer the question that follows.
In how many subjects have the students of section A shown better result?
Question 127
The given bar graph represents the sales of automobiles (in ₹ crores) by five companies A, B, C, D and E in the years 2007-2008 and 2008-2009. Study the bar graph and answer the question that follows.
(Note:The data shown below is only for mathematical exercise. It does not represent the actual figures of the companies)
What should have been the sales (in ₹ crores) of company E in 2008-2009 so that it would have shown the same increase over 2007-2008 as shown by the sales of automobiles of company C during these years?
Question 128
The given pie chart shows a country's expenditure on various sports during a particular year. Study the pie chart and answer the question given below.
If the total amount spent on sports was ₹3.6 crores, then the average amount spent on hockey, cricket and basketball was:
Question 129
The given pie charts show the number of candidates who enrolled for a medical entrance examination in 2010 and those who qualified the examination in seven medical institutes of India. The total number of candidates who appeared for the entrance examination were 1,80,000, and those who qualified were 75,000. Study the charts carefully and answer the question that follows.
The combined number of candidates who qualified for institutes B and E is what percentage (correct to one place of decimal) of the combined number of candidates who enrolled for institutes C and D?
Question 130
A company produced a new energy drink of three different flavours - P, Q and R - for athletes. The production of the three flavours over a period of six years from 2001 to 2006 has been expressed in the bar graph shown below. Study the graph and answer the question that follows.
What is the percentage (correct to one decimal place) of the total production of flavour Pin 2003 and 2004 with respect to the total production of flavour R in 2001 and 2002?
Question 131
Bar graph shows the number of males and females in five organizations A, B, C, D and E.
What is the ratio of number of males working in organizations C, D and E taken together to that of females working in organizations A, B and C taken together?
Number of males working in organizations C, D and E taken together = 325 + 275 + 150 = 750
Number of females working in organizations A, B and C taken together = 300 + 275 + 250 = 825
Required ratio = 750 : 825
= 10 : 11
Hence, the correct answer is Option A
Question 132
In the table, production and sale (in 1000 tonnes) of a certain product of a company over5 years is given. Study the table and answerthe question:
In which year(s) the sale increases by more than 25% of the previous year?
Question 133
Medicines of three different flavors - A, B and C (in lakh bottles) manufactured by a pharmaceutical company over a period of five years from 2010 to 2014 is given in the bar graph.
Production of flavor A in 2012 is what percent less than the average production of flavor B in all the years (correct to 2 decimal places)?
Question 134
Study the given graph and answer the question that follows.
What is the ratio of the average number of students enrolled in college B in 2014, 2015 and 2017 to the number of students enrolled in college A in 2014?
Question 135
Study the given graph and answer the question that follows.
If 45% of the female employees in office C are transferred to office B, then the number of male employees in office E is what percentage more than the female employees in office B?
Question 136
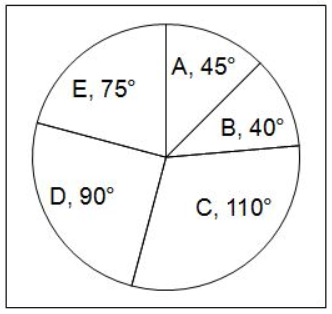
Study the given pie chart and answer the question that follows. The pie chart shows the distribution (degree-wise) of the number of players who play five sports A, B, C, D and E (assuming each player plays only one sport)
If the number of players who play sport C is 162, then the difference between the total number of players who play sport A and E is:
Question 137
Study the given pie chart and answer the question that follows:
The given pie chart shows the distribution ( degree wise) of students in a college playing different sports.
The difference between the number of students playing chess and badminton is x . The value of x lies between:
Question 138
Study the given pie chart and answer the question that follows. Break-up of the students studying in schools A, B, C, D and E managed by a society, in 2019
The average number of students in schools A, B and C is what percentage more than the number of students in school E?
Question 139
The data given in the table shows the number of boys and girls enrolled in three different streams in a school over 5 years. (2012 to 2020)
What is the difference between the average of the number of boys in the Commerce stream for the 5 years and the average of the number of girls in the Arts stream for the 5 years?
Question 140
The following graph shows the production of cotton cloth (in lakh metres) by three companies A, B and C over the years.
What is the ratio of the production of Company C in the year 1996 and 1997 to the production of Company B in the years 1999 and 2000?
Question 141
study the bar graph and answer the question that follows.
The extent of construction of new railway tracks (in km) in four railway sectors A, B, C, D during two consecutive financial years Y1 and Y2 is presented through the given bar graph.
How much is the average and track length (in km) of A, B, D during Y2 more or less than that of C in Y1 ?
Question 142
Study the following graph and answer the question that follows.
The actual production of AC's in March is what percentage more than the average target production of AC's over the period of 5 months ( correct to the nearest integer)?
Question 143
Study the following table and answer the question: Percentage of marks obtained by six students in five subjects A, B, C, D & E.
The total marks obtained by Amit in subjects A, B and C is what percent less than the total marks obtained by Vikram in subjects B, C, D and E?
Total marks obtained by Amit in subjects A, B and C = $$\frac{64}{100}\times75+\frac{65}{100}\times80+\frac{80}{100}\times100$$ = 48 + 52 + 80 = 180
Total marks obtained by Vikram in subjects B, C, D and E = $$\frac{70}{100}\times80+\frac{73}{100}\times100+\frac{84}{100}\times50+\frac{86}{100}\times150$$ = 56 + 73 + 42 + 129 = 300
Difference between number of female teachers and male teachers respectively in East district = 2375 - 1650 = 725
Difference between number of female teachers and male teachers respectively in North district = 2651 - 1075 = 1576
Difference between number of female teachers and male teachers respectively in West district = 1520 - 1280 = 240
Difference between number of female teachers and male teachers respectively in Central district = 859 - 690 = 169
In East and North districts, number of female teachers Exceed the number of male teachers by more than 500.
Hence, the correct answer is Option B
Question 147
The given graph shows the production of cotton cloth (in lakh metres) by three companies A, B and Cover the years. Study the graph and answer the question that follows.
What is the difference (in lakh metres) between increase in the production by company A from 1998 to 1999 and that by company C from 1996 to 1997?
Question 148
Study the following bar graph that shows the number of students enrolled for different courses in institutes A and B during 5 years, and answer the question that follows.
The total number of students enrolled in A during 2014 and 2016 is what percentage of the total number of average students enrolled in B during the 5 years (correct to one decimal place)?
Question 149
Study the following table and answer the question: Percentage of marks obtained by six students A, B, C, D, E and F in five subjects.
The total marks obtained by student F in English, Science and Hindi is approximately what percent of the total marks obtained by student A in English, Mathematics, Science and Hindi? (Correct to one decimal place)
The total marks obtained by student F in English, Science and Hindi = $$\frac{72}{100}\times50+\frac{60}{100}\times80+\frac{60}{100}\times75$$ = 36 + 52 + 45 = 133
The total marks obtained by student A in English, Mathematics, Science and Hindi = $$\frac{70}{100}\times50+\frac{90}{100}\times150+\frac{60}{100}\times80+\frac{64}{100}\times75$$ = 35 + 135 + 52 + 48 = 270
Study the given graph and answer the question that follows.
In 2019, the production of computers decreased from that in 2018 by the same percentage as in 2018 over its previous year, and the exports in 2019 remained the same as in 2018. What will be the difference (in thousands) between the production and exports of computers in 2019?
Question 151
The following graph shows the production of cotton cloth (in lakh metres) by three companies A,B and C over the years.
In which year the production of company C is 81.94% (correct to 2 decimal places) of the combined production of company A and company B?
Question 152
The Gupta family spends their monthly income on different heads as shown in the given pie chart. Study the chart and answer the question that follows.
By how much is the central angle of the amount spent on Misc, and House Rent taken together more than that on Household Expenditure?
Question 153
The line graph that can replace a histogram is called a/an:
Question 154
study the given pie chart and answer the question that follows.
The given chart represents the percentage-wise distribution of the total number of vanilla cakes and chocolate cakes sold on each day of the week. The total number of cakes sold in a week = 10500.
If the average number of vanilla cakes sold on Thursday and Sunday is 1020, and the number of chocolate cakes sold on Thursday is 245 more than the number of chocolate cakes sold on Sunday, then the number of chocolate cakes sold on Thursday is:
Question 155
Study the pie-chart which shows the sales distribution of products A, B, C, D and E of a company XYZ in 2019, and answer the question that follows.
In the total number of units of the products sold in 2020 is 20% more than that in 2019, and the sales distribution of all the products remain the same, then what will be the difference between the number of units of products E and D sold in 2020 ?
Question 156
The given bar graph shows the sum invested by 4 different persons, A, B, C and D, in a bank on simple interest. Study the graph and answer the question given below.
The interest received by A after 4 years at some rate of interest p.a. is ₹3840. If the rate of interest is increased by 2%, then the amount received by A after the same period is:
Question 157
The table shows the daily income (in ₹) of 50 persons. Study the table and answer the question:
What is the percentage of persons earning ₹250 or more?
Number of persons earning between ₹200 and ₹250 = 26 - 12 = 14
Number of persons earning between ₹250 and ₹300 = 34 - 26 = 8
Number of persons earning between ₹300 and ₹350 = 40 - 34 = 6
Number of persons earning between ₹350 and ₹400 = 50 - 40 = 10
Percentage of persons earning ₹250 or more = $$\frac{8+6+10}{50}\times100$$ = 48%
Hence, the correct answer is Option D
Question 158
In factory there are 39 workers who have been categorized into five groups (A, B, C, D, E) on the basis of the range of their daily wages (in multiples of ₹100). The distribution is presented through a Histogram shown below:
What is the ratio of the number of employees whose daily wages are ₹200 or more but less than ₹400 to that of the number of employees whose daily wages are ₹400 or more but less than ₹600?
The number of employees whose daily wages are ₹200 or more but less than ₹400 = 5 + 9 = 14
The number of employees whose daily wages are ₹400 or more but less than ₹600 = 12 + 11 = 23
Required ratio = 14 : 23
Hence, the correct answer is Option C
Question 159
Study the following bar graph and answer the question given below. The given bar graph represents the total number of applications received for the B.Com course by two different colleges A and B, in five different years.
The difference between the average number of applications received by college A from 2015 to 2019 and the average number of applications received by college B from 2015 to 2019 is:
Question 160
Study the given bar graph that shows the number of students (boys and girls) in different schools on 1 July 2019 and answer the question that follows.
In which school is the number of boys 25% more than the average number of girls in all five schools?
Question 161
Study the given pie chart and answer the question that follows:
The given pie chart shows the distribution ( degree wise) of students in a college playing different sports.
If the ratio of the number of male students to that of female students playing hockey is 6 : 7 and 40% of the number of students playing tennis are females. then the total number of male students playing hockey and tennis is:
Question 162
The histogram shows the weights of students of class X in a school.
Let x be the number of students whose weight is less than 50 kg and y be the number of the students whose weight is greater than or equal to 60 kg. What is the value of x : y?
Question 163
Number of male and female members in different organizations A, B, C, D and E are given in the bar graph.
What is the ratio of average number of females in all the five organizations to the average number of males in all the five organizations?
Question 164
Study the given graph and answer the question that follows.
The total exports of the country in 2014, 2016 and 2018 are what percentage more than the total imports in 2015 and 2017 (correct to one decimal place)?
Question 165
Study the given graph and answer the question that follows.
In how many years is the profit (Revenue - Expenditure) as a percentage of revenue, more than 28%?
Question 166
Table shows income(in Rs) received by 4 employees of a company during the month of December 2020 and the income sources.
Whose income from all sources except salary is more than 25% of his salary?
Question 167
The data given in the table shows the number of students studying in four different disciplines in 5 institutes. Study the table and answer the question.
Number of students studying Computer Science in the institutes A and C taken together is what percent of the number of students studying Arts in the institutes B and D taken together?
The Gupta family spends their monthly income on different heads as shows in the following chart.
What is the central angle of the combined section for House Rent and Savings?
Question 169
The pie graph shows the distribution of employees working in five departments A, B, C, D and E of a company. Total number of employees = 9000
If the number of employees working in department A is x and the total number of employees working in departments C and E is y, then the value of y - 2x is:
Number of employees working in department A = x = $$\frac{64.2^{\circ\ }}{360^{\circ\ }}\times9000$$ = 1605
x = 1605
Number of employees working in department C = $$\frac{72^{\circ\ }}{360^{\circ\ }}\times9000$$ = 1800
Number of employees working in department E = $$\frac{93^{\circ\ }}{360^{\circ\ }}\times9000$$ = 2325
The total number of employees working in departments C and E = y = 1800 + 2325 = 4125
y = 4125
y - 2x = 4125 - 2(1605) = 4125 - 3210 = 915
Hence, the correct answer is Option D
Question 170
A survey was conducted on 80 families to know about their most favourite place to visit out of 6 particular locations. The same has been shown in the following pie chart.
What is the central angle for the families who showed interest for visiting Jaipur?
Question 171
Bar graph shows the number of males and females in five organizations A, B, C, D and E.
For which organisation, difference between the number of males and the average number of females of all the organisations is minimum?
The average number of females in all the organisations = $$\frac{300+275+250+200+125}{5}$$ = $$\frac{1150}{5}$$ = 230
For Organisation A, difference between the number of males and the average number of females of all the organisations = 250 - 230 = 20
For Organisation B, difference between the number of males and the average number of females of all the organisations = 230 - 225 = 5
For Organisation C, difference between the number of males and the average number of females of all the organisations = 325 - 230 = 95
For Organisation D, difference between the number of males and the average number of females of all the organisations = 275 - 230 = 45
$$\therefore$$ For Organisation B, difference between the number of males and the average number of females of all the organisations is minimum.
Hence, the correct answer is Option D
Question 172
Study the following graph that shows the number of boys and girls who appeared for the Class X examination in a school XYZ, in different years.
What is the ratio of the total number of girls who appeared in 2012 and 2015 to the total number of boys who appeared for the class X examination in 2012 and 2013?
Question 173
Study the following table and answer the question: Number of cars sold by dealers A, B, C, D & E during first six months of 2018.
The average number of cars sold by dealer C in February. April and May exceeds the number of cars sold by the dealer E in January by x . The value of x lies between
Question 174
The data given in the table shows the number of students studying in four different disciplines in 5 institutes. Study the table and answer the question:
By what percent is the number of students studying Computer Science in institutes A and B more than the number of students studying Arts in institutes B and C?
Question 175
The following Pie chart represents the percentage-wise distribution of 300 students of class X in a schoolin six different sections A, B, C, D, E and F.
The table given below shows the number of boys of class X in six different sections A, B, C, D, E and F.
If in section E, the ratio of the number of boys to the number of girls is 3 : 4, then the ratio of number of boys in section E to the number of girls in section is :
Question 176
The following pie charts represent the distribution of candidates who were enrolled for a competitive examination, and the candidates (out of those enrolled) who passed the exam from five different institutes P, Q, R, S and T.
What is the ratio of the total number of candidates enrolled in institutes Q, R and S together, to the number of candidates passed from the institutes Q, R and S together?
Question 177
The given pie chart shows a country's expenditure on various sports during a particular year. Study the pie chart and answer the question given below.
If the total amount spent on sports in the year was ₹4.2 crores, then the amount spent on football and hockey together was:
Question 178
Study the following graph and answer the question that follows.
What is the total ratio of the revenue of the company in 2016 and 2018 to that of the total expenditure in 2015 and 2017 respectively?
Total revenue of the company in 2016 and 2018 = 340 + 375 = 715
Total expenditure of the company in 2015 and 2017 = 250 + 275 = 525
Required Ratio = 715 : 525
i.e; 143 : 105
Hence, option A is correct.
Question 179
Study the following graph and answer the question that follows.
The total production of motorcycles of companies B and E is what percentage of the demand of motorcycles of all the companies taken together?
Question 180
Study the given graph and answer the question that follows.
The total number of female employees of the company in offices B, D and E is what percentage less than the total number of male employees in offices A, B, C and E ( correct to one decimal place)?
Question 181
The given Pie-Chart shows the degree wise breakup of expenditure of a family in a month. Total income of a family is ₹43200.
The amount spent on food is what percent of the savings and miscellaneous expenses?
Question 182
Study the following bar graph and answer the question given below. The given bar graph represents the total number of applications received for the B.Com course by two different colleges A and B, in five different years.
The ratio of the total number of applications received by college A in 2016 and 2017 together to the total number of application received by college B in 2016 and 2017 together is:
Question 183
Study the following pie chart and table and answer the question given below. The given chart represents the percentage distribution of the population of six villages A, B, C, D, E and F in 2016.
If the population below the poverty line in village A is 42000, then the population above the poverty line in village A is:
Question 184
Study the following pie chart and table and answer the question given that follows. image The number of people in a company working in various fields Total number of people working= 2800
Percentage of females in the company working in various fields:
The total number of males working in the fields of Sales and IT is:
Question 185
Study the following table and answer the question: Number of students enrolled for Vocational Courses (VC) in institutes A, B, C. D, E & F.
The total number of students enrolled for VC in institutes B, C and E in 2015 is x %more than the total number of students enrolled in institutes A, D and F in 2016. The value of x is closest to:
Question 186
Study the following table and answer the question: Number of cars sold by dealers A, B, C, D & E during first six months of 2018.
80% the total number of cars sold by dealers B and E in April is what percent less than the total number of cars sold by the dealers C and D in February?
Question 187
Study the given pie chart and answer the question that follows.
Total Number of Employees = 300. In which office is the number of employees approximately 18% moore than the average number of employees working in offices A, C, D and E?
Question 188
Study the table and answer the question. The table shows the daily income of 50 persons.
How many persons earn ₹250 or more but less than ₹350 daily?
The ratio of salary of Varun to his income other than salary = 42000 : (7500+1240+1500)
= 42000 : 10240
= 525 : 128
Hence, the correct answer is Option D
Question 190
The following Pie chart represents the percentage-wise distribution of 800 students of class XII in a school in six different sections A, B, C, D, E and F.
The table given below shows the number of girls of class XII in six different sections A, B, C, D, E and F.
The total number of girls in sections B, C and D together is what percent more than the total number of boys in sections A, B and D together?
The number of teachers and students in five school A, B, C, D and E in a city has been depicted through the given bar graph, where the number of students has been presented as multiples of ten. Study the bar graph and answer the question that follows.
If 20% of the student of E get transferred such that they get equally distributed among A and C, and 10% of their teachers are transferred to A, then which among the following schools will have its student to teacher ratio closest to that of D?
Question 192
Bar graph shows the number of students enrolled for a vocational course in institutes A and B during 5 years.
The average number of students enrolled in institute A during 2014, 2016 and 2018 is what percent less than the number of students enrolled in institute B during 2017 (correct to two decimal places)?
Question 193
Study the following table and answer the question: Percentage of marks obtained by six students A, B, C, D, E and F in five subjects.
The total marks obtained by students C, D and F in Science is what percent more than the total marks obtained by B in Science, Hindi and Social Studies?
Question 194
Study the histogram and answer the question given below. The given graph represents the percentage of marks scored by students in class X Board Examination in 2018 in a school.
The ratio of the number of students who scored marks less than 60% to the number of students who scored marks 80% and above is:
Question 195
The following bar graph shows the amount(in Lakh Rs.) invested by a Company in purchasing raw material over the years and the values (in Lakh Rs.) of finished goods sold by the Company over the years.
The ratio of total amount invested for purchasing raw material from 2013 to 2015 to the total sales of finished goods in 2014, 2016 and 2017 is:
Total amount invested for purchasing raw material from 2013 to 2015 = 250 + 350 + 325 = 925
The total sales of finished goods in 2014, 2016 and 2017 = 475 + 600 + 525 = 1600
Required ratio = 925 : 1600
= 37 : 64
Hence, the correct answer is Option D
Question 196
The given pie chart shows a country's expenditure on various sports during a particular year. study the pie chart and answer the question given below.
If the total amount spent on sports in the year was ₹2.4 crores, then the amount spent on tennis and basketball together is what percentage less than the amount spent on golf and football together?
Question 197
The number of teachers and students in five school A, B, C, D and E in a city has been depicted through the given bar graph, where the number of students has been presented as multiples of ten. Study the bar graph and answer the question that follows.
Which school among the following as the higest teacher to student ratio?
Question 198
Sntdy the graph and answer the question given below. The given graph represents the number of workers getting daily wages (in ₹). Total number of workers = 200
What is the difference between the percentage of workers whose daily wages are less than ₹500 and the percentage of workers whose daily wages are ₹600 and above?
Question 199
Study the following bar graph that shows the number of students enrolled for different courses in institutes A and B during 5 years, and answer the question that follows.
The average number of students (per year) enrolled in A during 2015,2016 and 2018 is what percentage less than the number of students enrolled in B during 2015 (correct to one decimal place)?
Question 200
Study the given pie chart and answer the question that follows.
Total Number of Employees = 300. In office A, 40% of employees are females and 60% employees in office C are males. What is the ratio of the number of male employees in A to that of female employees in C?
Question 201
Study the given pie chart and answer the question that follows:
The pie chart shows the break-up of the total number of employees of a company in 2019, in five departments A, B, C, D and E.
Total number of employees - 4500
The average number of employees of the company in departments D and E is what percentage of the number of employees in department A (correct to one decimal place)?
Question 202
Study the histogram and answer the question given below. The given graph represents the percentage of marks scored by students in class X Board Examination in 2018 in a school.
The number of students who scored less than 60% marks is approximately what percentage less than the number of students who scored 70% and above?
Question 203
The bar graph given below shows the sales of Newspapers (in lakh number) from six branches of a Media Publication Company during two consecutive years 2017 and 2018. (Note: The data shown below is only for mathematical exercise. They do not represent the actual figures).
Total Sales of U for both the years is what percent (correct to one place of decimal) of the combined Sales of the branches Q and R for 2017 and 2018?
The following bar graph shows the demand and production (in Lakhs) of motor cycles of five different companies A, B, C, D and in 2020.
What is the ratio of total production of motor cycles of companies A, B, C, D and E, to that of the total demand of motorcycles of all the companies during the five years?
Question 205
The following table shows the daily seats occupancy in different classes of a train. Numbers in bracket represent the total seats available for a particular class.
What is the ratio of number of seats that remained vacant in all the Non-AC classes on Wednesday and Thursday taken together to number of seats remained vacant in AC classes on Monday, Tuesday and Friday?
Number of seats that remained vacant in all the Non-AC classes on Wednesday = (900 - 830) + (500 - 390) = 180
Number of seats that remained vacant in all the Non-AC classes on Wednesday = (900 - 790) + (500 - 480) = 130
Number of seats that remained vacant in AC classes on Monday = (500 - 480) + (250 - 240) + (150 - 145) = 35
Number of seats that remained vacant in AC classes on Tuesday = (500 - 450) + (250 - 230) + (150 - 120) = 100
Number of seats that remained vacant in AC classes on Friday = (500 - 500) + (250 - 210) + (150 - 130) = 60
Required ratio = (180 + 130) : (35 + 100 + 60)
= 310 : 195
= 62 : 39
Hence, the correct answer is Option D
Question 206
The given bar graph represents the sales of automobiles (in ₹ crores) by five companies A, B, C, D and E in the years 2007-2008 and 2008-2009. Study the bar graph and answer the question that follows.
(Note : The data shown below is only for mathematical exercise. It does not represent the actual figures of the companies)
What is the percentage difference (correct to two places of decimals) of the combined sales of the five companies in 2008-2009 compared to the combined sales of the five companies in 2007-2008?
Question 207
The number of students taking admission in first year of a degree course at a college in areas of Social Sciences in 2012 were as follows: Economics (SI)-96, Psychology (S2)-84, History (S3)-160, Political Science (S4)-120, Sociology (S5)-125. The break-up of students in different subjects has been presented through the given pie chart.
Study the pie chart and answer the question that follows.
The total number of students in Economics and psychology is what percentage of the total number of students in history, Political Science and Sociology (correct to two decimal places)?
Question 208
The record of the enrollment of boys and girls in a school over 6 years has been presented in following bar graph.
In which year was the total enrollment the minimum?
Instructions
Study the following table and answer the question: Number of students enrolled for Vocational Courses (VC) in five institutes - A, B, C, D & E.
Question 209
What is the sum of the average number of students enrolled for VC in institute B in 2014, 2015 and 2017 and the average number of students enrolled in institute E in 2013 and 2018?
Average number of students enrolled for VC in institute B in 2014, 2015 and 2017 = $$\frac{132+138+135}{3}$$
= $$\frac{405}{3}$$
= 135
Average number of students enrolled in institute E in 2013 and 2018 = $$\frac{105+145}{2}$$
= $$\frac{250}{2}$$
= 125
Required sum = 135 + 125
= 260
Hence, the correct answer is Option C
Question 210
The total number of students enrolled for VC in institutes A, B and D in 2015 is what percent more than the total number of students enrolled in institutes C and E in 2018? (correct to one decimal point)
The number of neon lamps having life of 600 hours or more but less than 800 hours is what percentage of the total number of neon lamps having a life of 800 hours or more?
Total expenditure in 2015 and 2016 = 210 + 350 = 560
Total revenue of the company in 2016 and 2018 = 320 + 380 = 700
=> Required ratio = $$\frac{560}{700}=4:5$$
=> Ans - (A)
Question 3
Study the pie-chart and answer the question.
If 50% of the employees in office E are transferred to office D, then what percentage of the total number of employees of the company is the number of employees in office D?
The number of workers whose age is 32 years or more but less than 44 years
= 85 + 70 + 75 = 230
=> Ans - (D)
Question 5
The given pie-chart represents the distribution of the percentage of sales of a particular brand of car from five showrooms A, B, C, D and E during 2018. The total number of cars sold during that year from the five showrooms is 5000.
What is the total number of cars sold from the show rooms B and D?
Total imports in 2014, 2016 and 2017 of the country = 410 + 375 + 425 = 1210
Total exports in 2015 and 2016 = 560 + 540 = 1100
The ratio of total imports in 2014, 2016 and 2017 of the country to the total exports in 2015 and 2016 = 1210 : 1100 = 11 : 10
Question 7
The given pie-chart represents the distribution of the percentage of sales of a particular brand of car from five showrooms A, B, C, D and E during 2018. The total number of cars sold during that year from the five showrooms is 5000.
What is the central angle (nearest to 0.1 degree) of the sector corresponding to the sales from the showroom C?
Two different finance companies declare a fixed annual rate of interest on the amount invested by investors with them. The interest rate declared by these companies can vary from year to year depending on the variation in the country's economy and the interest rate of the banks. The annual rate of interest offered by the two companies P and Q is shown in the graph below. Study the graph and answer the question. Annual percentage rate of interest offered by two finance companies P and Q over the years.
A sum of ₹3.5 lakhs was invested in company Q in the year 2000 for one year. How much more simple interest will accrue if the amount was invested in company P?
then we can say x is lies between 440 and 460 from given option Ans
Question 10
Study the given graph and answer the question that follows.
Total expenditure of the company in 2016, 2017 and 2018 is what percentage less than the total revenue in the given five years (correct to one decimal place)?
Production of wheat in the state A, B, and E = 500+375+475 = 1350
Production of rice in the state C, D, and E = 575+400+525 = 1500
In % less of A,B and E from C, D and E =$$ \dfrac {1500-1350}{1500} \times 100 $$
$$\Rightarrow \dfrac{150}{1500}\times 100 $$
$$\Rightarrow 10 $$ % Ans
Question 14
The pie-chart given here shows the country's expenditure on various sports during a particular year. Study the pie-chart and answer the question given below.
If the total amount spent on sports in the year was ₹1,80,00,000, then the amount spent on tennis is more than the expenditure on golf by:
Study the given graph and answer the question that follows.
What is the ratio of the number of workers in the company whose age is 28 years or more but less than 40 years to the number of workers whose age is 40 years or more but less than 52 years?
Number of workers in the company whose age is 28 years or more but less than 40 years = 90 + 85 + 70 = 245
Number of workers whose age is 40 years or more but less than 52 years = 75 + 80 + 55 = 210
=> Required ratio = $$\frac{245}{210}=7:6$$
=> Ans - (A)
Question 16
Study the graph and answer the question.
The ratio of the total production of rice in states C and to the total production of wheat in states B and is ......
Question 17
Study the graph and answer question.
By what percentage are the total imports of the country in 2016 and 2017 less than the total exports in 2014, 2015 and 2018? (Your answer should be correct to one decimal place)
Study the given pie chart and answer the question that follows. Break-up (degree-wise) of the number of students in five schools (A, B, C, D and E)in a city.
Total number of students = 5200 The number of students in school C is what percentage more than the number of students in school B?
so $$12.5 \times x = 100 $$ (according to question)
$$\Rightarrow x $$ = 8 Ans
Question 21
Study the graph and answer the question.
The number of workers in the factory whose weekly earnings are below ₹7,000 is what percentage more than the Number of workers whose weekly earnings are ₹7,000 or above but less than ₹8,500?
Number of workers in the company, whose weekly earning below to 7000Rs =60+85+95+105=345 Number of workers in the company whose weekly earning 7000Rs or above but less than 8500Rs =90+80+70=240 hence the required percentage $$\dfrac{(345-240)\times 100}{240}=43.75\%$$
Question 22
Study the given graph and answer the question that follows.
In how many years was the revenue of the company more than 1.2 times the average expenditure over the given five years?
The total degree D and E =$$ 118.8^{\circ} + 61.2^{\circ} = 180^{\circ}$$
so student of D and E = $$\dfrac{180}{360}\times 9000 $$
$$\Rightarrow 4500 $$
again total degree of B and C =$$ 64.8 ^{\circ}+79.2^{\circ}= 144^{\circ}$$
so student of B and C = $$\dfrac {144}{360} \times 9000$$
$$\Rightarrow 3600 $$
% more than total number of students B and C = $$\dfrac{4500-3600}{3600}\times 100 $$
$$\Rightarrow \dfrac{900}{3600}\times 100$$
$$\Rightarrow 25 $$ % Ans
Question 24
Study the graph and answer the question.
What percentage of total number of workers in the factory is the number of workers whose weekly earnings are ₹6,500 or above but less than ₹8,500? (Your answer should be correct to one decimal place.)
Total number of the employee, whose salary is greater than 6500 but less than 8500Rs $$=105+90+80+70=345$$ Total number of employee$$=60+85+95+105+90+80+70+65+50=700$$
Hence, the required percentage $$\dfrac{345\times 100}{700}=49.3\%$$
Question 25
The pie-chart given here shows the country's expenditure on various sports during a particular year. Study the pie-chart and answer the question given below.
The expenditure on hockey is what percent more than that of basketball?
Number of neon lamps having a life of 900 hours or more = 70 + 55 + 35 = 160
Number of lamps having life less than 700 hours = 45 + 60 + 75 = 180
=> Required ratio = $$\frac{160}{180}=8:9$$
=> Ans - (B)
Question 27
The following pie-chart and table show the percentage distribution of farmers in 5 states A, B, C, D & E of a country who claimed insurance due to drought in the year 2017 and ratio of males to females of the number of farmers in states, respectively. Study the pie-chart and the table carefully and answer the following questions. Note: Some data are missing in the pie-chart and table, if required in any question, find the missing data first and then answer the question. Total number of farmers who claimed insurance in the year 2017 = 2,64,000
The number of farmers who claimed insurance in state C exceeds the total number of farmers (who claimed insurance)in state E and state A together by 5280. What is the percentage of farmers who claimed insurance in state E?
total expenditure on salary and interest on loans=20x+17.5x=37.5x
total expenditure on infrastructure= 20x
total expenditure on transport =12.5x
total expenditure on infrastructure and transport=20x+12.5x=32.5x reqiured ratio=37.5x:32.5x
=15:13
Question 29
Study the given graph and answer the question that follows.
If 60% of the total number of students obtaining 50 marks or more but less than 70 marks are girls and 55% of the total number of students obtaining 70 marks or more but less than 90 marks are also girls, then the total number of girls obtaining 50 marks or more but less than 90 marks is:
Total number of the employee in the office C $$=\dfrac{54\times 9200}{360}=3\times 460=1380$$
Total number of employee in the office D $$=\dfrac{57.6\times 9200}{360}=1472$$
Total number of employee in office B $$=\dfrac{82.8\times 9200}{360}=2116$$
Hence, the required value of $$(1380+1472)-2116=736$$
Hence option B is the correct answer.
Question 32
The pie-chart given here shows the country's expenditure on various sports during a particular year. Study the pie-chart and answer the question given below.
If the total amount spent on sports in the year was ₹2,40,00,000, then the amount spent on cricket and football together was:
Newspaper P in city B,, D, E = 560+ 750 + 550 = 1860
again newspaper Q in city A, C,D, E = 450+650+680+620 = 2400
% les compaired with Newspaper Q = $$\dfrac {2400-1860}{2400}\times 100$$
$$\Rightarrow 22.5 $$ % Ans
Question 34
Out of the two bar graphs provided below, one shows the amounts (₹ in Lakhs) invested by a company in purchasing raw materials over the years and the other shows the values (₹ in Lakhs)of finished goods sold by the company over the years.
What was the difference between the average amount invested in raw materials during 1997 to 2000 and the average value of sales of finished goods during the same period 1997 to 2000?
Average amount invested in raw materials during 1997 to 2000 = $$\frac{(375+330+525+420)}{4}$$
= $$\frac{1650}{4}=412.5$$ lakhs
Average value of sales of finished goods during the same period 1997 to 2000 = $$\frac{(500+400+600+460)}{4}$$
= $$\frac{1960}{4}=490$$ lakhs
=> Required difference = $$490-412.5=77.5$$ lakhs
=> Ans - (C)
Question 35
Study the given graph and answer the question that follows.
The number of workers whose age is 36 years or more but less than 48 years is what percentage more than the number of workers whose age is less than 28 years (correct to one decimal point)?
Study the given graph and answer the question that follows.
The total number of students obtaining less than 50 marks is what percentage more than the total number of students obtaining 60 marks or more (correct to one decimal place).
Two different finance companies declare a fixed annual rate of interest on the amount invested by investors with them. The interest rate declared by these companies can vary from year to year depending on the variation in the country's economy and the interest rate of the banks. The annual rate of interest offered by the two companies P and Q is shown in the graph below. Study the graph and answer the question. Annual percentage rate of interest offered by two finance companies P and Q over the years.
If two sums in the ratio 9 : 10 are invested in companies P and Q respectively in 1999, then what is the ratio of the simple interests received from companies P and Q respectively after one year?
For companies P in 1999 = $$\dfrac {9x \times 10 \times 1}{100}$$
form companies Q in 1999= $$ \dfrac {10x \times 8 \times 1}{100} $$
then the ratios $$\dfrac { \dfrac {9x \times 10 \times 1}{100}} {\dfrac {10x \times 8 \times 1}{100}} $$
$$\Rightarrow 9 : 8 $$ Ans
Question 39
Study the pie-chart and answer the question. Distribution (degree-wise) of the number of employees of a company working in 5 departments A, B, C, D and E.
The number of employees working in department C is what percentage more than the total number of employees working in D and E? (Your answer should be correct to one decimal place.)
The frequency 10 belongs to the category of 20.5 to 30.5 runs.
=> Ans - (B)
Question 43
Study the pie-chart and answer the question:
Total Number of Employees =1400
The total number of employees of the company working in production and IT department exceeds the total number of employees working in the Marketing and Accounts departments by ........
The number of employees of the company working in production department = 1400 $$\times \frac{111.6}{360} = 434$$
The number of employees of the company working in IT department = 1400 $$\times \frac{72}{360} = 280$$
The total number of employees of the company working in production and IT department = 434 + 280 = 714
The number of employees of the company working in Marketing department = 1400 $$\times \frac{86.4}{360} = 336$$
The number of employees of the company working in Accounts department = 1400 $$\times \frac{57.6}{360} = 224$$
The total number of employees of the company working in Marketing and Accounts department = 336 + 224 = 560
Require number = 714 - 560 = 154
Question 44
Study the given pie chart and answer the question that follows.
If the ratio of the number of boys to that of girls in school C is 6 : 5 and that in school B is 7 : 11, then what is the ratio of the number of boys in school C to the number of girls in school B?
If 80% of the number of employees working in the IT department and 40% of the number of employees working in both the HR and Accounts departments are females, then total number of female employees working in these three departments is .........
The number of employees working in the IT department = $$1400 \times \frac{72}{360} = 280$$
Number of females in the IT department = $$280 \times \frac{80}{100} = 224$$
The number of employees working in both the HR and Accounts departments = $$1400 \times \frac{(32.4 + 57.6)}{360} = 1400 \times \frac{90}{360} = 350$$
Number of females in both the HR and Accounts departments = $$350 \times \frac{40}{100} = 140$$
Total number of female employees working in these three departments = 224 + 140 = 364
Question 48
The given bar chart represents the average marks obtained in English (E) and vernacular (V) by the students of five districts (D1, D2, D3, D4, D5)in a state at the secondary level examination of a particular year (marks secured out of a total of 100).
What is the average percentage of marks in English of the five districts?
From the given graph add number of student interval
20-30, 30-40, 40-50 , 50-60
in the graph 20-30 value 78, 30-40 value 110 , 40-50 value 142, 50-60 value 150
then add 78 + 110 +142 + 150 = 480 Ans
Question 51
Study the graph and answer the question:
The number of families whose monthly expenditures on education are ₹2,500 or more but below ₹4,000 is what percentage more than the number of families whose monthly expenditures on education are ₹4,500 or more but below ₹6,000?
The number of employees of the company working in the Marketing department is what percentage more than the number of employees working in the IT department?
The number of employees in the Marketing department = 1400 $$\times \frac{86.4}{360} = 336$$
The number of employees in the IT department = 1400 $$\times \frac{72}{360} = 280$$
Required percentage = $$\frac{\text{employees in the Marketing department - employees in the IT department}}{\text{employees in the IT department}} \times 100$$
= $$\frac{336 - 280}{280} \times 100$$ = 20%
Question 54
The given bar chart presents the average marks obtained in English (E) and vernacular (V) by the students of five districts (D1, D2, D3, D4, D5)in a state at the secondary level examination of a particular year (marks secured out of a total of 100).
What is the difference between the average percentage of marks in vernacular of the districts (D1, D2, D4) and (D3, D5)?
Average percentage of marks in vernacular of the districts (D1, D2, D4) = $$\frac{(80+70+75)}{3}=\frac{225}{3}=75$$
Average percentage of marks in vernacular of the districts (D3, D5) = $$\frac{(50+55)}{2}=\frac{105}{2}=52.5$$
=> Required difference = $$75-52.5=22.5\%$$
=> Ans - (D)
Question 55
Study the pie-chart and answer the question. Distribution(Degree-wise)of the number of the employees of a company working in 5 departments A,B,C,D and E
If the ratio of male employees and female employees working in department D is 4 : 5 and that in department E is 9: 11, then what is the ratio of the total male employees in D and E to the number of employees in B?
so employee in B = $$ 3200 \times \dfrac {57.8}{360} = 512 $$
now, employee in D = $$3200 \times \dfrac{36}{360} = 576 $$
employee in E = $$3200 \times \dfrac{36}{360} = 320 $$
Now male Employee in D and E = $$ 576 \times \dfrac{4}{9} + 320 \times \dfrac{9}{20} $$( from ratio method)
$$\Rightarrow 256 + 144 $$
$$\Rightarrow 400 $$
then required ratio = 400: 512
$$\Rightarrow 25:32 Ans
Question 56
Study the pie-chart and answer the question.
The total number of employees of the company in offices D and E is what percentage more than the number of employees in office A? (Your answer should be correct to one decimal place.)
Total number of employee in the office D $$=\dfrac{9200\times 57.6^\circ}{360}=1656$$
Total number of employee in the office E $$=\dfrac{9200\times 64.8^\circ}{360}=1472$$
Total number of employee in the office A $$=\dfrac{9200\times 100.8^\circ}{360}=2576$$
Hence, the required percentage $$=\dfrac{(1656+1472-2576)\times 100}{2576} =21.4\%$$
Question 57
Study the pie chart and answer the question. Distribution (degree wise) of the number of computers sold by a shopkeeper during five months.
The total number of computers sold in February and April is what percentage more than the number of computers sold in May? (Your answer should be correct to one decimal place.)
then total computers in February + April = 675 + 810 = 1485
so % more than computers = $$\dfrac{ 1485- 1155}{1155}\times 100$$
$$\Rightarrow \dfrac{330}{1155} \times 100 $$
$$\Rightarrow 28.6 $$ Ans
Question 58
Study the graph and answer the question.
The number of workers in the factory whose daily wages are ₹500 or more but less than ₹650 is what percentage more than the number of workers whose daily wages are ₹650 or more but less than ₹750? (Your answer should be correct to one decimal place.)
Question 59
Two different finance companies declare a fixed annual rate of interest on the amount invested by investors with them. The interest rate declared by these companies can vary from year to year depending on the variation in the country's economy and the interest rate of the banks. The annual rate of interest offered by the two companies P and Q is shown in the graph below. Study the graph and answer the question. Annual percentage rate of interest offered by two finance companies P and Q over the years.
An investor invested a sum of ₹4 lakhs in company in the year 2000. After one year, the entire amount was transferred to company P in 2001 as an investment for one year. What amount will the investor receive from company P?
The ratio of the number of workers in the factory whose daily wages are below ₹600 to the number of workers whose daily wages are more than ₹650 but less than ₹800 is ........
Question 61
Study the bar graph and answer the question.
The number of neon lamps having a life of 500 hours or more but less than 800 hours is:
Number of students which have a height of 165 cm or more = total student - less than 165 = 40 - 25 = 15
Question 63
The given table represents the production of different types of motorcycles (in thousands)over a period of six years. Study the table carefully and answer the question that follows.
During 2015, the production of which type of motorcycle was more than 25% of the total production of all types of motorcycles in 2017?
Total number of students scoring 40 or more but less than 70 = 31 + 38 + 46 = 115
Total number of students = 12 + 19 + 22 + 31 + 38 + 46 + 50 = 218
Percentage of students scoring 40 or more but less than 70 = $$\frac{115}{218} \times 100 = 52.75
Question 65
The following Table gives the details of Five commodities A, B, C, D and E with quantity required and their costs for a family in a month. Study the Table and answer the questions that follow.
The total amount spent on the Five commodities by the family in the year 2019 is:
Amount spent on the commodity A by the family in the year 2019 = 80 x 15 = ₹1200
₹Amount spent on the commodity B by the family in the year 2019 = 60 x 20 = 1200
Amount spent on the commodity C by the family in the year 2019 = 40 x 12 = ₹480
Amount spent on the commodity D by the family in the year 2019 = 85 x 40 = ₹3400
Amount spent on the commodity E by the family in the year 2019 = 72 x 8 = ₹576
$$\therefore\ $$The total amount spent on the Five commodities by the family in the year 2019 = 1200 + 1200 + 480 + 3400 + 576 = ₹6,856
Hence, the correct answer is Option B
Question 66
The given table represents the exports (in ₹crores) of four items A, B, C and D over a period of six years. Study the table and answer the question that follows.
In which year, the exports of item D were 1.4 times the average exports of item B during six years?
Average exports of item B during six years = $$\frac{128 + 134 + 138 + 169 + 182 + 209}{6}
(Average = sum of the terms/no. of terms)
= 960/6 = 160
1.4 times the average exports of item B during six years = 1.4 $$\times$$160 = 224
In year 2013, the exports of item D were 1.4 times the average exports of item B during six years.
Question 67
The given table represents the revenue (in ₹ crores) of a company from the sale of four products A. B. C and D in 6 years. Study the table carefully and answer the question that follows.
The number of years in which the revenue of the company from the sale of product D is more than the average revenue from the sale of product A over six years, is:
The number of years in which the revenue of the company from the sale of product D is more than the average revenue from the sale of product A over six years = 2
(In the year 2013 and 2014)
Question 68
The given table shows the number (in thousands) of cars of five different models A, B, C, D and E produced during Years 2012-2017. Study the table and answer the question that follow.
If 2013 and 2014 are put together, which type of cars constitute exactly 25% of the total number of cars produced in those 2 years?
The total number of cars produced in 2013 and 2014 = 130 + 170 = 300
25% of the total number of cars produced in 2013 and 2014 = 300 $$\times \frac{25}{100}$$ = 75
Production of A type of cars = 22 + 32 = 54 Production of B type of cars = 18 + 43 = 61 Production of C type of cars = 32 + 26 = 58 Production of D type of cars = 40 + 35 = 75 Production of E type of cars = 18 + 34 = 52
$$\therefore$$ D type of cars constitute exactly 25% of the total number of cars produced in 2013 and 2014.
Question 69
The following table represents the number of candidates that appeared and qualified in a competitive examination from different states over five years. Study the table and answer the questions that follow.
The total number of candidates that qualified from all the states together in 1998 is approximately what percentage of the total number of candidates that qualified from all the states together in 2001? (Correct to Two decimal points)
Number of girls studying in all other streams = 18 + 42 + 30 = 90
The ratio of the number of girls studying Arts to the number of girls studying in all other streams = 45 : 90 = 1 : 2
Question 71
The given table represents the number of computers sold by four dealers A, B, C and D during the first six months of 2016. Study the table carefully and answer the question that follows.
The total number of computers sold by dealer A during February to June is what percentage more than the total number of computers sold byall the dealers in June? (Correct to one decimal place)
The given table represents the number of engineers recruited by four companies A, B, C and D over the years. Study the table carefully and answer the question that follows.
The ratio of the total number of engineers recruited by companies A and B in 2015 and 2018 to the total number of engineers recruited by C and D in 2014 and 2018,is:
Total number of engineers recruited by companies A and B in 2015 and 2018 = 132 + 118 + 148 + 112 = 510
Total number of engineers recruited by C and D in 2014 and 2018 = 85 + 105 + 105 + 125 = 420
The ratio of the total number of engineers recruited by companies A and B in 2015 and 2018 to the total number of engineers recruited by C and D in 2014 and 2018 = 510 : 420 = 17 : 14
Question 73
In a school, the distribution of teachers is as follows:
The total number of teachers of age less than 40 years is:
Number of workers earn less than ₹1,100 in a day = 4 + 15 + 10 + 10 = 39
Question 76
The given table shows the number (in thousands)of cars of five different models A, B. C, D and E produced during Years 2012-2017. Study the table and answer the question that follow.
The percentage decrease in the production of which type of car in 2017, with reference to 2016, was the maximum?
The percentage decrease in the production of A type of car in 2017, with reference to 2016 = $$\frac{36 - 12}{36} \times 100 = \frac{24}{36} \times 100 = 66.66%
B type of car have increments in the production in 2017, with reference to 2016.
The percentage decrease in the production of C type of car in 2017, with reference to 2016 = $$\frac{44 - 40}{44} \times 100 = \frac{4}{44} \times 100 = 9.09%
The percentage decrease in the production of D type of car in 2017, with reference to 2016 = $$\frac{38 - 22}{38} \times 100 = \frac{16}{38} \times 100 = 42.1%
The percentage decrease in the production of E type of car in 2017, with reference to 2016 = $$\frac{50 - 28}{50} \times 100 = \frac{22}{50} \times 100 = 44%
A type of car have maximum decrements in the production in 2017, with reference to 2016.
Question 77
The following table shows the number of employees working in various departments of an organisation from 2016 to 2019.
In which year were the maximum number of employees working in the organization?
The given table represents the number of engineers recruited by four companies A, B, C and D over the years. Study the table carefully and answer the question that follows.
The number of the years in which the number of engineers recruited by company D is less than the average number of engineers recruited by B in the given six years,is:
Sum of the number of engineers recruited by B in the given six years = 90 + 119 + 98 + 106 + 112 + 118 = 643
Average number of engineers recruited by B in the given six years = 643/6 = 107.16
$$\therefore$$ 3 years (2014, 2015, 2016) in which the number of engineers recruited by company D is less than the average number of engineers recruited by B in the given six years
Question 82
The given table represents the revenue (in ₹ crores) of a company from the sale of four products A. B. C and D in 6 years. Study the table carefully and answer the question that follows.
The total revenue of the company from the sale of products B, C and D in 2014 is what percentage of the total revenue from the sale of products C and D in 6 years?
Total number of boys = 18 + 47 + 40 + 30 = 135 Total number of girls = 35 + 25 + 45 + 10 = 115
The ratio of the total number of boys to that of girls in the college = 135 : 115 = 27 : 23
Question 86
The following table gives the details of Five commodities A, B, C, D and E with quantity required and their costs for a family in a month. Study the table and answer the questions that follow.
The percentage of increase(per kg) in the rate of commodity D from 2016 to 2019 is:
The percentage of increase(per kg) in the rate of commodity D from 2016 to 2019 = $$\frac{85 - 75}{75} \times 100 = \frac{10}{75} \times 100 = 13.33%$$
Question 87
The following table shows the percentage distribution of the population of five states, A, B, C, D and E on the basis of the poverty line and also on the basis of sex.
If the male population above the poverty line for State B is 2.5 million, then what is the total population of State B?
The percentage growth of maize in the year 2019 over the year 2015 = $$\frac{840 - 490}{490} \times 100 = \frac{350}{490} \times 100 = 71.43%
Question 90
The following table gives the details of Five commodities A, B, C, D and E with quantity required and their costs for a family in a month. Study the table and answer the questions that follow.
The amount spent extra on commodities B and C in the year 2019 as compared to that in the year 2016,is:
Percentage increase in profit in year 2015-2016 = $$\frac{690 - 625}{625} \times 100 = \frac{65}{625} \times 100$$ = 10.4%
Percentage increase in profit in year 2016-2017 = $$\frac{725 - 690}{690} \times 100 = \frac{35}{690} \times 100$$ = 5.07%
Percentage increase in profit in year 2017-2018 = $$\frac{775 - 725}{725} \times 100 = \frac{50}{725} \times 100$$ = 6.89%
Percentage increase in profit in year 2018-2019 = $$\frac{815 - 775}{775} \times 100 = \frac{}{775} \times 100$$ = 5.16
$$\therefore$$ The maximum percentage increase in profit over the previous year is 2015-2016.
Question 94
The following table shows the percentage distribution of the population of five states, A, B, C, D and E on the basis of the poverty line and also on the basis of sex.
If the population of males below the poverty line for State C is 3 million, then what is the total population of State C?
Population of males below the poverty line for State C = 3 million
Ratio of the male to female population = 3 : 02
Population of males below the poverty line for State C = $$\frac{3}{3} \times$$ 2 = 2 million
Percentage population below the the poverty line = 19%
3 + 2 = 19%
19% = 5 million
Total population(100%) = $$\frac{5}{19} \times 100$$ = 26.31%
Question 95
The given table represents the number of engineers recruited by four companies A, B, C and D over the years. Study the table carefully and answer the question that follows.
The total number of engineers recruited by company A in 2014 to 2017 is what percentage more than the total number of engineers recruited by all four companies in 2019?
The given table represents the sale (in thousands) of cars by four companies A, B, C and D in six years. Study the table and answer the question that follows.
The total number of cars sold by companies A in 2017 and C in 2013 is what percentage of the total number of cars sold by all four companies in 2013 and 2016? (correct to one decimal place)
Average amount of interest per year which the company had to pay during this period = $$\frac{23.5 + 30 + 40 + 35 + 45}{5}
= 173.5/5 = 34.7 lakh
Question 98
The given table represents the revenue (in ₹ crores) of a company from the sale of four products A. B. C and D in 6 years. Study the table carefully and answer the question that follows.
What is the ratio of the total revenue of the company in 2014 from the sale ofall the four products to the total revenue from the sale of product C in 2014 to 2017?
Total revenue of the company in 2014 from the sale = 80 + 92 + 96 + 92 = 360
The total revenue from the sale of product C in 2014 to 2017 = 96 + 88 + 93 + 103 = 380
The ratio of the total revenue of the company in 2014 from the sale of all the four products to the total revenue from the sale of product C in 2014 to 2017 = 360 : 380
= 18 : 19
Question 99
The number of students enrolled in different faculties in a school is as follows:
The percentage of students studying in Science and Vocational subjects is:
The given table represents the sale (in thousands) of cars by four companies A, B, C and D in six years. Study the table and answer the question that follows.
The Total number of cars sold by company C in 2018 exceeds the average number of cars sold by company A during 2014 to 2018 by:
Total marks obtained by all the seven students in Physics = (80 + 90 + 70 + 80 + 65 + 85 + 50)% of 120 = 120 $$\times \frac{520}{100} = 624
Average marks obtained by all the seven students in Physics = sum of terms/number of all terms = 6247 = 89.14
Question 108
The given table represents the number of computers sold by four dealers A, B, C and D during the first six months of 2016. Study the table carefully and answer the question that follows.
The total number of computers sold by dealer B in April, May and June is what percentage of the total number of computers sold by all the dealers in February and April?
The given table represents the number of engineers recruited by four companies A, B, C and D over the years. Study the table carefully and answer the question that follows.
The total number of engineers recruited by company B in 2014 and 2017 is what percentage of the total number of engineers recruited by C during 2015 to 2019?
The given table represents the sale (in thousands) of cars by four companies A, B, C and in six years. Study the table and answer the question that follows.
The total number of cars sold by company B during 2015, 2017 and 2018 is what percentage less than the total number of cars sold by company C in 2013, 2015, 2017 and 2018?
The given table shows the number (in thousands) of cars of five different models A, B, C, D and E produced during Years 2012-2017. Study the table and answer the question that follow.
In the year 2015, which type of car constitutes exactly 20% of the total number of cars produced that year?
There a continuous decrease in production over the months in company I.
Question 114
The given table represents the production of different types of motorcycles (in thousands) over a period of six years. Study the table carefully and answer the question that follows.
What is the ratio of the total number of motorcycles of type B produced in 2016 and 2018 to the total number of motorcycles of type D produced in 2013, 2015 and 2016?
Total number of motorcycles of type B produced in 2016 and 2018 = 88 + 92 = 180
Total number of motorcycles of type D produced in 2013, 2015 and 2016 = 103 + 102 + 95 = 300
Ratio of the total number of motorcycles of type B produced in 2016 and 2018 to the total number of motorcycles of type D produced in 2013, 2015 and 2016 = 180 : 300 = 3:5
Question 115
The given table represents the sale (in thousands) of cars by four companies A, B. C and D in six years. Study the table and answer the question that follows.
What is the ratio of the total number of cars sold by companies A, B and D in 2017 to the total number of cars sold by all four companies in 2018?
The total number of cars sold by companies A, B and D in 2017 = 52 + 53 + 75 = 180
The total number of cars sold by all four companies in 2018 = 63 + 67 + 76 + 74 = 280
The ratio of the total number of cars sold by companies A, B and D in 2017 to the total number of cars sold by all four companies in 2018 = 180 : 280 = 9 : 14
Question 116
The given table represents the exports (in ₹crores) of four items A, B, C and D over a period of six years. Study the table and answer the question that follows.
The total exports of item D in 2010, 2012 and 2014 is what percentage of the total exports of all the four items in 2011 and 2012?
The number of students who have passed with distinction in the year 2012 = 210
The number of students who have appeared in the year 2012 = 840
The percentage of students who have passed with distinction in the year 2012 = $$\frac{210}{840} \times 100 = 25%$$
Question 118
The following table gives the details of Five commodities A, B, C, D and E with quantity required and their costs for a family in a month. Study the table and answer the questions that follow.
The ratio of the total amount spent on A and D commodities in the year 2019 is:
Total amount spent on A commodities in the year 2019 = quantity $$\times rate = 15 \times 80$$
Total amount spent on D commodities in the year 2019 = $$40 \times 85$$
The ratio of the total amount spent on A and D commodities in the year 2019 = $$15 \times 80 : 40 \times 85 = 6 : 17$$
Question 119
The following table represents the number of candidates that appeared and qualified in a competitive examination from different states over five years. Study the table and answer the questions that follow.
What was the total number of candidates appearing from all the states in the year 1997?
The highest growth of sugarcane production over its previous year is recorded in the year 2017.
Question 121
The given table shows the number (in thousands) of cars of five different models A, B, C, D and E produced during Years 2012-2017. Study the table and answer the question that follow.
The percentage increase in the total cars in 2016 over 2012, is:
$$\therefore$$ 2 employees(A and B) got more than a total of ₹10,000 as income other than salary.
Instructions
The given table represents the production of different types of motorcycles (in thousands) over a period of six years. Study the table carefully and answer the question that follows.
Question 125
What is the percentage increase in the total production of all types of motorcycles from 2014 to 2018?
By what percentage is the total production of type A motorcycles over six years, less than the total production of all types of motorcycles in 2013 and 2016?
The given table represents the exports (in ₹crores) of four items A, B, C and D over a period of six years. Study the table and answer the question that follows.
Question 127
The total exports of item A from 2012 to 2014 is what percentage less than the total exports ofall the four items in 2015? (Correct to one decimal place)
Total exports of item A in 2014 and 2015 = 425 + 400 = 825
Total exports of item C in 2011 and 2015 = 244 + 306 = 550
Ratio of the total exports of item A in 2014 and 2015 to the total exports of item C in 2011 and 2015 = 825 : 550 = 3 : 2
Instructions
The given table represents the number of computers sold by four dealers A, B, C and D during the first six months of 2016. Study the table carefully and answer the question that follows.
Question 129
The number of months, in which the number of computers sold by dealer B was less than the average number of computers sold by dealer C over six months, was:
Average number of computers sold by dealer C over six months = total number of computer/6 = $$\frac{95 + 104 + 100 + 99 + 100 + 102}{6}$$ = 600/6 =100
The number of months, in which the number of computers sold by dealer B wasless than the average number of computers sold by dealer C over six months, was 4(January, feb, march, April)
Question 130
What is the ratio of the total number of computers sold by dealer A in February, April and May to the total number of computers sold by dealer D in March, May and June?
The total number of computers sold by dealer A in February, April and May = 94 + 108 + 98 = 300
The total number of computers sold by dealer D in March, May and June = 90 + 89 + 91 = 270
Ratio of the total number of computers sold by dealer A in February, April and May to the total number of computers sold by dealer D in March, May and June = 300 : 270
= 10 : 9
Instructions
Study the graph and answer the question.
Question 131
The number of families whose monthly expenditures on education are ₹2,000 or more but less than ₹4,000 is ..........
The number of families whose monthly expenditures on education are ₹2,000 or more but less than ₹4,000 = 35 + 47 + 55 + 70 = 207
Question 132
What is the ratio of the number of families whose monthly expenditures on education are below ₹3,000 to the number of families whose monthly expenditures on education are ₹4,000 or above but less than ₹5,500?
The number of families whose monthly expenditures on education are below ₹3,000 = 23 + 35 + 47 = 105
The number of families whose monthly expenditures on education are ₹4,000 or above but less than ₹5,500 = 65 + 52 + 43 =160
the ratio of the number of families whose monthly expenditures on education are below ₹3,000 to the number of families whose monthly expenditures on education are ₹4,000 or above but less than ₹5,500 = 117 : 160 = 21 : 32
Instructions
Study the bar graph and answer the question.
Question 133
In how many years was the number of trees planted in state B more than the average number of trees planted in state A over the years?
Total number of trees planted in state A over the years = 70 + 90 + 78 + 92 + 100 = 430
=> Average = $$\frac{430}{5}=86$$
Thus, in 3 years i.e., 2015, 2016 and 2018, number of trees planted in state B was more than the average number of trees planted in state A over the years.
=> Ans - (B)
Question 134
Percentage decrease in the number of trees planted in 2016 in state A as compared to that in 2015 in the same state was:
The total number of trees planted in state B in 2015 and 2017 was what percentage less than the total number of trees planted in state A in 2014, 2016 and 2017? (Your answer should be correct to one decimalplace.)
Now, the number of months in which the number of computers sold was above 20% of the total number of computers sold in 5 months were in January, March, May.
=> Ans - (A)
Instructions
The given histogram represents the frequency distribution of average runs scored by 50 selected players from a district in a local cricket tournament.
Question 138
What is the overall average score of the 50 players?
Study the given pie chart and answer the question that follows. Break-up (degree-wise) of the number of students in five schools (A, B, C, D and E) in a city.
Total number of students = 5200
Question 140
If the ratio of the numberof boysto thatofgirls in school B is 7 : 6 and the ratio of the number of boys to that of girls in school is 4 : 5, then what is the ratio of the number of boys in B to that of girls in D?
Question 141
If the total number of students in schools D and E exceeds the number of students in school A by x, then x lies between:
Instructions
The following table represents the number of candidates that appeared and qualified in a competitive examination from different states over five years. Study the table and answer the questions that follow.
Question 142
What is the difference between the number of candidates qualifying in the year 1998, in the states M and P?
The total exports of cars of type A in 2014 to 2017 = 200 + 150 + 275 + 175 = 800 The total exports of cars of type B in 2015 to 2018 = 250 + 200 + 275 + 325 = 1050 Required percentage = $$\frac{1050 - 800}{1050} \times 100 = \frac{250}{1050} \times 100 = 23.8% $$\therefore$$ The correct answer is option D.
Question 2
In the given pie-chart. the amount spend on education is what percent of the savings?
Question 3
The given pie-chart depicts the expenditure incurred in crores towards each sport.
In the given pie-chart, what is the difference between the expenditure incurred on cricket and football?
Difference in Expenditure on Cricket-Expenditure on Football
128-51=77
Question 4
In the given bar graph, what is the ratio of the total boys and girls in all schools?
Question 5
The given pie-chart, shows the percentage distribution of the expenditure incurred in publishing a book. Study the pie-chart and the answer the questions based on it.
In the given pie-chart by what percentage the Promotion cost on the book is less than the Paper cost?
Question 6
The given pie-chart shows favourite sport of students of a school.
In the given pie-chart, if there were 1280 students in all, how many liked football?
Question 7
In the given pie-chart, how many persons are using train to reach their workplace?
The given bar chart shows population of 4 different states in 3 years (in crores).
In the given bar-chart, what is the ratio of increase in population in Bihar between 2005 and 2010 to that between 2010 and 2015?
Question 9
The line graph shows the monthly expenditure by two families in hundreds:
In the given line graph. what is the difference in percentage of spending on food between Family J and K?
Question 10
The given bar chart, shows the sales of books (in thousand number) from six branches of a publishing company during two consecutive years 2000 and 2001.
In the given bar-chart, the ratio of total sales of all branches (in thousand numbers) for the year 2000 to 2001 is:
Question 11
The given pie-chart shows runs scored by A in 6 matches.
In the given pie-chart. if A scored a century in matches 4 and 6, What would have been her average score?
Question 12
In the given histogram, what is the mean height of all students correct to one decimal place?
Question 13
The line graph shows the temperature on four Sundays of three cities.
In the given line graph, what was the difference in temperature between Delhi and Mumbai on the $$2^{nd}$$ Sunday?
Question 14
The given bar chart shows number of marks scored by a student in each subject in three years:
In the given bar-chart. what is the percentage increase in marks in Mathematics in 2012 compared to 2008?(round off)
Question 15
The given bar chart shows the details of cycle sales by a company between January and May for years 2017 and 2018.
In the given bar-chart, which month sales show the maximum decrease in 2018 as compared to 2017?
Question 16
The given bar chart, shows the sales (in thousands) for sets of televisions of three companies in three years.
In the given bar-chart, What is a difference between the average sales of televisions A and B for 3 years?
Question 17
The given bar chart shows production of steel by companies A, B, C and D for years 2014, 2015, 2016 (in tonnes).
In the given bar-chart, the average production of steel at ‘C’ for the year 2014-2016 is:
Average production of C during these periods is $$=1075/3=358.33.$$
A is correct choice.
Question 18
The given pie-chart shows the taxable income for A, B, C and D in lakhs of rupees.
This chart shows the tax paid for the above taxable income by A, B, C and D in lakhs of rupees.
In the given pie-chart, what is the percentage of tax charged for A?
Question 19
In the given bar graph, in which college, the percentage of boys is the highest?
Question 20
In the given bar graph, the number of students enrolled in institute B in the year 2016 is what percentage of students enrolled in institute A in 2016?
The line graph shows the temperature on four Sundays of three cities.
In the given line graph, when was the maximum temperature recorded in Delhi?
Question 24
In the given pie chart, what is the ratio of the number of people who use train or car to reach their office to the number of people who use other means of transport to reach their office.
Total productions of steel of four companies are given below :
$$A=150+300+500=950.$$
$$B=200+400+400=1000.$$
$$C=325+250+500=1075.$$
$$D=400+500+600=1500.$$
Option B is correct choice.
Question 28
In the given bar graph, in which college the difference between the percentage of boys and girls is maximum, by taking total number of students as base for that college?
Question 29
The line graph shows electricity consumption (in units) for three households A, B and C for months February to May.
If the per unit rate chart is:
In the given line graph, the electricity charges collected from all (A, B and C) for the month of February is:
Question 30
In the given histogram. in which class does the median height of the students lie?
Question 31
The given pie-chart depicts the percentage of students coming to school using different modes of transport. Total number of students = 1300
In the given pie-chart, if 234 students used to walk, then how many come by bus?
Question 32
The given bar chart shows production of steel by companies A. B, C and D for years 2014, 2015, 2016 (in tonnes).
In the given bar-chart, what is the percentage production of ‘B‘ in 2014 to the total production of 2014?
The line graph shows electricity consumption (in units) for three households A, B and C for months February to May.
In the given line graph, the percentage increase in electricity consumption of ‘B’ between March and May is:
Question 34
The line graph shows the production of product A and B (in thousands) during the period 2004 to 2009 and the second line Graph shows the percentage sale of these products.
In the given line graph. what is the total sale of Product A in the year 2005 and 2009 taken together?
Production of A in 2005 = 11000 Sale of A in 2005 = 60% of 11000 = 6600 Production of A in 2009 = 14000 Sale of A in 2009 = 70% of 14000 = 9800 Therefore, Total production of A in 2005 and 2009 together = 6600+9800 = 16400.
Question 35
In the given bar graph, the percentage decrease in the number of students in Institute A in 2016 is what percent of students in 2015.
In the given histogram, what percentage of students got marks less than 45? (Correct to one decimal place)
Question 37
In the given pie-chart, if the female employees in department D is 75%. then how many male employees are in that department?
Question 38
The line graph shows the temperature on four Sundays of three cities.
In the given line graph. what was the average temperature on the $$1^{st}$$ Sunday in all the three cities? (rounded to first decimal)
Question 39
In the given bar graph, what is the ratio of the total number of students from 2016 to 2018 in institute A to the total number of students from 2016 to 2018 in institute B.
total number of students from 2016 to 2018 in institute A is = 750+450+500=1700
total number of students from 2016 to 2018 in institute B is = 600+650+350=1800
so ratio = $$\frac{1700}{1800}=\ \frac{17}{18}$$ Ans
Question 40
The line graph shows electricity consumption (in units) for three households A, B and C for months February to May.
In the given line graph, the difference between the total electrical consumption between months of February and April is:
Question 41
The table below shows the admission and transfer in standards 1-3 of a school.
In the given table, in Standard 1, how many students were there at the end of year 2016?
Question 42
The line graph shows the monthly expenditure by two families in hundreds:
In the given line graph, if the monthly income of Family K increases to 33 7,200. What will be the increase in expenditure on entertainment ? (Assuming they spend the same proportion as before. round off to one decimal)
Question 43
The given bar chart shows the sales of books (in thousands) in four metro branches of a company for the years 2014 and 2015.
In the given bar - chart. which branch has the highest increase in sale (in %) in 2015 as compared to 2014?
Question 44
The line graph shows the temperature on four Sundays of three cities.
In the given line graph. what was the difference in temperature between Delhi and Chennai on the $$3^{rd}$$ Sunday?
Question 45
In the given pie-chart, total expenditure together on rent and education is what percent less than total expenditure of food and miscellaneous items?
Question 46
The given bar chart shows the details of cycle sales by a company between January and May for years 2017 and 2018.
In the given bar-chart, what is the total increase or decrease in percentage sale in 2018?
Question 47
The given pie chart shows the quantity wise sales distribution of five products (A, B, C, D and E) of a company in 2016. Quantity wise sales distribution of five products (A, B, C, D and E)
If 1500 units of product D were sold in 2016 and the total number of units sold by the company in 2017 was 18% more than that sold in 2016, then the total units sold by the company in 2017 is:
Quantity of product D were sold in 2016 = 1500 units $$100\degree = 1500$$ Total product(360$$\degree) = \frac{1500}{100} \times 360 = 5400$$ Total number of units sold by the company in 2017 = 18% more than that sold in 2016 = 5400 $$\times \frac{118}{100} = 6372$$
Question 48
In the given bar graph, what is the average number of girls in all colleges?
Question 49
In the given bar graph, what is the average number of girls from all schools?
Question 50
The table shows Income and expenditure of a person for 3 years (in thousands):
In the given table. if a person invested his savings every year at 8% simple interest, how much interest will he earn at the end of 2003?
The given bar chart shows the sales of books (in thousands) in four metro branches of a company for the years 2014 and 2015.
In the given bar-chart. the ratio of total sales between Mumbai and Delhi is:
Question 52
In the given histogram, what is the percentage of students whose height is in the class interval 165 - 170?
Question 53
In the given pie-chart, the number of persons using a car is what percentage of persons using a scooter?
Question 54
The given bar chart, shows the sales (in thousands) for sets of televisions of three companies in three years.
In the given bar-chart, if profit earned per television by C in 1992 was ₹825, the total profit earned was:
Question 55
The given pie-chart shows the numbers of tourists for the year 2015. traveling from India and to India. In the given pie-chart, if the number of tourists visiting India is 21,35,600 and the number from India to other countries is 20,45,450, how many more people visited USA from India than from USA to India?
The number of people visited from INDIA to USA$$=2135600×0.26=555256.$$
So, required number is
$$=859089-555256.$$
$$=303833.$$
Option A is correct.
Question 56
The line graph shows the production of product A and B (in thousands) during the period 2004 to 2009 and the second line Graph shows the percentage sale of these products.
In the given line graph, what is the total sale of Products A and B in the year 2007?
Production of A in 2007 = Rs.7000 Sale of A in 2007 = 75% of Rs.7000 = Rs.5250 Production of B in 2007 = Rs.9000 Sale of B in 2007 = 56% of Rs.9000 = Rs.5040 Total sale of A and B in 2007 = Rs.5250+Rs.5040 = Rs.10290
Question 57
The given pie-chart shows the taxable income for A, B, C and D in lakhs of rupees.
This chart shows the tax paid for the above taxable income by A, B, C and D in lakhs of rupees.
In the given pie-chart. what is the overall tax percentage for all four?
Question 58
In the given histogram, what percentage of cars were running with the speed less than 60 km/h?
Total cars = 50+70+85+90+60+45 =400 Now cars traveling at less than 60 km/hr = 50+70 =120 Now therefore percentage = $$\frac{120}{400}\times\ 100\ =30\%$$
Question 59
In the given histogram, what percentage of students have height in the interval of 105 - 110?
Question 60
In the given histogram. what is the mean speed of cars (in km/h) to nearest Whole number?
Question 61
The given bar chart, shows the sales (in thousands) for sets of televisions of three companies in three years.
In the given bar-chart, what is the ratio of television sales between A in year 1992 and C in year 1991?
Question 62
The given pie-chart, shows the percentage distribution of the expenditure incurred in publishing a book. Study the pie-chart and the answer the questions based on it.
In the given pie-chart, by what percentage Printing and Binding cost on the book is less than the other costs?
Total Printing and Binding cost = 20+20 = 40% of total cost Other costs = 10+25+15+10 60% of total cost. Therefore, Required percentage = $$\dfrac{60-40}{60}\times100 = \dfrac{20}{60}\times100 = \dfrac{100}{3}$$%
Question 63
In the given bar graph, what is the ratio of the total boys and girls in all 5 colleges?
Question 64
The given bar chart shows number of marks scored by a strident in each subject in three years:
In the given bar-chart, if number of marks in Social Studies in year 2012 is 13% of the school strength, the number of students is:
Question 65
The line graph shows the monthly expenditure by two families in hundreds:
In the given line graph. what is the ratio of the difference in spending between food and education for family J and K?
Total imports in 2015 and 2017 = 450 + 550 = 1000 The total exports in 2013 and 2016 = 400 + 440 = 840 Ratio of the total imports in 2015 and 2017 to the total exports in 2013 and 2016 = 1000 : 840 = 25 : 21 $$\therefore$$ The correct answer is option C.
Question 71
In the given histogram, in which class interval, the median marks lies?
Question 72
In the given pie-chart, what is the central angle of the sector representing the number of employees in the department D?
Question 73
The given bar chart shows number of marks scored by a student in each subject in three years:
In the given bar-chart, in which subject was the lowest marks scored in 2010?
Question 74
The given bar chart shows population of 4 different states in 3 years (in crores).
In the given bar-chart, what is the population growth (in crores) in total in states Kerala and Tamil Nadu for the period between 2005 and 2015?
Question 75
The given pie-chart depicts the percentage of students coming to school using different modes of transport. Total number of students = 1300
In the given pie-chart, the difference between the number of students travel by bus or walk to the number of students travel by car or cycle.
Question 76
The given pie-chart shows favourite sport of students of a school.
In the given pie-chart, what is the difference in percentage between liking for football and basketball?
Question 77
In the given bar graph, in which organisation, the percentage difference between the males and females is maximum, by considering total persons in that organisation as base?
Question 78
The given pie-chart shows runs scored by A in 6 matches.
In the given pie-chart, what is the increase or decrease in score in match 4 as compared to match 2?
Question 79
In the given pie-chart, what is the ratio of the total expenditure on steel, cement and bricks to the total expenditure on labour and miscellaneous expenses?
The ratio of the total expenditure on steel, cement and bricks to the total expenditure on labour and miscellaneous expenses will be Ratio of sum of angles of respective quantities so we get the ratio as $$\frac{36+72+54}{108+90}=\frac{162}{198}=\frac{9}{11}$$
Question 80
The line graph shows the temperature on four Sundays of three cities.
In the given line graph, what was the average temperature on the 3rd Sunday in all the three cities? (rounded to first decimal)
Question 81
The table below shows the admissions and transfers in standards 1-3 of a school.
In the given table, what was the total strength in Standards 1-3 at the end of 2015?
Question 82
The table shows Income and expenditure of a person for 3 years (in thousands):
In the given table, if a person reduced his expenditure by 10%, by how much would his total savings increased?
The given pie-chart depicts the percentage of students coming to school using different modes of transport. Total number of students = 1300
In the given pie-chart, the percentage difference between students coming by car or bus to coming by walking or cycling.
Question 85
In the given pie-chart. what is the number of employees working in department A?
Question 86
The given bar chart shows the details of cycle sales by a company between January and May for years 2017 and 2018.
In the given bar-chart, which month sale shows the maximum increase in 2018 as against 2017'?
Question 87
In the given histogram, in which class interval, the median lies?
Question 88
In the given histogram, the number of students whose height is in the class interval 175 - 180 is what percent less than the number of students whose height is in the class interval 160 - 165 ?
Question 89
The given pie-chart shows favourite sport of students of a school.
In the given pie-chart, if the school strength was 2500, how many liked cricket more than hockey?
Question 90
The line graph shows the production of product A and B (in thousands) during the period 2004 to 2009 and the second line Graph shows the percentage sale of these products.
In the given line graph, what is the total sale of Product B in the year 2004 and 2008 together?
Production of B in 2004 = 8500 Sale of B in 2004 = 55% of 8500 = 4675 Production of B in 2008 = 11000 Sale of B in 2008 = 65% of 11000 = 7150 Total sale of B in 2004 and 2008 together = 4675+7150 = 11825.
Question 91
The line graph shows the temperature on four Sundays of three cities.
In the given line graph, when was the maximum temperature recorded in Chennai?
Question 92
In the given histogram, what is the mean marks of the students. correct to one decimal place?
Question 93
In the given pie-chart, what is the total expenditure on rent?
Question 94
The given pie-chart shows runs scored by A in 6 matches.
In the given pie-chart. what is the average runs scored in all matches? (rounded off)
Question 95
The given pie-chart shows the percentage distribution of the expenditure incurred in publishing a book. Study the pic-chart and the answer the questions based on it.
In the given pie-chart, by what percentage the Royalty on the book is less than the Printing cost?
Total export of cars of type A over the five years = 200 + 150 + 275 + 175 + 300 = 1100 Average exports (per year) of cars of type A over the five years = 1100/5 = 220 25% more than the average exports = 220 $$\times \frac{125}{100} = 275 In 2016, the exports of cars of type A was 25% more than the average exports (per year) of cars of type A over the five years. $$\therefore$$ The correct answer is option C.
Question 98
In the given figure, if $$\frac{QR}{XY} = \frac{14}{9}$$ and $$PY = 18$$ cm, then what is the value (in cm) of $$PQ$$ ?
Question 99
In the given figure, MNOP is a parallelogram. PM is extended to Z. OZ intersects MN and PN at Y and X respectively. If OX = 27 cm and XY = 18 cm, then what is the length (in cm) of YZ?
Question 100
The given pie chart shows the breakup of total number of the employees of a company working in different offices (A, B, C, D and E). Total No. of employees = 2400
What is the number of offices in which the number of employees of the company is between 350 and 650?
1 employee = $$\frac{360}{2400}$$ 350 employees = $$\frac{360}{2400} \times 350$$ = 52.5$$\degree$$ 650 employees = $$\frac{360}{2400} \times 650$$ = 97.5$$\degree$$ Number of offices in which the number of employees of the company is between 350 and 650 = number of offices in which the number of employees of the company is between 52.5$$\degree$$ and 97.5$$\degree$$ = 3 offices $$\therefore$$ The correct answer is option D.
Question 101
In the given figure PT : TS : SR = 2 : 1 : 1 and SU is parallel to TQ. If RU = 10 cm. RS = 8 cm and SU = 6 cm, then what is the value (in cm) of PQ?
Question 102
In the given figure, Ab = 30 cm and CD = 24 cm. What is the value (in cm) of MN?
Question 103
In the given figure. SX is tangent. SX = OX = OR. If QX = 3 cm and PQ = 9 cm, then what is the value (in cm) of OS ?
Question 104
The given graph shows the weights of students in a school on a particular day.
The number of students weighing less than 50 kg is what per centless than the number of students weighing 55 kg or more?
The number of students weighing less than 50 kg = 30 + 40 = 70 The number of students weighing 55 kg or more = 55 + 45 + 25 = 125 Required percentage = $$\frac{70}{125} \times$$ 100 = 56%
Question 105
In the given figure, $$\angle QRU = 72^\circ$$, $$\angle TRS = 15^\circ$$ and $$\angle PSR = 95^\circ$$, then what is the value (in degrees) of $$\angle PQR$$?
Question 106
In the given figure. ABCD and BEFG are squares of sides 8 cm and 6 cm respectively. What is the area (in cm$$^2$$) of the shaded region?
Question 107
Study the graph and answer the question that follows.
What is the ratio of the total number of workers whose daily wages are less than $500 to the total number of workers whose daily wages are ₹600 and above?
Total number of workers whose daily wages are less than ₹500 = 30 + 45 = 75 Total number of workers whose daily wages are ₹600 and above = 55 + 35 = 90 ratio of the total number of workers whose daily wages are less than ₹500 to the total number of workers whose daily wages are ₹600 and above = 75 : 90 = 5 : 6 $$\therefore$$ The correct answer is option A.
Question 108
In the given figure. two squares of sides 8 cm and 20 cm are given. What is the area (in $$cm^2$$) of the shaded part?
Question 109
Study the following bar graph and answer the question given.
The ratio of the total demand of motor cycles of companies A, C and E to the total production of motorcycles of B and C is:
Total demand of motor cycles of companies A, C and E = 50 + 60 + 55 = 165 Total production of motorcycles of B and C = 38 + 72 = 110 The ratio of the total demand of motor cycles of companies A, C and E to the total production of motorcycles of B and C = 165 : 110 = 3 : 2
Question 110
A solid cylinder has radius of base 14 cm and height 15 cm. 4 identical cylinders are cut from each base as shown in the given figure. Height of small cylinder is 5 cm. What is the total surface area (in $$cm^2$$) of the remaining part?
Question 111
A right triangular pyramid XYZB is cut from cube as shown in figure. The side of cube is 16 cm. X. Y and Z are mid points of the edges of the cube. What is the total surface area (in $$cm^2$$) of the pyramid?
Question 112
DIRECTION:The population of a city is 8000. They have various types of occupation which is given below by the pie-chart. Study the pie-chart and answer the given questions.
How much percent are in service sector from the total population?
In service sector 72 degrees of share i.e 360 degrees=100 72 degrees=72*100/360 =20%
Question 113
Study the chart and answer the question based, on the pie chart. The pie chart given below shows expenditures incurred by a family on various items and savings in a month. Savings of the family is ₹ 8,000 in a month.
What is the total expenditure of the family for the month?
From the given table, we can say that 1 wicket is taken by 9 bowlers. similarly, 2 wickets are taken by bowlers and so on. From this, we can form a sequence which is given below.
the total number of students admitted in the year 2015 =50+40 total number of students admitted in the year 2016 =60+55 Difference=115-90 =25
Question 120
Study the Table Properly and answer by interpreting the data. The table shows the percentage population of five districts in a state below poverty line and the proportion of males and females.
The total population in $$D_1$$, is 30,000. The number of female under below poverty line in the district $$D_1$$, is:
The bar graph shows the number of cycles sold by a distributor in each month from January to June. What is the increase in the number of cycles sold in April as compared to March?
Number of cycles sold in March = 60 Number of cycles sold in April = 105 Percentage Increase in number of cycles = $$\dfrac{105-60}{60}\times100 = \dfrac{45}{60}\times100 = 75$$%
Question 123
The data given below shows the number of people who have saved a certain amount of money.
The average export of vehicles in 2018 = $$\frac{\left(35+45+50+43+47\right)}{5}$$
= $$\frac{220}{5}$$
= 44
The export of vehicle A in 2017 = 25
Percent more = $$\frac{\left(44-25\right)\times\ 100}{25}$$
= $$\frac{\left(19\right)\times\ 100}{25}$$
= 76%
Question 126
The given Pie Chart (central angles are not as per any chosen scale) presents the percentage of the number of refrigerators of five different companies (with reference to the total number of refrigerators) in a hotel.
What is the difference in number of refrigerators supplied to the hotel by companies C1 and C5?
Profit % = $$\dfrac{R-E}{E}\times100$$ where R = Revenue, E = Expenditure. Given, E = Rs.46000 and Profit % = 8% $$\dfrac{R-46000}{46000}\times100 = 8$$
The Table shows the number of candidates appearing for an interview for a post in six Banks (H, I, J, K, L, M) and percentage of qualifying candidates.
The number of candidates who did not qualify in bank K was approximately what percent(correct to nearest integer) of the candidates who did not qualify in bank I?
The number of candidates who did not qualify in bank K = 980 of (100-20)%
= 980 of 80%
= 784
The number of candidates who did not qualify in bank I = 2200 of (100-26)%
= 2200 of 74%
= 1628
Percentage = $$\frac{784}{1628}\times\ 100$$
= 48.157%
= 48% (approx.)
Question 130
The table shows the production of different types of cars (in thousands).
If the data related to the production of cars of type E is represented by a pie chart. then the central angle of the sector representing the data of production of cars in 2013 will be:
the production of cars in 2013 i.e 42 will be represented by $$84^\circ$$.
So , the answer would be option b)$$84^\circ$$.
Question 131
This table shows the percentage of students passing out of five different colleges over three years.It is given that from each college, 200 students appeared every year.
What is the ratio of the number of students passing to those failing from college E in the year 2015?
Question 132
Study the chart and answer the question based, on the pie chart. The pie chart given below shows expenditures incurred by a family on various items and savings in a month. Savings of the family is ₹ 8,000 in a month.
How much more amount is spent on food than on housing?
Ratio between the number of pants produced by the company in the year 2014, 2015 and 2016 respectively is:
= $$15:30:21$$
= $$5:10:7$$
=> Ans - (B)
Question 134
Study the Table Properly and answer by interpreting the data. The table given the percentage of result by four different classes in the five different year of examination:
In which class the average performance is least in all the five years?
The production of the rice $$=5.2+5.4+5.8+6.2+6.5+6.9=36 $$million tonnes
Hence, the average production of the rice in state A $$=\dfrac{36.0}{6}=6$$million tonnes
Question 136
The Bar Graph shows the Production and Sales of Mobile handset of various companies A, B, C, D, E & F in a month.
The total units sold by companies A, B and C together is approximately what per cent of the total units produced by Companies A, B and C together (correct to nearest integer)?
Percentage more = $$\frac{2650-2150}{2150}\times\ 100$$
= $$\frac{500}{2150}\times\ 100$$
= 23.25%
= 23% approx.
Question 139
The Table given below presents the number of books on different subjects kept on separate shelves. Subjects with odd and even numbers are of Arts and Science respectively.
What is the ratio of the number of books of S1 and the average number of books per subject?
Total number of boys in all the schools is (9/17)*680=360 (4/9)*720=320 (5/18)*540=150 (2/3)*660=440 (13/25)*900=468 Sum=1838 average=1838/5 =367 Number of girls in each school=680-360=320 720-320=400 540-150=390 660-440=220 900-468=432 Therefore three schools have the girls more than average boys per school.
Question 144
Table shows the percentage of marks obtained by seven students in six different subjects in an examination. The numbers in the brackets are the maximum marks in each subject.
What are the average marks obtained by all the seven students in Physics? (Correct to two decimal places)
So , the answer would be option a)$$\frac{100}{259}$$
Question 150
The Table shows the number of articles sold by six different sellers (A, B, C, D, E and F)to two different shopkeepers P and Q. Some articles are purchased by other sellers also. Total articles purchased by shopkeepers P and Q is 300 and 500 respectively.
Total number of articles sold by seller C to shopkeeper Q is what percent of total number of articles sold by seller F to shopkeeper P?
The total number of articles sold by seller C to shopkeeper Q = 44
total number of articles sold by seller F to shopkeeper P = 55
Percent = $$\frac{44}{55}\times\ 100$$
= $$\frac{4}{5}\times\ 100$$
= 80%
Question 151
The Table shows the production of different types of cars (in thousands).
The ratio of the total production of type A cars in 2015 and type B cars in 2014 taken together to the total production of type C cars in 2017 and type E cars in 2015 taken together is:
Total production of type A car in 2015 and type B car in 2014=56+48 =104
Total production of type C car in 2017 and type E car in 2015=57+48 =105
Hence the required ratio$$=\dfrac{104}{105}$$
Question 152
The table shows the production of different types of cars (in thousands).
The average production of cars in 2018 is approximately what percent less than the total production of type D cars in 2015 and type B cars in 2017 taken together ?
Total sales=20000+40000+80000+55000 =195000 Given all the sales increase by 10% and so new total sales count is =195000*1.1 =214.5k sales
Question 154
Study the chart and answer the question based, on the pie chart. The pie chart given below shows expenditures incurred by a family on various items and savings in a month. Savings of the family is ₹ 8,000 in a month.
The ratio of the expenditure on food to the savings is:
The ratio of the total number of units of the product sold in 2013 and 2015 to that produced in 2015 and 2016 = (328+242) : (256+504)
= 570 : 760
= 57 : 76
= 3 : 4
Question 160
The following table shows the percentage distribution of students in various disciplines from five different colleges.
If the data of the total students’ college wise, is represented by a pie-chart, what is the central angle of the sector representing college E (to nearest whole number)?
Total number of student $$=8000+10000+15000+9000+11000=53000$$
Hence, the ratio of student in E and total student $$=\dfrac{11000}{53000}$$
Hence, the angle at the center $$=\dfrac{11\times 360}{53}=74.71^\circ \cong 75^\circ$$
Question 161
The given Pie Chart (central angles are not as per any chosen scale) presents the percentage of the number of refrigerators of five different companies (with reference to the total number of refrigerators) in a hotel.
If the total number of refrigerators in the hotel is 3700, then what is the number of refrigerators of company C5?
The average production of type D vehicles over six years = $$\frac{65+63+73+71+70+72}{6}=69$$
We can clearly see from the data given ,
For, 2013, 2014, 2015 and 2016,The production of Type C vehicle is below average production of type D over all six years.
Hence, Option D is correct.
Question 163
The Table shows the distribution of the marks obtained by various students in a class. What is the ratio of the number of students getting $$\geq$$ 20% in English and $$\geq$$ 80% in Hindi to $$\geq$$ 40% in English and $$\geq$$ 60% in Hindi?
number of students getting $$\geq$$ 20% of 50 marks in English and $$\geq$$ 80% of 50 marks in Hindi.
number of students getting $$\geq$$ 10 marks in English and $$\geq$$ 40 marks in Hindi = 4320+200
= 4520 Eq.(i)
number of students getting $$\geq$$ 40% of 50 marks in English and $$\geq$$ 60% of 50 marks in Hindi.
number of students getting $$\geq$$ 20 marks in English and $$\geq$$ 30 marks in Hindi = 3840+960
= 4800 Eq.(ii)
Ratio = Eq.(i) : Eq.(ii)
= 4520 :4800
= 452 :480
= 113 : 120
Question 164
The table shows the production of different types of cars (in thousands).
The total production of type B cars in 2015 and type D cars 2016 is what percent less than the total production of type E cars in five years?
Question 165
The table shows the production of different types of cars (in thousands).
If the data related to the production of type E cars is represented by a pie-chart, then the central angle of the sector representing production of cars in 2013 will be:
Question 166
DIRECTION:The population of a city is 8000. They have various types of occupation which is given below by the pie-chart. Study the pie-chart and answer the given questions.
How much population percent is less in industry sector than in agriculture sector?
Units of laptop sold by A = 650 units Units of laptop sold by B = 300 units Units of laptop sold by C = 150 units Therefore, Required average = $$\dfrac{650+300+150}{3} = \dfrac{1100}{3} = 366\dfrac{2}{3}$$
Question 168
Study the Table Properly and answer by interpreting the data. The table given the percentage of result by four different classes in the five different year of examination:
What is the average percentage of marks in Class-IX in the year 2012 to 2016?
Score in 1st match = 10 Score in 2nd match = 17 Score in 3rd match = 51 Score in 4th match = 45 Score in 5th match = 63 Score in 6th match = 39 Hence, In 2nd match, 3rd match and 5th match, his performance was better than 1st match, 2nd match and 4th match respectively.
Question 173
The Table given below presents the annual expenses(in thousands) on various heads made by a firm during 2006-2010.
By how much percentage (correct up to two decimal places) is the average expenditure on purchases more than the average expenditure on rent?
Sum of vehicles manufactured in the give years by X =78+119+99+141=437 Sum of vehicles manufactured in the given years by Y =139+120+100+128=487 Difference =487k-437k =50k =50000
Question 175
The bar chart given below shows the ratio of expenditure to revenue for seven consecutive years Y1, Y2, Y3, Y4, Y5, Y6 and Y7.
Revenue for year Y4 is ₹ 22500. What is the profit for year Y4?
Ratio of Expenditure to Revenue = 0.9 = 9 : 10 Let expenditure be Rs.9x and Revenue be Rs.10x Given 10x = 22500 => x = 2250 Then, Profit = Revenue - Expenditure = Rs.10x - Rs.9x = Rs.x = Rs.2250
Question 176
The Bar graph given below presents the number of female employees working in two factories on six different days of a week.
On which day the number of female workers in the factories F1 and F2, taken together, is the second highest?
In AXIS bank ATM, the amount of 500 denomination = $$500\times150$$ = 75000
In AXIS bank ATM, the amount of 2000 denomination = $$2000\times100$$ = 200000
Percentage = $$\frac{75000}{200000}\times\ 100$$
= 37.5%
Question 179
The table shows the production of different types of cars (in thousands).
What is the ratio of the total production of cars of type A in 2014 and type C in 2013 taken together to the total production of cars of type B in 2016 and type E in 2015 taken together?
the total production of cars of type A in 2014 and type C in 2013 = 48 + 36 = 84
the total production of cars of type B in 2016 and type E in 2015 = 56 + 35 = 91
Ratio = $$\frac{84}{91} = \frac{12}{13} $$
So , the answer would be option a) 12:13.
Question 180
The table shows the production of different types of cars (in thousands).
The average production of type C cars during 2012 to 2016 is approximately what percent less than the total production of type D cars in 2012 and type E cars in 2014?
Question 181
The table shows the production of different types of cars (in thousands).
What is the ratio of the total production of type B cars in 2011 and type E cars in 2013 taken together to the total production of type C cars in 2014 and type D cars in 2012 taken together?
Question 182
Sales of books from four shops (B1, B2, B3, B4) in thousands are given as below. Study the graph and answer the following questions.
The number of shop in which sales of books are below the average level is:
Sales of B1=20000 Sales of B2=40000 Sales of B3=55000 Sales of B4=80000 Average=(20000+40000+55000+80000)/4 =195000/4 =48750 so B1 and B2 are below average level.
Question 183
Study the following graph which shows the production (in thousands) of different items, and answer these questions.
The total number of all products produced by the company in the year 2014 and 2016 together is:
Total number of candidates failed in cities A and B (in thousands) = $$(\frac{2}{5}\times75)+(\frac{15}{31}\times124)$$
= $$30+60=90$$
Number of candidates appearing for the examination from city D = $$81$$
=> Required % = $$\frac{81}{90}\times100=90\%$$
=> Ans - (D)
Question 185
Study the Table Properly and answer by interpreting the data The table shows the percentage population of five districts in a state below poverty line and the proportion of males and females.
If the total population of district $$D_4$$, is 35000, then what is the number of females above the poverty line in the district $$D_4$$ ?
Total population above poverty line in district 4 $$= 0.75\times35000 = 26,250$$
The number of females above the poverty line in the district = $$\frac{3}{7}\times 26,250 = 11,250$$
Option C is correct.
Question 186
The bar chart given below shows the amount of sugar used in making 7 different varieties of sweets S1, S2, S3, S4, S5, S6 and S7 has been shown as a percentage of total weight of the sweet.
The total weight of sweet S3 is 450 kg. What is the amount of sugar used in sweet S3?
Total weight of sweet S3 = 450 kg Percentage of sugar used in S3 = 16% Therefore, Amount of sugar used in S3 = 16% of 450 = $$\dfrac{16}{100}\times450 = 72 kg$$
Question 187
The Bar graph given below presents the number of males and females working in five different companies.
What is the ratio of the total number of males working in the Companies C2 and C3 to the total number of females working in C1 and C5?
From the given Bar graph (blue bar depicts number of males working in the respective company and orange bar depicts the number of females working in the respective company)
we observe that
no of males working in company C2 = 89
no of males working in company C3= 92
total no of males working companies in C2 and C3 = 89 + 92 = 181
no of females working in company C1 = 81
no of females working in company C5= 36
total number of females working in C1 and C5 = 81 + 36 = 117
total number of males working in C2 and C3 : total number of females working in C1 and C5 = 181:117
Question 188
The Bar Graph shows the Production and Sales of Mobile handset of various companies A, B, C, D, E & F in a month.
What is the average number of Units produced by all the companies together?
The Table shows the number of articles sold by six different sellers (A, B, C, D, E and F)to two different shopkeepers P and Q. Some articles are purchased by other sellers also. Total articles purchased by shopkeepers P and Q is 300 and 500 respectively.
What is the difference between total articles sold to P and Q by all the sellers other than A, B, C, D, E and F?
total articles sold to P by the sellers A, B, C, D, E and F = 45+53+28+38+35+55 = 254
total articles sold to Q by the sellers A, B, C, D, E and F = 56+49+44+38+65+60 = 312
Total articles purchased by shopkeepers P and Q is 300 and 500 respectively.
Difference between total articles sold to P and Q by all the sellers other than A, B, C, D, E and F = (500-312)-(300-254)
= 188-46
= 142
Question 194
This table shows the percentage of students passing out of five different colleges over three years.It is given that from each college, 200 students appeared every year.
If the number of passed out students of all five colleges is represented by a pie chart, what is the central angle (to nearest whole number)of the sector representing the passed out students of college C?
Question 195
In the table given below Marks of 4 students in 5 different Subjects are given. Total Marks of each subject is 100.
What is the difference in average marks of students S1 and S4?
Difference between the sales in 1997=139-119=20 Difference between the sales in 1998=120-99=21 Difference between the sales in 1999=141-100=41 Difference between the sales in 2000=128-78=50 Difference between the sales in 2001=120-107=13 Difference between the sales in 2002=159-148=11 So in the year 2002 it is least
Question 197
Study the following pie-charts carefully to answer the questions. Percentage break-up of number of children in five different villages
What is the total number of children in villages B and E ?
Number of children in B = 25% of 2000 Number of children in E = 30% of 2000 Total number of children in B and E together = 25% of 2000 + 30% of 2000 = 55% of 2000 = 1100.
Question 198
The Bar graph given below presents the number of cars parked on ten different days in a parking area.
What is the total number of cars parked on all the ten days in the parking area?
The Bar graph given below presents the runs scored by eleven cricketers, named P1, P2, P3, P4, ... P11 in their respective careers which lasted for five years in each case. Which cricketer bridges the gap between the highest and the lowest scorers of runs?
Percentage more = $$\frac{37500-18750}{18750}\times\ 100$$
= $$\frac{18750}{18750}\times\ 100$$
= 100%
Question 201
The following pie-chart shows the percentage distribution of the expenditure incurred in publishing a book. Study the pie-chart and answer the questions based on it.
Royalty on the book is less than the paper cost by:
Production of cars in M4 = 24000 Production of cars in M2 = 32000 Therefore, Required percentage = $$\dfrac{24000}{32000}\times100 = \dfrac{3}{4}\times100 = 75$$%
Question 203
The pie chart given below shows the imports of 7 different items P1, P2, P3, P4, P5, P6 and P7 as a percentage of total imports of a country.
If the total import of item P1 is ₹ 33000, then what is the value of imports of item P2?
Let total imports of all items be Rs.x Imports of P1 = 11% of x Given, 11% of x = Rs.33000 => x = $$33000 \times \dfrac{100}{11} = Rs.300000$$ Then, Imports of P2 = 23% of 300000 = Rs.69000
Question 204
The Pie-chart given here shows the percentage of candidates selected in an Examination from 2012 to 2016.
Total number of candidates selected in 2012 and 2014 together is:
Total student in A=$$\frac{20}{100}\times1800=360$$
ratio of Boys:girl=4:5
number of girls=200
number of boys=160
Total student in B=$$\frac{18}{100}\times1800=324$$
ratio of Boys:girl=1:2
number of girls=216
Total Student in A & B=360+324=684
number of boys=108
Total boys in A & B=160+108=268
Total girls in A & B=416
ratio of boys and girls in the colleges A and B taken together=268:416=67:104
Question 207
The table shows the production of different types of cars by a company (in thousands) in 5 years.
If the data related to the production of cars in 2018 is represented by pie chart, then the central angle of the sector representing the production of type C cars will be:
Total exports of cars of type A in 2014 and 2018 = 200 + 300 = 500 Total exports of cars of type B in 2015 and 2016 = 250 + 200 = 450 Ratio of the total exports of cars of type A in 2014 and 2018 to the total exports of cars of type B in 2015 and 2016 = 500 : 450 = 10 : 9 $$\therefore$$ The correct answer is option B.
Question 210
Study the following table, (which shows the number of units of an item manufactured and sold by 5 companies) and answer the question.
Which Company sold the highest percentage of units as compared to manufactured by it?
Percentage of units sold compared to manufactured by A=(30/42)*100=71.42 Percentage of units sold compared to manufactured by B=(32/45)*100=71.11 Percentage of units sold compared to manufactured by C=(26/36)*100=72.22 Percentage of units sold compared to manufactured by E=(40/54)*100=74.07 Answer is E
Question 211
The bar chart given below shows the ratio of expenditure to revenue for seven consecutive years Y1, Y2, Y3, Y4, Y5, Y6 and Y7.
Difference between the mean and the median of the number of children = 1.77-1.5
= 0.27
Question 214
The Pie chart given below presents the distribution of costs of making a water bottle by a company. If the company earns 20% on cost per bottle and the cost of packaging one bottle is ₹0.50, then what is the selling price of one bottle?
If the company earns 20% on the cost per bottle and the cost of packaging one bottle is ₹0.50.
cost of packaging one bottle = 5% = ₹0.50
1% = ₹0.10
The total cost of making a water bottle = 100% = ₹10
The profit on each bottle is 20% of the cost price.
So the selling price of one bottle = ₹10 of (100+20)%
= ₹10 of 120%
= ₹12
Question 215
The pie chart given below shows the annual snowfall received by 7 states of a country. The snowfall is shown as a percentage of total annual snowfall of the country.
If the annual snowfall received by the country is 700 cm. What is the difference in the annual snowfalls of S3 and S2?
Given, Annual snowfall received by the country = 700 cm Snowfall received by S2 = 15% of 700 Snowfall received by S3 = 20% of 700 Difference between the snowfall of S2 and S3 = 20% of 700 - 15% of 700 = 5% of 700 = 35 cm.
Question 216
The Pie chart shows the proportionate population of seven villages. The seven villages make up a district. If the population of villages F and G combined is 35000, then what is the total population of the district?
If the population of villages F and G combined is 35000.
total population of villages F and G = (20+25)y = 35000
45y = 35000 Eq.(i)
Total population of the district = (6+9+7+15+8+20+25)y
= 90y
= $$2\times45y$$
Put Eq.(i) in the above.
= $$2\times35000$$
= 70000
Question 217
The pie charts shows the percentage market share of different companies in the market for the year 2017 and 2018. The total sale increased from 150 crores to 225 crores during 2017 to 2018. What is the ratio of sales of Company D in the year 2018 to its sales in the year 2017?
The Bar graph given below presents the number of female employees working in two factories on six different days of a week.
What is the ratio of the average number of females working in factory F2 per day during Days D1, D2, D3 to the average number of females working in factory F1 per day during days D4, D5, D6?
Ratio of the average number of females working in factory F2 per day during Days D1, D2, D3 to the average number of females working in factory F1 per day during days D4, D5, D6 = $$\frac{\left(186+212+224\right)}{3}\ :\ \frac{\left(328+336+444\right)}{3}$$
= $$\frac{622}{3} : \frac{1108}{3}$$
= 311 : 554
Question 223
The Bar graph shows the profit(Rupees in Lakhs) earned by two companies P and Q during the period 2011 to 2017.
In which year company P earns the maximum profit as compared to the previous year?
In 2012, company P's profit decreased by 7 lakh from the previous year.
In 2013, company P's profit increased by 20 lakh from the previous year.
In 2014, company P's profit decreased by 3 lakh from the previous year.
In 2015, company P's profit increased by 18 lakh from the previous year.
In 2016, company P's profit decreased by 20 lakh from the previous year.
In 2017, company P's profit decreased by 5 lakh from the previous year.
Hence in 2013 company P's profit increased maximum as compared to the previous year.
Question 224
The following pie-chart shows the percentage distribution of the expenditure incurred in publishing a book. Study the pie-chart and answer the questions based on it.
What is the central angle of the sector corresponding to the expenditure incurred on binding?
We know that Profit = $$\dfrac{R-E}{E}\times100$$ where R = Revenue, E = Expenditure Given, Revenue = Rs.38100, Profit = 27% $$\dfrac{38100-E}{E}\times100 = 27$$
The Pie chart depicts the allocation of the revenue towards the expenses of a particular company. If the company's sales are ₹4000000 and 75% of the revenue is allocated towards expenses, then what is the total amount spent on Wages and Delivery?
Total amount spent on Wages and Delivery = (23+12)% = 35% = $$35\times30000$$
= ₹1050000
= ₹10,50,000
Question 227
The Pie chart given below presents the expenses incurred by different departments of a company. Each expense is shown as a percentage of total expenditure of the company. The central angles shown in Pie chart are not as per any chosen scale.
If the total expenses of the company is ₹20 lakhs, then what is the total expenses on departments D2, D4 and D5?
The Table shows the number of articles sold by six different sellers (A, B, C, D, E and F)to two different shopkeepers P and Q. Some articles are purchased by other sellers also. Total articles purchased by shopkeepers P and Q is 300 and 500 respectively.
What is the average number of articles sold to shopkeeper P by the sellers A, B, C and D together?
average runs per match scored by Shikhar = $$\frac{1050}{25}$$ = 42
average runs per match scored by Rohit = $$\frac{840}{20}$$ = 42
The difference between average runs per match scored by Shikhar and average runs per match scored by Rohit = 42-42
= 0
Question 233
The table shows the production of different types of cars (in thousands).
If the data regarding the production of cars of type B is represented by a pie-chart. then the angle of the sector representing the production of cars in 2016 will be:
The total production of car of type B $$=39+45+54+60+72=270$$
The production of the car of type B in 2016 $$=60$$
Hence, the required angle $$=\dfrac{360\times 60}{270}=\dfrac{4\times 60}{3}=80^\circ$$
Question 234
The table shows the production of different types of cars (in thousands).
If the data related to the production of type C cars is represented by a pie-chart, then the central angle of the sector representing production of cars in 2012 will be:
Question 235
This table shows the number of students studying in various streams in different colleges.
What is the ratio of the number of students studying science in colleges A and B together to the number of students studying commerce in colleges D and E together?
the total number of selected candidates for the years 2012 and 2015 taken together is [(20+10)% = 30%] of the total number of selected candidates selected for all the given years. It means that the year which contains 30% will be the answer.
Here the year 2016 has 30% of the total selected candidates.
Question 239
The pie chart given here shows the spendings of a country on various sports during a particular year. Study the graph carefully and answer the questions given below it.
If the total amount spent on sports during the year be ₹18000, the amount spent on Cricket exceeds that on football by (in ₹):
average milk sold per day by Milkman 1 = $$\frac{28+34+38+37+53+58+63+67}{8}$$
= $$\frac{378}{8}$$
= 47.25
average milk sold per day by Milkman 2 = $$\frac{31+32+43+41+49+59+62+69}{8}$$
= $$\frac{386}{8}$$
= 48.25
Difference between the average milk sold per day by Milkman 1 and the average milk sold by Milkman 2 per day = 48.25-47.25
= 1
Question 242
The Table shows the number of cars sold by three show rooms over a period of six years.
If the total number of cars sold by all three show rooms over the years is represented as a pie-chart, what is the central angle of the sector representing the total number of cars sold in the year 2013 (to the nearest whole number)?
Total sales over the years for showrooms A,B and C = 9000
If 9000 corresponds to 360$$\degree$$ in a pie chart
then total sales of year 2013 -1510 will correspond to $$\frac{360 \times 1510}{9000} = 60.4\degree$$
So , the answer would be option c)60$$\degree$$
Question 243
Study the following graph which shows the production (in thousands)of different items, and answer these questions.
The difference between the total number of Shoes and Shirts produced by the company in the year 2016 and the number of Pants produced by the company in the year 2014 is:
Total number of Shoes and Shirts produced by the company in the year 2016 = 25000 + 30000 = 55000
Number of Pants produced by the company in the year 2014 = 15000
=> Required difference = 55000 - 15000 = 40000
=> Ans - (A)
Question 244
Study the Table Properly and answer by interpreting the data The table shows the percentage population of five districts in a state below poverty line and the proportion of males and females.
If the total population in the district D3 is 40,000, then what is the population of below poverty line in the district D3, ?
average maximum temperature of the city per day for the given ten days = $$ \frac{38.3 + 40.3 + 30.0 + 28.7 + 35.0 + 37.4 + 38.2 + 39.3 + 40.2 +12.2 }{10} $$
= $$ \frac{339.6}{10} = 33.96 $$
Question 246
The Bar graph given below presents the number of books sold by a book seller during different months of a year.
The number of books sold in month M3 is what percent of books sold in month M6?
The given Pie Chart (central angles are not as per any chosen scale) presents the percentage of the number of refrigerators of five different companies (with reference to the total number of refrigerators) in a hotel.
What is the difference between the central angles (to the nearest 0.1 degree) subtended by the sectors for C2 and C4?
Average rainfall for city 1 = $$\frac{565}{7}$$ = 80.71
Average rainfall for city 2 = $$\frac{566}{7}$$ = 80.85
Difference between them = 0.14
So, the answer would be option b)0.14 mm ~ 0.15mm
Question 250
The table shows the production of different types of cars (in thousands).
What is the ratio of the total production of type A cars in 2017 and type C cars in 2014 taken together to the total production of type B cars in 2014, type C cars in 2017 and type E cars in 2018 taken together?
This table shows the percentage of students passing out of five different colleges over three years. It is given that from each college, 200 students appeared every year.
What is the approximate percentage increase in the number of students passing out of college B in the year 2017 as compared to the previous year?
Question 252
The bar chart given below shows the annual production (in 1000 tonnes) of coffee of a country for years 2009 to 2013.
What is the average production (in 1000 tonnes) of coffee from year 2009 to 2011?
Production of coffee in 2009 = 800000 tonnes Production of coffee in 2010 = 1200000 tonnes Production of coffee in 2011 = 1500000 tonnes Average production = $$\dfrac{800000+1200000+1500000}{3} = \dfrac{3500000}{3} = 1166666.67$$ tonnes Average production in 1000 tonnes = 1166.67
Question 253
The following table shows the percentage distribution of students in various disciplines from five different colleges.
The number of students from the discipline of Economics from college B is approximately what percentage of the number of students from the discipline of Science from the college C?
The total selected candidates in 2015 = 720 of 10%
= 72 Eq.(i)
Total selected candidates in 2013 = 720 of 25%
= $$720\times\frac{25}{100}$$
= $$720\times\frac{1}{4}$$
= 180 Eq.(ii)
percentage less = $$\frac{\left(Eq.(ii)-Eq.(i)\right)}{Eq.(ii)}\times\ 100$$
= $$\frac{\left(180-72\right)}{180}\times\ 100$$
= $$\frac{108}{180}\times\ 100$$
= $$\frac{108}{18}\times10$$
= 60%
Question 256
The table below shows the number of students enrolled in five colleges over the five years (2010 to 2014).
What is the ratio of the total students enrolled in colleges A and B in the year 2012 to the total students enrolled in colleges D and E in the year 2013?
Total marks obtained by P2 = $$100+52+55+85+70=362$$
=> Required average = $$\frac{362}{5}=72.4$$
=> Ans - (A)
Question 259
The Table presents the amount of milk (in litres) sold by two milkmen in eight days.
If A is the total amount(in litres) of milk sold by milkman 1 in day 2 and day 3, and B is the total amount(in litres) of milk sold by milkman 2 in day 7 and day 8 then (B - A) is equal to:
If A is the total amount(in litres) of milk sold by milkman 1 in day 2 and day 3.
A = 34+38
= 72
B is the total amount(in litres) of milk sold by milkman 2 in day 7 and day 8.
B = 62+69
= 131
So (B - A) = 131-72
= 59
Question 260
The table shows the production of different types of cars (in thousands)
The ratio of the total production of type A cars in 2014 and 2016 and type cars in 2013 taken together to the total production of type B cars and type D cars taken together in 2014 is:
Question 261
Study the following line graph and answer the question based on it.
The production of Company Y in 1998 was approximately what percent of the production of Company X in the same year
The production of Company Y in 1998 is 99k The production of Company X in 1998 is 121k 99k=100% 121k=(121000/99000)*100 =122.22%
Question 262
Table shows the production of rice (in million tonnes) of three states over six years.
If the total production in three states in all six years is represented by a pie-chart, what is the central angle of the sector representing production in the year 2014, (to nearest whole number)?
Total production of the rice in the year of 2014 $$=6.2+4.8+6.4=17.4$$million tonnes
Total production of the rice in all the six years $$=100$$ million tonnes
Hence the angle subtended at the center $$=\dfrac{17.4\times 360}{100}=62.64 ~ 63^\circ$$
Question 263
The bar chart given below shows the amount of sugar used in making 7 different varieties of sweets S1, S2, S3, S4, S5, S6 and S7 has been shown as a percentage of total weight of the sweet.
The total weight of sweet S4 is 150 kg. What is the amount of sugar used in sweet S4?
Given, Total weight of the sweet S4 = 150 kg Percentage of sugar used in S4 = 18% Then, Amount of sugar used in S4 = 18% of 150 = $$\dfrac{18}{100}\times150 = 27 kg$$
Question 264
The bar chart given below shows the annual production (in 1000 tonnes) of coffee of a country for years 2009 to 2013.
What is the percentage increase in the production of coffee in the year 2011 as compared to year 2010?
Annual Production of 2010 = 1200000 tonnes Annual Production of 2011 = 1500000 tonnes Therefore, Required Percentage = $$\dfrac{1500000 - 1200000}{1200000}\times100 = \dfrac{300000}{1200000}\times100 = 25$$%
Question 265
The following table indicates the number of students studying in three disciplines in five colleges:
What is the ratio of the total number of students studying in the science stream to that of studying in commerce stream in all five colleges taken together?
total number of student studying in science stream in all five college $$=300+350+275+400+275=1600$$ total number of student studying in commerce stream in all five college$$=250+400+325+275+250=1500$$ Hence, the required ratio$$=\dfrac{1600}{1500}=\dfrac{16}{15}$$
Question 266
The Pie chart given below presents the expenses incurred by different departments of a company. Each expense is shown as a percentage of the total expenditure of the company. The central angles shown in Pie chart are not as per any chosen scale
The expenses incurred by department D1 is approximately what percent of the expenses incurred by department D6?
Let's assume the total expense of all the departments together is 100.
The expenses incurred by department D1 = 100 of 19% = 19
The expenses incurred by department D6 = 100 of 12% = 12
Percentage = $$\ \frac{19}{12}\times\ 100$$
= 158.33%
Question 267
The Pie chart given below presents the percentages of the number of motor cycles of different colours out of the total number of motor cycles, parked in an area. The central angles shown in the Pie chart are not as per any chosen scale.
What is the central angle (nearest to one degree) corresponding to the motorcycle of black colour?
The average number of laptops manufactured by a company from 2008 to 2012 = $$\frac{\left(14400+20500+12800+16400+18600\right)}{5}$$
= $$\frac{82700}{5}$$
= 16540
Question 271
The table shows the production of different types of cars (in thousands).
If the data related to the production of type B cars is represented by a pie chart, then the central angle of the sector representing the production of cars in 2016 is:
Question 272
The Table shows the production of different types of cars (in thousands).
In the data related to the production of type D cars is represented by a pie chart, then the central angle of the sector representing production of cars in 2015 will be:
As per the given data in the question, Total production of the type D car $$=25+45+40+55+35=200$$ Production of the type D car in 2015 $$=45$$ Hence the required angle $$=\dfrac{45}{200}\times 360=81^\circ$$
Question 273
The table shows the production of different types of cars (in thousands).
The total production of type E cars in 2012 and 2013 is approximately what percent more than the average production of type A cars during the years 2012 to 2016?
The bar graph shows the number of cars sold by a distributor in each month from January to June. How many more cars did he sell in the second quarter as compared to the first?
Number of cars sold in first quarter = 100+85+60 = 245 Number of cars sold in second quarter = 95+110+70 = 275 Therefore, 30 more cars sold in second quarter than first quarter.
Question 276
The data below shows the number of batsmen having different batting averages.
For the different ranges of batting average, we can take averages of those.
40-44 ==>$$\frac{40+44}{2}\ =\ 42$$
44-48 ==> $$\frac{44+48}{2}\ =\ 46$$
48-52 ==> $$\frac{48+52}{2}\ =\ 50$$
52-56 ==> $$\frac{52+56}{2}\ =\ 54$$
56-60 ==> $$\frac{56+60}{2}\ =\ 58$$
Mean batting average per batsman = $$\frac{42\times12+46\times10+50\times8+54\times6+58\times4}{12+10+8+6+4}$$
= $$\frac{504+460+400+324+232}{40}$$
= $$\frac{1920}{40}$$
= 48
Question 277
The following Pie chart shows the market share of exporting countries. If a country X constitutes 40% of the share of ‘other countries’ and the quantity of exports by Country B is ₹15 million, then the quantity exported by Country X, is:
The number of units of the product sold in 2016 = 470
average production of the units in 2012 to 2016 = $$\frac{320+338+432+256+504}{5}$$
= $$\frac{1850}{5}$$
= 370
Percentage more = $$\frac{\left(470-370\right)}{370}\times\ 100$$
= $$\frac{100}{370}\times\ 100$$
= 27.027%
= 27% approx.
Question 279
The given Pie Chart (angles are not as per any chosen scale) presents the marks scored by Amit in five subjects. Maximum marks in each subject = 100. Total score of Amit = 450.
In how many subjects, did Amit score more than his average score?
Ratio of Imports to Exports of Y5 = $$0.95 = \dfrac{95}{100} = 95 : 100$$ Let imports be Rs.95x and exports be Rs.100x Given, 95x = Rs.76000 => x = Rs.800 Then, Exports = Rs.100x = Rs.100*800 = Rs.80000
Question 281
The pie chart given below shows sale of different types of cars in a city for a given year. The total sale of cars in the city is 600000.
What is the sum of total number of cars sold of type T5, T6 and T3?
Cars sold of type T3 = 13% of 6 lakhs Cars sold of type T5 = 17% of 6 lakhs Cars sold of type T6 = 8% of 6 lakhs Therefore, Total cars sold of type T3, T5 and T6 = 13% of 6 lakhs + 17% of 6 lakhs + 8% of 6 lakhs = 38% of 6 lakhs = 228000
Question 282
The pie chart given below shows the time taken in 7 different procedures J1, J2, J3, J4, J5, J6 and J7 in making a car as a percentage of total time taken. The total time taken in making one car is 1200 hours.
What is the average time taken in procedures J3, J6 and J7?
Total time taken in making one car = 1200 hours Time taken in J3 = 20% of 1200 Time taken in J6 = 16% of 1200 Time taken in J7 = 12% of 1200 Total time taken in J3, J6, J7 = (20+16+12)% of 1200 = 48% of 1200 = 576 hours Average = 576/3 = 192 hours.
Question 283
The Table given below presents the marks obtained by three students in five examinations.
What is the sum of marks obtained by S1 in Exam E4, S2 in Exam E1, S3 in Exam E3 and E5?
the sum of marks obtained by S1 in Exam E4, S2 in Exam E1, S3 in Exam E3 and E5
S1 in Exam E4, = 96
S2 in Exam E1 = 84
, S3 in Exam E3 = 82
, S3 in Exam E5 = 84
sum = 84 + 82 +84 + 96 = 346
Question 284
The table shows the number of candidates appearing for an interview for a post in six Banks (H, I, J. K, L, M) and the percentage of qualifying candidates.
What was the respective ratio of the number of candidates who qualified in bank H to the number of candidates who qualified in bank L?
Production for 2011 = 1500000 tonnes Production for 2009 = 800000 tonnes Therefore, Required percentage $$= \dfrac{1500000}{800000}\times100 = \dfrac{1500}{8} = 187.5$$%
Question 287
The pie chart given here shows the spendings of a country on various sports during a particular year. Study the chart carefully and answer the questions given below it.
How much percent less is spent on Football than that on Cricket?
Percentage less is spent on Football than that on Cricket$$= \frac{81-54}{81}\times 100 = 33\frac{1}{3}\% $$
Option A is correct.
Question 288
The pie charts show the market share of companies in the rice market in 2017 and 2018. The value of sales of Company A in 2017 was ₹40 lakhs. If its sales grew by 25% in 2018, what was approximate value of sales of company B in 2018?
Value of sales of Company A in 2017 = Rs.40 lakhs Value of sales of Company A in 2018 = 125% of Rs.40 lakhs = Rs.50 lakhs which is 27% of sales of all companies 27% --> Rs.50 lakhs 7% --> $$\dfrac{7 \times 50}{27} = 12.96$$ lakhs
Question 289
This table shows the number of students studying in various streams in different colleges.
The number of students in the science stream of college C is approximately what percentage of students studying in that college?
the number of boys in school A =(9/17)*680 =360 the number of girls in school E =(12/25)*900 =36*12 =432 Ratio=360:432 =5:6
Question 291
Study the Table Properly and answer by interpreting the data. The table given the percentage of result by four different classes in the five different year of examination:
In Which year the average performance is maximum in all the four classes?
Average performance is maximum in the year in which total performance is maximum.
(A) : 2016 = 55 + 45 + 32 + 38 = 170
(B) : 2015 = 50 + 48 + 38 + 35 = 171
(C) : 2013 = 70 + 65 + 62 + 58 = 255
(D) : 2012 = 90 + 80 + 85 + 75 = 330 [max]
=> Ans - (D)
Question 292
The bar chart given below shows the amount of sugar used in making 7 different varieties of sweets S1, S2, S3, S4, S5, S6 and S7 has been shown as a percentage of total weight of the sweet.
The combined weight of sweet S5 and S3 is 300 kg. What is the total amount of sugar used in these two sweets together?
Since the individual weights of S3 and S5 is not given, individual amount of sugar used in S3 and S5 cannot be determined. Hence, Total amount of sugar used in S3 and S5 cannot be determined.
Question 293
The Bar graph given below presents the amount (volume in litres) of water in ten different mixtures.
the growth percentage in the number of employees from Y5 to Y6
Y5 = 5326
Y6 = 5918
= $$\frac{(5918-5326)}{5326}\times100$$ = 11.11 %
Question 296
The given pie chart shows the quantity wise sales distribution of five products (A, B, C, D and E) of a company in 2016. Quantity wise sales distribution of five products (A, B, C, D and E)
If 320 units of product A were sold by the company, then how many units of products B and E together were sold by the company?
Units sold of product A by company = 320 50$$\degree$$ = 320 Units sold of product B and E by company = 35 + 55 = 90$$\degree$$ 90$$\degree$$ = $$\frac{320}{50} \times 90$$ = 576
Question 297
The Pie chart given below presents the percentages of the number of motor cycles of different colours out of the total number of motor cycles, parked in an area. The central angles shown in the Pie chart are not as per any chosen scale.
If the total number of motorcycles parked is 2300, then what is the number of red colour motor cycles out of them?
If the total number of motorcycles parked is 2300.
100% = 2300
1% = 23
number of red colour motor cycles out of them = 12% = $$12\times\ 23$$
= 276
Question 298
The table below indicates the percentage of students and the ratio of boys and girls in the various streams of a college. (Total students = 2600)
If the data about the number of girls enrolled in the various streams is represented by a pie-chart, what is the central angle of the sector representing the number of girls in the ME stream, to the nearest whole degree?
The ratio of the total production of type A cars in 2017 and type D cars in 2015 = $$64+56$$ = $$120$$
the total production of type B and type E cars in 2013 = $$47+43$$ = $$90$$
hence $$\frac{2017(typeA )+(2015 type D)}{2013typeB + 2013 type E}$$
= $$\frac{64 + 56}{47 + 43}$$
= $$\frac{120}{90}$$
= by simplifying we get $$4:3$$
Question 302
The table shows the production of different types of cars (in thousands).
The total production of type E cars in 2015 and type C cars in 2013 taken together is what percent of the total production of type A cars and type D cars taken together during 2012 to 2016?
Question 303
The table shows the production of different types of cars (in thousands).
The average production of all type of cars in 2014 is approximately what percent less than the total production of type B cars in 2013 and type D cars in 2010 taken together?
The table shows the production of different types of cars (in thousands).
If the data related to the production of type D cars is represented by a pie-chart, then the central angle of the sector representing the production of cars in 2017 will be:
Number of units produced by A = 900 units Number of units produced by B = 700 units Number of units produced by C = 300 units Therefore, Required Average = $$\dfrac{900+700+300}{3} = 633.33 = 633\dfrac{1}{3}$$
Question 306
Study the following table and answer questions:
Number of candidates appeared in an examination from five cities:
The number of cities, in which pass percentage of candidates is more than 55%,is:
Thus, in 3 cities, pass percentage of candidates is more than 55%.
=> Ans - (A)
Question 307
The bar chart shows the annual food grain production (in million tonnes) for years 2012-2017. For how many years is the production less than the average production during the given period?
average production = $$\frac{2400+3300+3000+3900+1800+3600}{6}$$
= $$\frac{18000}{6}$$
= 3000
In two years (2012 and 2016) the production is less than the average production during the given period.
Question 308
The Bar graph given below presents the number of males and females working in five different companies.
The total number of males working in these five companies is how much percent (approximately) more than the total number of females working in these five companies?
The ratio of average profit during the given period for Company P to Company Q = $$\frac{\left(32+25+45+42+60+40+35\right)}{7}$$ : $$\frac{\left(48+40+55+50+36+20+35\right)}{7}$$
= $$\frac{279}{7}$$ : $$\frac{284}{7}$$
= 279 : 284
Question 311
The following table presents the number of units of a product produced and sold by a company during six years.
In which year, the production of units of the product is approximately 31.4% less than the sale of units in 2017?
This question can be solved by checking each of the options one by one.
Option (a) 2012
Percentage less = $$\frac{\left(630-320\right)}{630}\times\ 100$$
= $$\frac{310}{630}\times\ 100$$
= 49.2%
Option (b) 2016
Percentage less = $$\frac{\left(630-504\right)}{630}\times\ 100$$
= $$\frac{126}{630}\times\ 100$$
= 20%
Option (c) 2014
Percentage less = $$\frac{\left(630-432\right)}{630}\times\ 100$$
= $$\frac{198}{630}\times\ 100$$
= 31.42%
Option (d) 2013
Percentage less = $$\frac{\left(630-338\right)}{630}\times\ 100$$
= $$\frac{292}{630}\times\ 100$$
= 46.34%
So the required percentage is in the year 2014 which is given in option (c).
Question 312
The pie charts show the market share of the companies in the detergent market in 2017 and 2018. The total size of the market has decreased from ₹ 300 crores to ₹ 200 crores. What is the decrease in the sales of Company F?
Sales of Company F in 2017 = 10% of Rs.300 crore = Rs.30 crore Sales of Company F in 2018 = 13% of Rs.200 crore = Rs.26 crore Decrease in sales = $$\dfrac{30-26}{30}\times100 = \dfrac{40}{3}$$% $$= 13\dfrac{1}{3}$$%
Question 313
The table given below shows the number of students enrolled in different courses of different colleges.
What is the difference in the total number of students enrolled in colleges C3 and C4?
The ratio of the total amount in ICICI bank ATM in 500 denomination to the total amount in ICICI bank ATM in 200 denomination = $$500\times200$$ : $$200\times175$$
= $$5\times8$$ : $$2\times7$$
= $$5\times4$$ : $$1\times7$$
= 20 : 7
Question 316
The table given below shows the production of rice and the area under rice cultivation of a country for 5 consecutive years Y1, Y2, Y3, Y4 and Y5.
What is the percentage change in the yield per square meter of Y5 as compared to Y1?
Number of students appeared in an examination from five cities:
The total number of students who appeared in the examination from cities C and D is what percent more than the total number of students who failed in cities A, B and E? (nearest to an integer)
The following pie-chart shows the percentage distribution of the expenditure incurred in publishing a book. Study the pie-chart and answer the questions based on it.
If for a certain quantity of books, the publisher has to pay ₹30,600 as printing cost, then what will be amount of paper cost to be paid for these books?
Ratio of Imports to Exports of Y3 = 1.1 = $$\dfrac{11}{10} = 11 : 10$$ Let imports be Rs.11x crore and exports be Rs.10x Give, 10x = 35000 = > x = 3500 Then, Imports = Rs.11x = Rs.11$$\times$$3500 = Rs.38500.
Question 323
The line graph shows the scores of a batsman in 6 consecutive matches.
His batting average = $$\dfrac{20+11+78+23+45+58}{6} = \dfrac{235}{6} = 39.17$$
Question 324
The Pie chart given below presents the percentages of the number of motor cycles of different colours out of the total number of motor cycles, parked in an area. The central angles shown in the Pie chart are not as per any chosen scale.
If the total number of motor cycles parked is 2300, the number having white colour is how much less than those having the blue colour?
the number having white colour is 69 less than those having the blue colour.
Question 325
The Table given below presents the number of books on different subjects kept on separate shelves. Subjects with odd and even numbers are of Arts and Science respectively.
The number of books of S3 is what percent (correct to one decimal place) of the average number of Science books?
Average number of cars sold by show room A over the given six years = $$\frac{Total number of cars sold by show room A over the given six years}{number of years}$$
Required average = $$\frac{\left(580+460+320+470+370\right)}{5}=440$$
Question 329
Study the following bar graph and answer the question given.
The total production of motorcycles of companies C, D and E is what per cent less than the total demand of motor cycles of all the companies during five years?
The total production of motorcycles of companies C, D and E = 72 + 75 + 40 = 187 The total demand of motor cycles of all the companies during five years = 50 + 45 + 60 + 65 + 55 = 275 Required percentage = $$\frac{275 - 187}{275} \times 100 = \frac{88}{275} \times$$ 100 = 32%
Question 330
The Bar graph given below presents the number of female employees working in two factories on six different days of a week.
What is the difference (correct up to two decimal places) in the average number of females working per day in a factory F1 and the average number of females working per day in a factory F2?
Total number of mathematics student in the class A $$=8000\times \dfrac{40}{100}=3200$$
Total number mathematics student in the class C $$=15000\times\dfrac{35}{100}=5250$$
Hence, total number of student in mathematics in the A and C$$=3200+5250 =8450$$
Total number of available student in the class A and C $$=8000+15000=23000$$
Hence, the required percentage $$=\dfrac{8450\times 100}{23000}=36.7\%$$
Question 333
The given pie chart shows the breakup of total number of the employees of a company working in different offices (A, B, C, D and E). Total No. of employees = 2400
If the percentage of male employees in office C is 20% and that of female employees in E is 40%, then what is the ratio of the number of female employees in C to that of female employees in E?
Employees in office C = 2400$$ \times \frac{54}{360}$$ = 360 Female employees in office C = 100- 20 = 80% = 360 $$\times \frac{80}{100} = 288$$ Employees in office E = 2400$$ \times \frac{72}{360}$$ = 480 Female employees in office E = 480 $$\times \frac{40}{100} = 192$$ Ratio of the number of female employees in C to that of female employees in E = 288 : 192= 3 : 2
Question 334
The line graph shows the scores of a batsman in 6 consecutive matches. What is the range of his scores?
Highest score of all 6 matches = 63 runs in 5th match Lowest score of all 6 matches = 10 runs in 1st match Range = Highest score - Lowest score = 63-10 = 53
Question 335
The pie chart given below shows sale of different types of cars in a city for a given year. The total sale of cars in the city is 600000.
What is the difference in the number of cars sold of type T5 and T1?
Number of cars sold of T1 = 20% of 6 lakhs Number of cars sold of T5= 17% of 6 lakhs Required difference = 20% of 6 lakhs - 17% of 6 lakhs = 3% of 6 lakhs = 18000
Question 336
The pie chart given below shows the annual snowfall received by 7 states of a country. The snowfall is shown as a percentage of total annual snowfall of the country.
If the annual snowfall received by the country is 700 cm, then what is the monthly snowfall received by S5?
Let total imports be x units Then, Imports of P5 = 12% of x = 0.12x Imports of P6 = 21% of x = 0.21x Then, Required percentage = $$\dfrac{0.21x-0.12x}{0.12x}\times100 = \dfrac{0.9x}{0.12x}\times100 = \dfrac{3}{4}\times100 = 75$$%
Question 338
The Table given below shows the number of students having obtained different marks.
Total production of type B car in all the five years $$=54+45+47+50+40=236$$ thousands
Total production of car of type A, B and D in 2017 $$=43+50+67=160$$ thousands
Hence the required percentage $$=\dfrac{236-160}{160}=\dfrac{76\times 100}{160}=47.5\%$$
Question 340
The table shows the production of different types of cars (in thousands).
The total production of type A cars in 2016 and type E cars in 2014 taken together is what percent of the total production of type C cars during 2014 to 2018 ?
total number of units manufactured by C and E together is 36+54=90 units total number of units sold by A and D together is 30+36=66 units ratio=90/66 =15:11
Question 344
The bar chart given below shows the ratio of expenditure to revenue for seven consecutive years Y1, Y2, Y3, Y4, Y5, Y6 and Y7.
Exports of year with lowest exports(in 1000 crores) = 500 in Y1 Exports of year with second highest exports(in 1000 crores) = 1200 in Y4 Therefore, Required ratio = 500 : 1200 = 5 : 12
Question 346
The Bar graph given below presents the marks (out of 100) obtained by 10 students in a subject.
The marks obtained by S5 is how much percent more than the average marks of the students (correct to two decimal)?
Re-writing the given data in the form of a series Number of people who save Rs.5 = 1 --> 5 Number of people who save Rs.15 = 3 --> 15,15,15 Number of people who save Rs.20 = 4 --> 20,20,20,20 Similarly, Writing all the numbers in the form of series 5,15,15,15,20,20,20,20,25,25,30,35,40,40 Here, The middle values are 20,20 Median = $$\dfrac{20+20}{2} = \dfrac{40}{2} = 20$$
Question 349
The given Bar Graph presents the Export of Tea and Coffee (in million kg) for the years 2012 to 2016.
The number of years, in each of which the export of coffee is more than 20% as compared to the export of tea in that year is:
Percentage more = $$\frac{450-400}{400}\times\ 100$$
= $$\frac{50}{400}\times\ 100$$
= 12.5%
2013
Percentage more = $$\frac{470-350}{350}\times\ 100$$
= $$\frac{120}{350}\times\ 100$$
= 34.28%
2014
Percentage more = $$\frac{630-500}{500}\times\ 100$$
= $$\frac{130}{500}\times\ 100$$
= 26% 2015
Percentage more =$$\frac{500-420}{420}\times\ 100$$
= $$\frac{80}{420}\times\ 100$$
= 19.04%
2016
Percentage more = $$\frac{600-480}{480}\times\ 100$$
= $$\frac{120}{480}\times\ 100$$
= 25% In three years(2013, 2014 and 2016), the export of coffee is more than 20% as compared to the export of tea in that year.
Question 350
The Pie chart given below presents the expenses incurred by different departments of a company. Each expense is shown as a percentage of the total expenditure of the company. The central angles shown in Pie chart are not as per any chosen scale
What is the difference between the central angles subtended by the segments D2 and D3?
Difference between the central angles subtended by the segments D2 and D3 = 23%-17%
= 6%
= $$6\times3.6^{\circ\ }$$
= $$21.6^{\circ\ }$$
Question 351
The table below shows the percentage of students and the ratio of boys and girls in different colleges. Total students = 1800
What is the percentage of girls in colleges D, E and F taken together, (nearest to one decimal place)?
Question 352
The Table presents the amount of milk (in litres) sold by two milkmen in eight days.
The total amount of milk (in litres) sold by milkman 2 in all 8 days is what percent(correct to one decimal place) more than the total amount of milk sold by milkman 1 in the first six days?
The table shows the production of different types of cars (in thousands).
The total production of type A cars in 2011, and type C cars and type E cars in 2012 taken together is what percent of the total production of type B cars during 2010 to 2014?
The total number of girls in schools B and C=720*(5/9)+540*(13/18) =400+390 =790 the total number of boys in schools A and D=680*(9/17)+660*(2/3) =360+440 =800 percentage required=(10/800)*100 =1.25%
Question 357
The given bar graph shows the imports and exports (in ₹ crores) of steel by a country from 2013 to 2017.
The total imports of steel in 2014, 2016 and 2017 is what percent less than the total exports in 2013, 2015 and 2017 (correct to one decimal place)?
The total imports of steel in 2014, 2016 and 2017 = 360 + 500 + 550 = 1410 Total exports in 2013, 2015 and 2017 = 400 + 600 + 650 = 1650 Required percentage = $$\frac{1650 - 1410}{1650} \times 100 = \frac{240}{1650} \times 100 = 14.54$$
Question 358
The given Pie Chart (angles are not as per any chosen scale) presents the marks scored by Amit in five subjects. Maximum marks in each subject = 100. Total score of Amit = 450.
The total marks scored by Amit in English and S. Studies is what percent (correct to one decimal place) more than the marks scored by him in Maths?
The pie chart given below shows the time taken in 7 different procedures J1, J2, J3, J4, J5, J6 and J7 in making a car as a percentage of total time taken. The total time taken in making one car is 1200 hours.
What is the difference between the time taken in processes J1 and J4?
Percentage of time required for J1 = 14% Percentage of time required for J4 = 8% Required difference = 14-8 = 6% of 1200 = 72 hours
Question 360
The table below shows the number of students enrolled in five colleges over the five years (2010 to 2014).
The number of students studying in college E in the year 2013 is approximately what percent of the number of students studying in colleges B, C and D taken together in the year 2013 (nearest to one decimal place)?
No. of students in college B,C and D in 2013=310+370+420 = 1100
=$$\frac{430}{1100}\times\ 100$$
=39.1%
Question 361
The table shows the production of different types of cars (in thousands).
The ratio of the total production of cars of type C and E taken together in 2013 to the total production of cars of type D in 2014 and 2016 and type E in 2017 taken together is:
Total production of the car of type C and E in the 2013 $$= 52+36=88$$
Total production of the car of type D in 2014 and 2016 and type E in 2017 $$=42+46+55=143$$
Hence, the required ratio $$=\dfrac{88}{143}=\dfrac{8}{13}$$
Question 362
Study the following table, (which shows the number of units of an item manufactured and sold by 5 companies) and answer the question.
What percent of total number of units sold by companies A, B and D is equal to the number of units manufactured by company C? (correct to one decimal place)
the average number of books sold per month = $$\frac{232+262+297+313+328+332+365+389+413+433+457+481}{12}$$
= $$\frac{4302}{12}$$
= 358.5
Difference = 389-358.5
= 30.5
The number of books sold in month M8 is 30.5 more than the average number of books sold per month.
Question 364
The bar graph shows the number of paintings sold by an art gallery in each month from January to June. How many paintings does it need to sell in July for the 7 month average to be 90?
Since the values of imports or exports of each year is not given, data is insufficient.
Question 369
The pie chart given here shows the spendings of a country on various sports during a particular year. Study the chart carefully and answer the questions given below:
What percent of the total spendings is spent on others?
The Table given below presents the number of books on different subjects kept on separate shelves. Subjects with odd and even numbers are of Arts and Science respectively.
What is the ratio of the total number of books on Arts to that of Science?
Total number of books of Arts = S1 + S3 + S5 + S7 = 137
Total number of books of Science = S2 + S4 + S6 = 101
Their ratio = 137:101
So, the answer would be option c)137:101
Question 373
This table shows the number of students studying in various streams in different colleges.
If the data about students of the commerce stream in all colleges is represented by a pie-chart, what is the central angle of the sector representing college D, to the nearest degree?
In pie chart $$360^\circ$$=100% and 1% = $$\frac{18}{5}\ \ or\ \ 3.6^{\circ}$$
Total students of commerce = 480+520+350+520+330=2200
central angle of the sector representing college D= $$\frac{520}{2200}\times\ 100\times\ 3.6=85\%$$
Question 374
This table shows the percentage of students passing out of five different colleges over three years. It is given that from each college, 200 students appeared every year.
In which college the average percentage of passing students over the given three years is the least?
Question 375
DIRECTION: The population of a city is 8000. They have various types of occupation which is given below by the pie-chart. Study the pie-chart and answer the given questions.
The ratio of people working in service to industry sectors respectively:
Average export = $$\frac{400 + 450 + 600 + 440 + 650}{5} = \frac{2540}{5} = 508$$$ 80% of the average exports = 508 $$\times \frac{80}{100} = 406.4 3 years were the imports more than 80% of the average exports (per year) of the country during the given 5 year.
Question 379
The pie chart given below shows the time taken in 7 different procedures J1, J2, J3, J4, J5, J6 and J7 in making a car as a percentage of total time taken. The total time taken in making one car is 1200 hours.
What will be the total taken in procedures J2 and J5?
= $$\frac{680}{150}\times\frac{1000}{100}=45.33$$ kg
=> Ans - (C)
Question 381
The table shows the number of candidates appearing for an interview for a post in six Banks (H,I, J. K, L, M) and the percentage of qualifying candidates.
What was the average number of candidates who appeared for the interview in bank H, J and L together?
The average number of candidates who appeared for the interview in bank H, J and L together = $$\frac{(1500+3000+1200)}{3}$$
= $$\frac{5700}{3}$$
= 1900
Question 382
The Table shows the number of students from different schools playing different games.
If the data about the number of students who play hockey from different schools is represented by a pie-chart, what is the central angle of the sector representing students who play hockey from school C to the nearest whole number?
The number of students who obtained less than 300 marks = 30 + 45 + 60 = 135 The number of students who obtained 350 or more marks = 40 + 35 = 75 Required percentage = $$\frac{135 - 75}{75} \times100 = \frac{60}{75} \times100$$ = 80%
Question 384
The given pie-chart shows the break-up of total marks obtained by a student in five subjects A, B, C, D and E. The maximum marks in each subject is 150 and he obtained total of 600 marks.
In how many subjects did the student obtain more than his average score?
Average marks = 600/5 = 120 Average marks in degree = $$\frac{120}{600} \times 360 = 72\degree$$ In 2 subjects did the student obtain more than his average score.
Question 385
The given pie-chart shows the break-up of total marks obtained by a student in five subjects A, B, C, D and E. The maximum marks in each subject is 150 and he obtained total of 600 marks.
The total marks obtained by the student in subjects C and E is approximately how much per cent more than what he obtained in A and D together?
The total marks obtained by the student in subjects C and E = 68 + 76 = 144$$\degree$$ The total marks obtained by the student in subjects C and E = 600 $$\times \frac{144}{360} = 240$$ The total marks obtained by the student in subjects A and D = 60 + 72 = 132$$\degree$$ The total marks obtained by the student in subjects A and D = 600 $$\times \frac{132}{360} = 220$$
The given pie chart shows the quantity wise sales distribution of five products (A, B, C, D and E) of a company in 2016. Quantity wise sales distribution of five products (A. B, C, D and E)
In 2016,if a total of 14616 units were sold, then the number of units of products D sold was:
Average demand of motorcycles = $$\frac{50 + 45 + 60 + 65 + 55}{5} = \frac{275}{5} = 55$$ The number of companies whose production of motorcycles is equal to or more than the average demand of motorcycles = 4
Question 388
The given pie-chart shows the break-up of total marks obtained by a student in five subjects A, B, C, D and E. The maximum marks in each subject is 150 and he obtained total of 600 marks.
What is the difference between the marks obtained by the student in subjects B and D?
Difference between the marks obtained by the student in subjects B and D = 84$$\degree - 72\degree = 12\degree$$ Marks obtained by the student in subjects B and D = 600 $$\times \frac{12}{360}$$ = 20
Question 389
The given pie chart shows the breakup of total number of the employees of a company working in different offices (A,B, C, D and E). Total No. of employees = 2400
If 40% of the number of employees in office A are shifted equally to office B and E, then what is the difference between the number of employees in B and that in C?
Employees in office A = 2400 $$\times \frac{126}{360}$$ = 840 40% employees of office A = 840 $$\times \frac{40}{100} = 336 Number of employee in equal two parts = 336/2 = 168 Employees in office B = 2400 $$\times \frac{18}{360}$$ = 120 Total employees in office B after shifting = 120 + 168 = 288 Employees in office C = 2400 $$\times \frac{54}{360}$$ = 360
Difference between the number of employees in B and that in C = 360 - 288 = 72
Instructions
The given bar chart. shows the sales of books (in thousand number) from six branches of a publishing company during two consecutive years 2000 and 2001.
Question 390
In the given bar-chart, total sales of branches B1, B3 and B5 taken together for both the years (in thousand numbers) is:
Total sales of B1(in thousands) = 105+80 = 185 Total sales of B3(in thousands) = 95+110 = 205 Total sales of B5(in thousands) = 75+95 = 170 Total sales of B1, B3 and B5 together(in thousands) = 185+205+170 = 560
Question 391
In the given bar-chart, the ratio of total sales of branches B1, B3 and B5 to total sales of branches B2, B4 and B6 taken together for both the years (in thousand numbers) is:
Total sales of B1(in thousands) = 105+80 = 185 Total sales of B3(in thousands) = 95+110 = 205 Total sales of B5(in thousands) = 75+95 = 170 Total sales of B1, B3 and B5 together(in thousands) = 185+205+170 = 560 Total sales of B2(in thousands) = 75+65 = 140 Total sales of B4(in thousands) = 85+95 = 180 Total sales of B6(in thousands) = 70+80 = 150 Total sales of B2, B4 and B6 together(in thousands) = 140+180+150 = 470 Therefore, Ratio = 560 : 470 = 56 : 47.
Instructions
The following table shows the number of students of 7 college participating in extra curricular activities:
Question 392
The different of the range of number of students in activity IV and the average of number of students in activity III per college is
Question 393
Percentage of the number of students in activity II to that of IV is
In 2007 minimum number of persons were killed in coalmines other than those killed in industrial accidents
The minimum number of persons killed in coal mines is 150
Instructions
The Table shows the production of different types of cars (in thousands).
Question 407
The total production of type D cars during 2015 to 2017 is what percent less than the total production of type E cars during 2014, 2015, 2016 and 2018 taken together?
Total production of type D car in 2015 to 2017 $$=45+40+55=140$$
Total production of type E cars during 2014, 2015, 2016 and 2018 $$=40+48+52+60=200$$
Hence the required percentage $$=\dfrac{(260-140)\times 100}{260}=\dfrac{60\times 100}{200}=30\%$$
Question 408
The total production of type C cars in 2015 and type E cars in 2015 taken together is what percent of the total production of cars in 2014 and 2017 taken together ?
Total production of the type C car in 2015 and type E car in 2015 $$=42+48=90$$
Total production of cars in 2014 $$=64+48+33+25+40=210$$
Total production of cars in 2017 $$=63+64+57+55+61=300$$
Hence, total production of the cars in 2014 and 2017 taken together $$=300+210=510$$
Hence the required percentage $$=\dfrac{90\times 100}{510}=17.64\%$$
Nearest value is $$20\%$$
Instructions
The pie-chart provided below gives the distribution of land (in a village) under various food crops. Study the pie-chart carefully and answer the questions.
Question 409
If the total area under bajra was three hundred acres, then the total area (in hundred acres) under rice and barley togetheris
Question 410
The combination of three crops which contribute to more than 50% of the total area under the food crops is
Question 411
The ratio of the land used for rice and barley is
Question 412
If 10% of the land reserved for rice be distributed to wheat and barley in the ratio $$2 : 1$$, then the angle corresponding to wheat in the new pie-chart will be
Question 413
If the production ofrice is 5 times that of jowar and the production of jowar is 2 times that of bazra,thenthe ratio between the yield per acre ofrice and bazra is
Instructions
The bar graph provided below represents the production of rice and wheat in different states of a country in the certain year. Answer the questions.
Question 414
The average of production of rice in the mentioned states (in lakh tonnes) is
Question 415
The total production of rice and wheat in all the mentioned states in minimum in the state
Marks obtained by A in Maths = 88 Marks obtained by A in Science = 86 Marks obtained by A in English = 66 Therefore, Total marks obtained by A = 88+86+66 = 240 marks.
Question 420
What is the difference between A’s and C’s total marks in the exam?
Marks obtained by A in Maths = 88 Marks obtained by B in Maths = 65 Marks obtained by C in Maths = 72 Therefore, Average marks = $$\dfrac{88+65+72}{3} = \dfrac{225}{3} = 75$$ marks.
Instructions
Read the following Table and Answer the questions that follow:
The table given below shows the number of applicants who have applied for exam at various centres as percentage of total number of applicants. The table also shows the number online applicants and absent applicants as a percentage of total applicants of each centre. Total number of applicants is 1200000.
Question 422
If A equals to 15% of total applicants who are present at exam centre F and B equals to present applicants at exam centre K, then A is what percent of B?
Question 423
Total number of offline applicants from exam centre H, K and F are how much less than the total number of present applicants from exam centre G and J?
total number of offline applications from F=(15/100)*(70/100)*1200000 =126000 total number of offline applications from H=(20/100)*(48/100)*1200000 =115200 total number of offline applications from K=(16/100)*(62/100)*1200000 =119040 Sum=360240 Total number of present applicants from G=(1/4)*(3/4)*1200000 =225000 Total number of present applicants from J=(24/100)*(82/100)*1200000 =236100 sum=461160 Difference=461160-360240 =100920
Question 424
What are the total number of offline applicants from the exam centre F, H, J and G?
total number of offline applications from F=(15/100)*(70/100)*1200000 =126000 total number of offline applications from H=(20/100)*(48/100)*1200000 =115200 total number of offline applications from J=(24/100)*(54/100)*1200000 =155520 total number of offline applications from G=(25/100)*(56/100)*1200000 =168000 Sum=564720
Question 425
What is the ratio of total number of present applicants from exam centre K to total number of offline applicants from exam centre J?
Total number of present applicant from K=(16/100)*(80/100)*120000 Total number of offline applicants from J=(54/100)*(24/100)*120000 Ratio=(16*80)/(54*24) =80/81
Question 426
What are the total number of present applicants from exam centre H and G together?
From G total number of applicants present=(1/4)*(3/4)*1200000 =225000 From G total number of applicants present=(1/5)*(68/100)*1200000 =163200 Sum=388200
Instructions
The table shows the production of different types of cats (in thousands).
Question 427
The total production of type B cars in 2012, 2014 and 2015 taken together is approximately what percent more than the total production of type A cars in 2013 and 2016 taken together?
Total sales of B in 2014 and 2016 = 480 + 400 =880
Total sales of C in 2015 and 2016 = 540 + 430= 970
Required ratio = $$\frac{880}{970} =\frac{88}{97}$$
So , the answer would be option b)88:97.
Question 430
By what percent did the total number ofcars sold by all three show rooms decrease during the year 2016, as compared to that in the year 2015 (nearest to one decimal place)?
The table shows the production of different types of cars (in thousands).
Question 431
The total production of cars of type B in 2013, 2014, 2015 and 2017 taken together is what percent less than the total production of all types of cars in 2017 ? (Correct to one decimal place) ?
Total production of cars of type B in 2013, 2014, 2015 and 2017 taken together $$=39+45+54+72=210$$
Total production of all types of cars in 2017 $$=255$$
Hence, the required percentage $$=\dfrac{(255-210) \times100}{255}=\dfrac{4500}{255}=17.64\%$$
Hence the required percentage = 17.64%
Question 432
The production of cars of type A in 2015 and of type C in 2013 taken together is approximately what percent of the total production of cars of type D in five years ?
The production of car of type A in 2015 and type C in 2013 taken together$$ =48+52=100$$
Total production of car of type D in all five years $$=50+42+45+46+47=230$$
Hence, the required percentage $$=\dfrac{(100)\times 100}{230} \cong 43.5%$$
Instructions
The table given below shows the number of students who were absent and percentage of students who were present in the given two examinations from five different schools. The table also shows the percentage of students who were present in the Biology and Physics examination respectively.
Question 433
What is the difference between the number of students who were present in Physics and Biology examination from school N?
If the number of students who were present in the Physics examination from school A is 250% of the difference of the number of the students who were present in Physics and Biology examination, from school K, then what is the ratio of the number of students who were present from school L to number of students who were present in Physics examination from school A?
Total number of students in K= $$\frac{83300}{0.35}=238000.$$
Students present in K= $$238000\times0.65=154700.$$
So, difference in Present in Physics and Biology in K= $$154700\times\left(0.68-0.32\right)=55692.$$
So, Present in physics in A= $$55692\times2.5=139230.$$
Total students present in L= $$\frac{101520}{0.40}\times0.6=152280\ .$$
So, required ratio = $$\frac{152280}{139230}=\frac{1692}{1547}\ .$$
B is correct choice.
Instructions
The Table shows the Number of Laptops and Desktops manufactured by a company.
Question 438
What was the difference in the total number of Laptops and Desktops manufactured in 2009 to the total number of Laptops and Desktops manufactured in 2011?
The difference in the total number of Laptops and Desktops manufactured in 2009 to the total number of Laptops and Desktops manufactured in 2011 = (20500+24700)-(16400+20200)
= 45200-36600
= 8600
Question 439
Approximately what was the percentage decrease in number of desktops manufactured in 2012 from 2011? (correct to nearest integer)
The average production of type D car $$\dfrac{46+50+54+67+68}{5}=57$$ thousand
Production of type E car in 2018 $$=70$$
Hence the required percentage $$=\dfrac{(70-57)\times 100}{70}=\dfrac{13\times 100}{70}=18.6\%$$
Question 441
What is the ratio of the total production of type C cars in 2015 and type D cars in 2017 taken together to the total production of type B cars in 2016 and type A cars in 2017 taken together?
Average of the total number of runs scored by all four batsmen together = $$\frac{900+840+1050+450}{4}$$
= $$\frac{3240}{4}$$
= 810
Instructions
Read the given pie-chart and answer the questions below.
Question 448
what is the total expenditure (in percent) on labour charges?
Question 449
the expenditure on steel is what percent of the expenditure on cement?
Instructions
The table given below shows the information about bats manufactured by 6 different companies. Each company manufactures only plastic and wooden bats Each company labels these bats as Brand A or Brand B The table shows the number of plastic bats as a percentage of total bats manufactured by each company. It also shows the ratio of wooden bats labeled A and B. Each company manufactured a total of 550000 bats.
Question 450
What is the total number of wooden bats of brand A manufactured by company T?
N = $$\left(0.25\times\frac{14}{55}\times550000\right)\ .$$
And , M = $$\left(0.45+0.60\right)\times550000\ .$$
So, $$\frac{N}{M}=0.60606\simeq\ 0.601\ .$$
B is correct choice.
Question 452
P = Sum of wooden bats of Brand B manufactured by S and wooden bats of Brand A manufactured by W. Q = Difference of Brand B wooden bats and Brand A wooden bats manufactured by U.
total number of student in the college B $$= 350+400+450 =1200$$ total number of student in the science stream $$= 350$$
Hence, the required percentage $$\dfrac{350\times 100}{1200}=29.16\%$$ Hence, approximately $$29.2\%$$ student studying in the science stream.
Question 456
If a pie-chart is drawn representing the number of students in all five colleges, what is the central angle (correct to the nearest whole number) of the sector representing the students of college B?
From the above table, The number of students are available in college A$$ = 950$$ The number of students are available in college B $$= 1200$$ The number of students are available in college C $$= 850$$
The number of students are available in college D $$= 975$$ The number of students are available in college E $$= 1025$$
Hence, total number of students are available in the class $$= 5000$$
so percentage of area occupy by college B $$\dfrac{1200\times 100}{5000}=24\%$$
which occupy 24% of the area in the pie graph.
Hence angle $$=\dfrac{24\times360}{100}=86.6^\circ$$ So, it will be approximately $$86^\circ$$
Instructions
The table shows the production of different types of cars (in thousands).
Question 457
The total production of all type of cars, except type B, in 2012 is what percent less than the total production of all types of cars in 2016?
As per the instructions, total production of the car in 2012, except car type B $$= 54+46+33+47=180$$
Total production of all type car in 2016 $$=55+67+77+49+52=300$$
Hence, the required percentage $$=\dfrac{(300-180)\times100}{300}$$
$$=\dfrac{(120)\times100}{300}$$
$$=40\%$$
Question 458
If the data related to the production of type D cars is represented by a pie chart, then the central angle of the sector representing the production of cars in 2013 will be:
Total production of D type car $$=33+35+48+45+49=210$$
Production of D type car in 2013 $$=35$$
Hence, the required angle $$=\dfrac{360\times35}{210}=60^\circ$$
Question 459
What is the ratio of the total production of type E cars in 2014 and type C cars in 2016 taken together to the total production of type B cars in 2014 and type D cars in 2013 taken together?
The table shows the production of different types of cars (in thousands).
Question 465
The total production of type B cars in 2015 and type C cars in 2013 is what percent more that the total production of type E cars in 2013 and 2014 ? (Correct to one decimal place)
The total production of type B cars in 2015 and type C cars in 2013 is = $$58+52$$= $$110$$
the total production of type E cars in 2013 and 2014 = $$43+47$$ = $$90$$
hence use this formula Increase in percentage (%) = $$\frac{110-90}{90}$$×100
= hence use this formula Increase in percentage (%) = $$\frac{20}{90}$$×100
= 22.22%
Question 466
If the data related to the production of type D cars is represented by a pie-chart, then the central angle of the sector representing the production of the cars in 2016 will be:
Instructions
The table given below shows the production of maize by 5 different states as a percentage of total production. Each state produces only maize and rice. There are three types of rice — R1, R2 and R3. The table also shows the R1 type of rice produced as a percentage of total rice production and the ratio of R2 and R3 type of rice. Total production by each state is 625000.
Question 467
What is the difference between the R1 type of rice produced by state X and the R2 type of rice produced by state H?
A = Average of the R3 type of rice produced by state H, R, S and X together. B = Difference between the R2 type of rice produced by state T and R1 type of rice produced by state R. What is the value of B - A?
H = $$0.68\times0.40\times625000\times\frac{11}{17}=110000.$$
R = $$0.38\times0.40\times625000\times\frac{10}{19}=50000.$$
X = $$0.48\times0.40\times625000\times\frac{5}{8}=75000.$$
S = $$0.48\times0.45\times625000\times\frac{5}{9}=75000.$$
So, Average (A) = 77500.
R2 Production of T = $$0.26\times0.20\times625000\times\frac{3}{13}=7500.$$
R1 Production of R = $$0.38\times0.60\times625000=142500.$$
So, (B-A) = 135000-77500= 57500.
C is correct choice.
Question 471
F = Total production of R2 type of rice by all the states. K = Average of the total production of R1 type of rice by all the states. What is the value of K/F?
The bar graph given below shows the percentage distribution of the total production of a car manufacturing company into various models over two years.
Percentage of Six different types of Cars manufactured by a Company over Two Years
Question 474
The total producton of Type P vehicles in the years 2008 and 2011 is what percent of total production of Type Q vehicles in 2010 and 2014?
Question 475
The total production of Type P vehicles in the years 2008 and 2011 is what percent of total production of Type Q vehicles in 2010 and 2014?
Question 476
Approximate percentage decrease in production of Type Q vehicles from 2010 to 2011 is
Question 477
The ratio of total production of Type P vehicles to total production of Type Q vehicles over the years is
Question 478
In how many of the given years, was the production of Type P vehicles of the company more than the average production of this type vehicles in the given years?
average of Type p production = $$ \frac{total production}{no of years} $$ = $$ \frac{100+125+200+225+275+275}{6} $$ =$$ \frac{1200}{6} $$ = 200
years when production of type p is greater than average
2012 = 225
2013 = 275
2014 = 275
hence 3 years
Instructions
Directions: Study the following line graph to answer these questions.
Railway Time Schedule of an Express Train X Running Between City A and City H a → Arrival of the train d→ Departure of train A, B, C, D, E, F, G, and H are cities through which the train runs. a-d→ Indicates stoppage/halting of the train at the city station.
Question 479
What is the ratio of average number of females from the organisations A, B and C to the average number of males from the organisations C, D and E?
Question 480
What is the difference between the total number of females and the total number of males from all the organisations together?
Question 481
By how much percentage is the average number of females from all the organisations together is more than the number of males in organization 'D'?
Question 482
What is the ratio of the number of females from the organisations B and C to the number of males from the organisations D and E?
Question 483
Males from organisations A and B together form what percent of total number of males from organisations C, D and E together?
Instructions
The table given below shows the runs scored by 4 different batsmen B1, B2, B3 and B4 in 5 different matches of a series.
Question 484
What is the per match average numberof run scored by batsman B3?
DIRECTIONS: Study the following graph and answer the given questions. (Number of students admitted in two different School over the years:)
Question 487
What was the ratio between the number of students admitted in school A in the year 2013 and the total number of students admitted in both the school together in the year 2016?
the number of students admitted in school A in the year 2013=20 the total number of students admitted in both the school together in the year 2016=115 Ratio=4:23
Question 488
In which year the total number of students admitted in both the school together was the second lowest?
In 2013=20+35=55 In 2014=35+40=75 In 2015=50+40=90 In 2016=60+55=115 Second lowest=75 i.e 2014
Instructions
Study the following table, which shows the number of units of a product manufactured and sold by a company in five years, and answer questions.
Question 489
What percent of total units of the product manufactured in 2013 and 2015 is the total units unsold during the five years? (correct to one decimal place)
Total number of units sold in 2014 and 2015 = 315 + 280 = 595
Number of units manufactured in 2017 = 420
=> Required ratio = $$\frac{595}{420}=17:12$$
=> Ans - (A)
Instructions
The Pie Chart given below presents the number of laptops as a percentage of the total number of laptops in an office delivered by six different companies. The central angles shown in the Pie Chart are not as per any chosen scale.
Question 491
If the total numberoflaptopsin the office is 3800, then whatis the difference in number of laptops of Companies C2 and C5?
The pie chart given below, shows the expenditure on various items and savings of a family during the year 2009. Study the pie chart and answer these questions.
Question 494
If the total income of the family for the year 2009 was Rs. 1,50,000 then the difference between the expenditures on housing and transport was
% Increase in temperature on D3 = $$ \frac{35 - 30}{30} \times 100 $$
= 16.67%
Question 1
The amount proposed on Agriculture is more than that on /industries and minerals by
Question 2
The amount in crore rupees proposed on irrigation and power is less than that on industries and minerals by
Question 3
The amount proposed on education is greater than that on Roads and Communication by
Question 4
The following graph represents the maximum and minimum temperature recorded every day in a certain week. The day on which the difference between the maximum and minimum temperature was maximum is
Total production (in '000 tonnes) of company R from year 2012 to 2016
= 250 + 268 + 302 + 298 + 276 = 1394
=> Ans - (C)
Instructions
Study the following line chart carefully and answer the questions given below it. The following line chart represents the number of employees recruited in different years in a company.
Question 10
What was the ratio of number of employees recruited in the year 2010 and 2012
Question 11
The number of employees recruited in the year 2012 was what percent of the number employees recruited in the year 2014 ?
Question 12
If the total number of employees before the year 2010 was 640, then the total number of employees after 2014 was:
Question 13
If the number of employees before 2010 was 640, what was percentage increased in 2010 ?
Question 14
The number of employees recruited in 2015 was 40% more than that recruited in 2014. How many employees were recruited in 2015 ?
Instructions
The numbers of different colleges in india in different years is given in the graph below. Percent distribution of different colleges in year 1980 and 1990 is shown in pie chart
Question 15
What is the difference in number of engineering colleges in 80's and 90's
In all the five years, the number of students in stream B is more than the number of students in stream A.
=> Ans - (A)
Instructions
The data given in bar diagram relate to the department wise admission of 320 students to B.S.C. (Honours) first year classes of a certain college in the given five subjects. Study the graph and answer the questions.
Question 21
The subject in which the difference in the number of male and female students is minimum in:
Difference in the number of male and female students in the subject :
Physics = $$62-26=36$$
Chemistry = $$61-24=37$$ [Max]
Mathematics = $$30-20=10$$
Statistics = $$16-15=1$$
Economics = $$34-32=2$$
$$\therefore$$ The difference in the number of male and female students is maximum in Chemistry.
=> Ans - (D)
Question 23
The total number of male students who got admitted in Mathematics and Economics as compared to the total number of female students getting admission in Mathematics and Economics is:
The subject which the female students are finding difficult as compared to other subjects is the one in which the difference in the number of male and female students is maximum.
Difference in the number of male and female students in the subject :
Physics = $$62-26=36$$
Chemistry = $$61-24=37$$ [Max]
Mathematics = $$30-20=10$$
Statistics = $$16-15=1$$
Economics = $$34-32=2$$
$$\therefore$$ The subject which the female students are finding difficult as compared to other subjects is Chemistry.
=> Ans - (D)
Instructions
The table given below shows the runs scored by 5 players in four matches.
Question 25
What is the difference between total runs scored by A and B in four matches?
Total runs scored by A in four matches = 70 + 105 + 55 + 135 = 365
Total runs scored by B in four matches = 40 + 35 + 95 + 72 = 242
=> Required difference = 365 - 242 = 123
=> Ans - (B)
Instructions
The Pie-chart shows the result of a survey among 119060 people concerning the use of tobacco. Study the Pie-chart and answer the questions. (PIPE = $$36^\circ$$)
Question 26
Let P be the percentage of people using Cigarettes, Pipe and Bidi as their smoking means and Q be the percentage of people using other means as their smoking habits. Then P is more than Q by:
Given, number of cars of model $$C = 22,000$$ i.e $$110^{\circ}$$
$$\Rightarrow 110^{\circ} = 22,000$$
$$\Rightarrow 1^{\circ} = 200$$
Difference in the number of cars sold of model A and B = $$(45^{\circ} - 40^{\circ})$$ i.e $$5^{\circ}$$
$$\Rightarrow 5^{\circ} = (5$$ x $$200) = 1000$$
Hence, option C is the correct answer.
Instructions
The table given below shows the number of students studying in five colleges in the given five years. Study the table carefully and answer the questions.
Question 35
If in year 2011, in college N 80% of the total students appeared in a exam, out of which 50% students passed, then how many students passed the exam ?
=> Number of students who appeared in exam = $$\frac{80}{100}\times390=312$$
=> Number of students who passed the exam = $$\frac{50}{100}\times312=156$$
=> Ans - (C)
Question 36
What is the ratio of the total number of students of college N in all years to the total number of students of all the colleges studying in the year 2011 ?
By how much the average amount spent on Printing and Royalty is more (in Rs) than the average amount spent. Total amount spent on Publication is Rs. 150000 ?
For 11000 books the expenses incurred on others is Rs. 36960. If publisher wants a profit of 25%, then what should be the marked price (in Rs.) of each book ?
Number of people who do not read newspapers = 162 + 13 + 21 = 196
Number of people who read only in regional languages = 271 + 285 + 209 = 765
Number of people who read only English newspapers = 123 + 206 + 325 = 654
Number of people who read in both languages = 52 + 82 + 187 = 321
=> Total number of people surveyed = 196 + 765 + 654 + 321 = 1936
=> Ans - (D)
Instructions
The table given below shows the statistics of top 10 scorers in IPL 2016. Few entries are missing in the table. Here INN, AVG, and SR stands for innings played, batting average, and batting strike rate respectively. Based on the table answer the following question:
The sales of company B has major growth than the sales of company A in 3 months, i.e. September, October and December.
=> Ans - (B)
Instructions
The pie chart given below shows the percentage distribution of annual expenditure on various items of a company. The annual expenditure of the company is Rs. 70 Crores.
Question 55
What is the monthly expenditure (in Rs crores) on Miscellaneous by the company?
We know $$\cot\theta\ \ =\ \sqrt{\ \operatorname{cosec}^2\theta\ -1}$$ substituting we get $$\cot\theta\ \ =\ \pm\ x-\frac{1}{4x}$$ Now $$\operatorname{cosec}\theta\ +\cot\theta\ $$ =2x or 1/2x
Instructions
The pie chart given below shows the break-up of number of hours of teaching various subjects at an institute by Mr. Raghav.
Question 2
A new topic named Problem Solving was also introduced and it was decided that 10% time of all topics except Arithmetic will be devoted to it. What will be the central angle (in degrees) made by Problem Solving in the new pie chart?
Difference in time taken to teach algebra and modern Maths (in %) = 9-4 = 5%
Total time = 500 hours
=> Required time = $$\frac{5}{100}\times500$$
= 25 hours
=> Ans - (C)
Question 4
Mr. Raghav taught Geometry for 36 hours. If the time taken in teaching Ratio consitutes one-fourth of the time for Arithmetic, then for how much time (in hours) did he taught the topic of Ratio?
Time taken to teach Geometry = $$\frac{6}{100}\times100x=6x$$ hours
According to ques, => $$6x=36$$
=> $$x=\frac{36}{6}=6$$
=> Time taken to teach Arithmetic = $$\frac{46}{100}\times100x=46x$$ hours
= $$46\times6=276$$ hours
$$\therefore$$ Time required to teach ratio = $$\frac{276}{4}=69$$ hours
=> Ans - (C)
Question 5
If Data Interpretation and Modern Maths were taught for a combined time of 96 hours, then for how much time (in hours) were Number system and Geometry taught?
Time given to Data Interpretation and Modern Maths (in %) = 8+4 = 12%
Time given to Number system and Geometry taught (in %) = 23+6 = 29%
According to ques, => $$12\% \equiv 96$$ hours
=> $$29\% \equiv \frac{96}{12}\times29$$
= $$8\times29=232$$ hours
=> Ans - (D)
Instructions
The pie chart shows the annual car production (in millions) of six countries (A, B, C. D, E, F). Study the diagram and answer the following questions.
Question 6
If on an average the cost price of a car is 30000 USD and environmental tax levied on each car is 2.5% of its cost price, how much environmental tax was collected (in billion USD) from production of cars in these 6 countries?
$$\therefore$$ Number of petrol cars produced (in millions) = $$\frac{65}{100} \times 2.7$$
= 1.755
=> Ans - (A)
Instructions
The bar graph shows revenues in rupees lakhs from selling four different products (A, B, C, D) by a certain company. Study the diagram and answer the following questions.
Question 10
Revenues from which product were the least in both the years 2015 and 2016?
Students from different countries (A, B,C,D, E, F) participated in a certain seminar. The pie chart shows how many students came from each of the six participating countries. Study the diagram and answer the following questions.
Question 13
If the cost of total spending on transport for the seminar was Rs 9 lakhs and the cost of hosting the students was Rs 150000 per country then what was the ratio of hosting cost of all the students to that of spending on transport?
B is more than E by $$\frac{30-10}{10} \times 100 = 200$$
So the answer is option B.
Instructions
The bar graph shows GDP for the year 2016 In billion USD of six countries (A, B, C, D, E, F) of a regional trade block. Study the diagram and answer the following questions.
country
Question 17
If the combined GDP of the six countries has grown by 50% in the last decade, then what was their combined annual Gross Domestic Product (in billion USD) before 10 years?
The pie chart given below shows the percentage of time taken by different processes in making a car.
Question 24
15% of total time is spent on quality check and this time is equally taken from all other processes. So What will be the new sectorial angle (in degrees) made by total time of seats and glass?
Total time taken in engine and tyres (in %) = 40+11 = 51%
Now, difference in time taken by frame and glass (in %) = 22-8 = 14%
According to ques, $$51\% \equiv 127.5$$
=> $$14\% \equiv \frac{127.5}{51}\times14$$
= $$2.5\times14=35$$ hours
=> Ans - (D)
Instructions
The line chart given below shows the ratio of production to sales of two bike-manufacturing firms over the period of 6 years.
Assume if in any year sales is more than production then both the companies has sufficient stock to meet such instances.
Question 28
Company 1 sold 20000 bikes each year from 2011 to 2016 and company 2 sold 10000 bikes each year from 2011 to 2016. What is the difference (in units) in average yearly production of company 1 and 2?
Ratio of production to sales = $$\frac{p}{50000}=1.3$$
=> Production of company 1 in year 2015 = $$1.3\times50000=65,000$$ units
=> Ans - (D)
Question 30
The production of company 2 in year 2012 is 30000. If sales of company 2 in year 2012 and 2013 is same, then what was its production (in units) in year 2013?
Ratio of production to sales = $$\frac{30000}{s}=0.75$$
=> Sales of company 2 in year 2012 = $$\frac{30000}{0.75}=40000$$
According to ques, sales of company 2 in 2013 = 40000
Ratio of production to sales = $$\frac{p}{40000}=0.4$$
=> Production of company 2 in year 2013 = $$0.4\times40000=16000$$
=> Ans - (B)
Question 31
The production of company 1 in year 2014 is 18000 and sales of company 2 in year 2012 is 15000. What is the ratio of difference in sales and production of company 1 in year 2014 and company 2 in year 2012 ?
Ratio of production to sales = $$\frac{18000}{s}=0.9$$
=> Sales of company 1 in year 2014 = $$\frac{18000}{0.9}=20000$$
Difference in sales and production = $$20000-18000=2000$$
Similarly, sales of company 2 in year 2012 = 15000
Ratio of production to sales = $$\frac{p}{15000}=0.75$$
=> Production of company 2 in year 2012 = $$0.75\times15000=11250$$
Difference in sales and production = $$15000-11250=3750$$
$$\therefore$$ Required ratio = $$\frac{2000}{3750}=\frac{8}{15}$$
=> Ans - (A)
Instructions
The bar chart given below shows the sales of 3 types of cars in the Indian automotive industry over 4 years. All the sales figures have been shown in terms of '000 units.
Question 32
Which of the following type of car has the highest increase in sales from 2009 to 2012?
Total sales of Sedan (in '000 units) over the period of 4 years
= 450+500+575+625 = 2150
Total sales of SUV (in '000 units) over the period of 4 years
= 150+250+400+750 = 1550
=> Required ratio = $$\frac{2150}{1550}=\frac{43}{31}$$
=> Ans - (C)
Question 35
If all the 3 categories increase by same rate in 2013 over 2012 as they did in 2012 over 2011, then what will be the total approximate sales (in ‘000 units) of all the 3 categories taken together in year 2013 ?
If the tickets for Screen 1, Screen 2 and Screen 3 are Rs 350, Rs 300 and Rs 250 respectively, then which screen has the maximum total revenue for three shows?
Population density of country E is greater than population density of country D by $$\frac{400-200}{200} \times 100 = 100$$%
So the answer is option B.
Instructions
The pie chart shows the votes in 1000s polled in favour of six candidates (A, B, C, D, E, F) contesting for a particular seat. Study the diagram and answer the following questions.
Question 44
If Candidate A is disqualified then which candidate will be declared the winner?
The line chart given below shows the per acre yield (in million tonnes) of tea of 7 countries.
Question 46
All the countries are arranged in ascending order of per acre yield. If bottom 2 countries increases their per acre yield by 20% and all other countries increase their per acre yield by 10%, then what is the new average per acre yield (in million tonnes)?
Total per acre yield of India and China (in million tonnes) = 300+272 = 572
Total per acre yield of the remaining countries (in million tonnes) = 250+162+82+104+120 = 718
=> Required % = $$\frac{572}{718}\times100$$
= 79.66 %
=> Ans - (D)
Instructions
The table below shows the distribution of number of people living in 8 different countries and the per capita income of each of the countries. The total population of these countries taken together is 200 crores.
Per capita income = total GDP of country/population of the country
There are 5 distinct values = 200, 250, 300, 360, 450
=> Ans - (C)
Instructions
The table given below shows the ratio of exports and imports of a country for 5 years.
Total trade = exports + imports
Question 57
The total trade of 5 years is 3800, 3600, 2800, 3900 and 5000 crore dollars respectively. What is the difference (in crore dollars) in the average exports and average imports respectively?
Difference between export and import in each year respectively (in crore dollars) :
Year 1 : $$\frac{(10-9)}{(10+9)}\times3800$$ = 200
Year 2 : $$\frac{(11-7)}{(11+7)}\times3600$$ = 800
Year 3 : $$\frac{(4-3)}{(4+3)}\times2800$$ = 400
Year 4 : $$\frac{(5-8)}{(5+8)}\times3900$$ = -900
Year 5 : $$\frac{(12-13)}{(12+13)}\times5000$$ = -200
=> Required average = $$\frac{(200+800+400-900-200)}{5}$$
= $$\frac{300}{5}=60$$
=> Ans - (A)
Question 58
If the total trade of the country in year 3 was 1183 crore dollars, then what was the difference (in crore dollars) between exports and imports of the country in that year?
=> Exports of year 4 = $$\frac{5}{(5+8)}\times13x=5x$$
According to ques, => $$5x=315$$
=> $$x=\frac{315}{5}=63$$
Also, trade of year 2 = trade of year 4 = $$13\times63=819$$
$$\therefore$$ Imports of year 2 = $$\frac{7}{(11+7)}\times819$$
= $$\frac{7}{2}\times91=318.5$$
=> Ans - (D)
Question 60
Total trade of Year 1 is twice of the total trade of Year 5. If total trade of Year 1 is 5700 crore dollars, then what is the difference (in crore dollars) in exports of Year 1 and Year 5?
In 2017 the sales of each brand increased by the same percentage as it did in the year 2016. What will be the approximate average sales (in units) of mobiles per brand in year 2017?
Increase in sales of brand 1 in 2016 = $$\frac{7.5-5.5}{5.5}\times100=36.36\%$$
=> Sales of brand 1 in 2017 = $$7.5+(7.5\times\frac{36.36}{100})=10.2$$
Increase in sales of brand 2 in 2016 = $$\frac{6-5}{5}\times100=20\%$$
=> Sales of brand 2 in 2017 = $$6+(6\times\frac{20}{100})=7.2$$
Increase in sales of brand 3 in 2016 = $$\frac{7.5-6.5}{6.5}\times100=15.38\%$$
=> Sales of brand 3 in 2017 = $$7.5+(7.5\times\frac{15.38}{100})=8.625$$
Increase in sales of brand 4 in 2016 = $$\frac{9.5-8.5}{8.5}\times100=11.76\%$$
=> Sales of brand 4 in 2017 = $$9.5+(9.5\times\frac{11.76}{100})=10.545$$
$$\therefore$$ Average sales (in '000 units) of mobiles per brand in year 2017 = $$\frac{10.2+7.2+8.625+10.545}{4}$$
= $$\frac{36.57}{4}\times1000 \approx 9175$$
=> Ans - (A)
Instructions
The Pie chart 1 given below shows the segregation of 40000000 candidates who have filled the form of an examination. Pie chart 2 shows the segregation 35000000 candidates who were present in the examination. The segregation in both pie charts has been done on the basis of their highest qualification.
Question 64
If 18% of M.B.B.S. who have filled the form are from XYZ University, then how many M.B.B.S. candidates from XYZ University have filled the form?
50% of others who have filled the form are B. Arch. and 45% of others who were present in the exam are B. Arch. How many B. Arch. candidates did not gave the exam?
Candidates who applied in B.A. = $$\frac{20}{100}\times40,000,000=8,000,000$$
Candidates who appeared in B.A. = $$\frac{22}{100}\times35,000,000=7,700,000$$
=> Absentees in B.A. = $$8,000,000-7,700,000=300,000$$
Similarly, absentees in others = $$(\frac{16}{100}\times40,000,000)-(\frac{14}{100}\times35,000,000)$$
= $$6,400,000-4,900,000=1,500,000$$
Absentees in B.com = $$(\frac{21}{100}\times40,000,000)-(\frac{22}{100}\times35,000,000)$$
= $$8,400,000-7,700,000=700,000$$
Absentees in M.B.B.S. = $$(\frac{17}{100}\times40,000,000)-(\frac{14}{100}\times35,000,000)$$
= $$6,800,000-4,900,000=1,900,000$$ [MAX]
=> Ans - (D)
Instructions
The table given below represents the production and sales of wheat in 4 different countries A, B, C and D over a period of 4 years. At the end of year 2010 A, B, C and D had a stock of 5200, 3500, 7835 and 1956 (in '000 quintals) of wheat respectively. For any given year, the stock of wheat is calculated as: Stock of year (n + 1) = stock at end of year (n) + production in year (n + 1) — sales in year (n + 1) And, Surplus of year (n) = production in year (n) — sales in year (n)
Question 68
What can be said about total surplus of country B and country D over the 4 years?
Loan disbursed by bank 2 increased in 2011 and decreased in 2012. Similarly, loan disbursed by bank 2 increased in 2012 and decreased in 2013.
Only Banks 1,4 and 5 show a continuous trend of increase/decrease in loan amount disbursed over 5 years.
=> Ans - (C)
Question 75
What can be said about the two following ratios?
I. Loan amount disbursed by Bank 1 in 2011/ Loan amount disbursed by Bank 2 in 2014 II. Loan amount disbursed by Bank 3 in 2014/ Loan amount disbursed by Bank 4 in 2011
I. Loan amount disbursed by Bank 1 in 2011/ Loan amount disbursed by Bank 2 in 2014
= $$\frac{295}{122}=2.41$$
II. Loan amount disbursed by Bank 3 in 2014/ Loan amount disbursed by Bank 4 in 2011
= $$\frac{211}{123}=1.71$$
=> I > II
=> Ans - (A)
Instructions
There are six taxi companies (A, B, C, D, E, F) in a certain city. The bar graph shows the number of taxis run by each of these six companies. Study the diagram and answer the following questions.
Question 76
Which taxi company has more taxis than A but less than D?
=> Central angle = $$\frac{32}{100}\times360^\circ$$
= $$32\times3.6=115.2^\circ$$
=> Ans - (D)
Instructions
The pie chart given below shows the runs scored by a player against 6 different countries. The total runs scored by the player against these countries are 1600.
Question 88
Difference between the total runs scored against Australia and New Zealand and the total runs scored against Sri Lanka and Pakistan make what sectorial angle (in degrees) in the pie chart?
The pie chart shows the share of tiger population six Wild life sanctuaries (A, B, C, E, E, F) of a country. Study the diagram and answer the following questions.
Question 92
If the total tiger population in these six sanctuaries had grown by 20% and 25% in the previous two decades, then what was the total tiger population in these six sanctuaries before 20 years?
so, only B with 11 tigers, has more tigers than D but less than F
So the answer is option D.
Question 94
What will be the total number of tigers left in the six sanctuaries, if 3 tigers are killed by poachers in sanctuary E and 9 tigers are added to sanctuary A?
The line graph shows Net exports in million USD of a certain country (Net exports = Exports - Imports). Study the diagram and answer the following questions.
Question 96
Cumulative net exports (in million USD) from the beginning of 2011 to the end of 2014 was?
If the profits are added to the company's reserves and the reserves stood at Rs 150 lakhs at the end of 2015, what were the reserves (in Rs. lakhs) in the beginning of 2012?
Profit of the company from 2012 to 2015 (in Rs. lakhs)
= 30 - 10 + 5 + 15 = 40
Reserves at the end of 2015 = Rs. 150 lakhs
=> Reserves (in Rs. lakhs) in the beginning of 2012 = 150 - 40 = 110
=> Ans - (C)
Instructions
The bar graph shows annual Inflation in two years 2015 and 2016 of four countries (A, B, C, D). Study the diagram and answer the following questions.
Question 104
If inflation is measured as increase in price index and the price index was 200 in the beginning of 2015 in country D then what is the index at the end of 2016?
The line graph shows the record of number of admissions to a certain coaching center from 2011 to 2016. Study the diagram and answer the following questions.
Question 108
If fees charged by the coaching centre was Rs 10000 for the first 3 years and Rs 12000 for the next three years then what is the total fees (in Rs. Crores) collected by the coaching centre in the last six years?
The pie chart shows tickets sold (in 1000 s) per month by six different airlines (A, B, C, D, E, F. Study the diagram and answer the following questions.
Question 112
Which airline sold the second highest number of tickets?
Number of tickets sold by Airlines A and D (in thousands) = 5+3 = 8
Number of tickets sold by Airline E (in thousands) = 6
=> Required ratio = $$\frac{8}{6}=\frac{4}{3}$$
$$\therefore$$ The ratio of tickets sold by Airlines A and D to tickets sold by Airline E = 4 : 3
=> Ans - (B)
Question 115
If the price of an airline ticket is Rs 7000 then by what amount, monthly Revenue (in Rs. Millions) from sale of tickets of Airline B is greater than that of Airline E?
=> Revenue from sale of tickets of Airline B = $$7000\times11000=Rs.$$ $$7,70,00,000$$
Number of tickets sold in Airline E = 6000
=> Revenue from sale of tickets of Airline E = $$7000\times6000=Rs.$$ $$4,20,00,000$$
$$\therefore$$ Difference in revenues = $$Rs.(7,70,00,000-4,20,00,000)=Rs.$$ $$3,50,00,000$$
= Rs. 35 millions
=> Ans - (C)
Instructions
The table given below shows the percentage of literate people in 6 cities. This table also shows the ratio of males to females among literate people.
% of literate people of any city = (Literate people of the city / Total population of the city) x 100
Question 116
The population of the 6 cities are 250000, 200000, 220000, 300000, 150000 and 400000 respectively. Which is the correct order of the number of literate people in these cities?
=> Literate population in city 4 = $$\frac{63}{100}\times600,000$$
= $$378,000$$
=> Ans - (B)
Question 118
Total population of City 6 is 200000 and the total population of City 2 is 220000. What is the respective ratio of literate males of City 2 and literate females of City 6?
The difference between the number of shoes of Reebok and Nike = 23%-18%=5%
by verification,
The difference between the number of shoes of Puma and Adidas = 25%-21%=4%
The difference between the number of shoes of Reebok and Adidas = 25%-23%=2%
The difference between the number of shoes of Vans and Nike = 18%-13%=5%
The difference between the number of shoes of Nike and Adidas=25%-18%=7%
so the answer is option C.
Instructions
The bar graph shows the internal storage capacity (in GB) of 5 smartphones - A, B, C, D and E. Study the diagram and answer the following questions.
Question 124
If price of model E is increased by Rs 12,000 and its memory is doubled the sales remain unchanged. This implies that people are willing to pay Rs ________ per extra GB of memory space.
D would be greater (in %) than that of model B by $$\frac{8-2}{2} \times 100 = 300$$
So the answer is option A.
Question 1
The following pie chart shows proportion of poverty population of seven villages in 2009. Study the pie chart and answer the questions that follows :
If the below poverty line population of the village 'X' is 12160, then the poverty population of village 'S' is
Question 2
The table given below shows the per acre yield (in kg) of different countries. Study the graph carefully and answer the questions
India : 250
Sri Lanka :117
China : 343
Brazil : 240
Iran : 156
The average yield of the given countries is
Question 3
In the following information the production of rice per acre yield is given for few country
India : 250
Pakistan : 200
Bangladesh : 150
China : 300
Nepal : 100
By how much percentage is India's per acre yield more than that of Pakistan's?
Question 4
The following pie chart shows proportion of population of seven villages in 2009. Study the pie chart and answer the questions that follows :
The ratio of the below poverty line population of village 'T' to that of the below poverty line population of village 'Z' is
Question 5
The bar graph given below shows the per acre yield (in kg) of different countries. Study the graph carefully and answer the questions
Srilanka's yield (approximately) is what percentof total yield of all the countries?
Question 6
The following pie chart shows proportion of population of seven villages in 2009. Study the pie chart and answer the questions that follows :
If the population of the village 'R' is 32000, then the below poverty line population of village 'Y' is
Question 7
2017( rice yield in lakh kgs)
Africa : 80
Brazil: 110
China: 250
India: 200
Bangladesh: 150
Sri lanka: 140
Writing the rice yields of all countries in ascending order, the difference between the sum of yields of first three countries to that of last three countries is
Question 8
The following pie chart shows proportion of population of seven villages in 2009. Study the pie chart and answer the questions that follows :
In 2010, the population of 'Y' and 'V' increases by 10% each and the percentage of population below poverty line remains unchanged for all the villages. If in 2009, the population of village Y was 30,000, then the below poverty line population of village 'V' in 2010 is _____
Instructions
Study the following graph carefully and answer the questions:
Question 9
Which state has the maximum percentage of electrified villages? (The graph shows the percent of villages which are not electrified).
$$\therefore$$ We can clearly observe that three states (A,C and F) have at least 60% or more electrified villages.
=> Ans - (B)
Question 11
Which state has twice the percentage of villages electrified in comparison to state D? (The graph shows the percent of villages which are not electrified).
=> Percentage increase in price from 2011 to 2012 = $$\frac{105-75}{75} \times 100$$
= $$\frac{30}{3} \times 4=40\%$$
Similarly, percentage increase in price from 2012 to 2013 = $$\frac{135-105}{105} \times 100$$
= $$\frac{200}{7}\%$$
$$\therefore$$ Required ratio = $$40$$ : $$\frac{200}{7}$$
= $$40 \times \frac{7}{200} = \frac{7}{5}$$
=> Ans - (B)
Instructions
Study the pie chart carefully and answer the questions. The pie chart represents the percentage of people involved in various occupations. Total number of people = 2000
Question 20
How many more people are involved in service than in trade ?
Study the Bar diagram carefully and answer the questions. The Bar diagram shows the trends of foreign direct investment (FDI) into India from all over the World (in Rs. crores).
=> Central angle for tennis = $$\frac{10}{100} \times 360^\circ$$
= $$\frac{360^\circ}{10}=36^\circ$$
=> Ans - (A)
Instructions
Study the bar-graph given below which shows the % distribution of total expenditures of a company under various expense and answer the questions.
Question 32
If the total expenditure of the company is Rs. 20 crores, then the ratio of expenditure on transport to that on salary is? (expenditure on the interest on loans = 17.5%)
he number of students who have secured marks less than 60 =18+8+7 =33
Question 42
The average marks of the students are
Question 43
The number of students who have scored between 39 and 80 is
Question 44
Percentage of students who have secured marks more than 59 is
Instructions
In the given Pie-chart, the comparative study of the production of Rice, Wheat, Sugar and Tea of a country is given. Study the Pie-Chart and answer the following questions.
Question 45
From this diagram, the ratio of sum of wheat and sugar production to difference in production of rice and tea is
Question 46
The production of rice and tea is more/greater than production of wheat by-
Budget estimated on clothing = $$\frac{8}{100} \times 32000$$ = 2560
Budget estimated on grocery = $$\frac{20}{100} \times 32000$$ = 6400
Total = 2560 + 6400 = 8960
(METHOD II)
Total % sum on clothing and grocery = 8+20 = 28%
Estimated budget on both = $$\frac{28}{100} \times 32000$$ = 8960
=> Ans - (B)
Question 53
Due to sudden marriage, the family incurs miscellaneous expenditure of Rs. 3040 in total. Then the increase in the amount under this head from that budgeted is
Now, clearly sum of literate female and illiterate female = 35+12 = 47%
=> Ans - (A)
Instructions
Study the following bar-diagram carefully and answer the questions. The bar graph given below shows the foreign exchange reserves of a country (in million US $) from 1991 - 1992 to 1998 - 1999.
Question 60
The ratio of the number of years, in which the foreign exchange reserves are above the average reserves, to those in which the reserves are below the average reserves is
Sum of foreign exchange during the years 1991-92, 1992-93, 1993-94
= 2640 + 3720 + 2520 = 8880
Sum of foreign exchange during the years 1995-96, 1996-97, 1997-98
= 3120 + 4320 + 5040 = 12480
=> Required ratio = 8880 : 12480
= 37 : 52
=> Ans - (C)
Instructions
The following figure shows the number of students (in thousands) admitted and passed out per year in a college during years 2000 to 2004. study the figure and answer the questions.
Question 64
The percent increase in the number of students admitted in the year 2003 over that in 2001 is
Number of students admitted in the year 2002 = 8000
Total number of students passed out in the years 2003 and 2004 = 9000+9000 = 18000
Average number of students passed out in the years 2003 and 2004 = $$\frac{18000}{2}=9000$$
=> Required ratio = $$\frac{8000}{9000}=\frac{8}{9}$$
=> Ans - (B)
Instructions
A constituency is divided in four regions A, B, C and D. Two candidates X & Y contested the last election from that constituency. The adjoining graph gives the break up of voting in the four regions. Study the graph and answer the following questions.
Question 68
Approximately how much percent of voters voted in favour of X?
Number of females in India in 1961 per thousand males = $$\frac{21\times1000}{23}$$
Number of males in India in 1991 per thousand females = $$\frac{44\times1000}{41}$$
=> Required ratio = $$\frac{21\times1000}{23}:\frac{44\times1000}{41}$$
= $$21\times41:44\times23$$
= $$861:1012$$
=> Ans - (A)
Question 75
Assuming that the rate of increase in the total population in India during 1991-2001 remains the same as that was during the period 1981-1991, estimate the total population in India in 2001.
Companies having more demand than production are A and D - 2 companies.
Companies having more production than demand - 4 countries
Ratio = 2:4 = 1:2
Option B is the right answer.
Instructions
The pie-chart given below shows expenditure incurred by a family on various items and their savings. Study the chart and answer the questions based on the pie-chart
The pie-chart shows the proposed outlay for different sectors during a Five-Year plan of Government of India. Total outlay is Rs. 40,000 crores. By reading the pie-chart answer the following three questions.
The following pie-chart shows the sources of funds (InRs. crores) to be collected by the National Highways Authority of India (NHAI) for its Phase II projects. Study the pie-chart and answer the following Three questions
Question 12
The central angle corresponding to Market Borrowing is
Central angle corresponding to Market Borrowing = $$\frac{29952}{57600}$$ * 360
= 187.2°
Question 13
If the toll is to be collected through an outsourced agency by allowing a maximum 10% commission, how much amount should be permitted to be collected by the outsourced agency, so that the project is supported with Rs. 4,910 crores ?
If NHAI could receive a total of Rs. 9,695 crores as External Assistance, by what percent (approximately) should it increase the Market Borrowing to arrange for the shortage of funds ?
Study the following frequency polygon and answer the questions. Given a line graph showing the number of students passed in Higher Secondary Examination in a school over the years 2008 to 2013.
Question 23
The average of passed students in the years 2008, 2009, 2012 approximately is
A line graph is used to compare two variables. Thus, it is used for making comparisons.
Ans - (C)
Question 2
60 students were asked to choose their favourite sport. Their distribution is as follows : Football - 15 Cricket - 12 Swimming - 12 Basketball - 11 Athletics - 10 The data is illustrated in a Pie Chart. What angle should be used for football ?
The categories of qualitative variables are represented by bars where the height of each bar may be class frequency, class percentage and class relative frequency.
Question 4
Which of the following graphical representations of data represents cumulative frequencies ?
The Cumulative frequency curve for a grouped frequency distribution is obtained by plotting the points and then joining them by a free-hand smooth curve.
This is also known as ogive.
Ans - (D)
Question 5
The following pie-chart shows the monthly expenditure of a family on food, clothing, rent. miscellaneous expenses and savings. What is the central angle for savings ?
=> Central angle for savings = 360° - (108°+90°+36°+72°)
= 360° - 306° = 54°
Question 6
The pie - chart gives the expenditure (in percentage) on various items and savings of a family during a month. Monthly savings of the family is 3,000. On which item is the expenditure maximum and how much is it ?
The ratio of the total number of people surveyed who take coffee more than 3 times a day to the total number of people who do not take coffee at all is
Rate of one barrel of crude oil in 1995 = Rs 25.60
=> Total value of imports = Rs (25 * 25.60) lakhs
= 640 lakhs = 6.4 crore
Instructions
The distribution of fruit consumption in a sample of 72 seventeen – year – old girls is given in the graph below. Study the graph and answer the questions.
Distribution of fruit consumption
Question 25
How many of these girls ate fewer than two servings per day ?
Angle subtended by expenses on cement in 1991 = 108°
=> % of total amount spent on cement = $$\frac{108}{360}$$ * 100
= 30%
Question 29
The percentage increase in the amount spent on labour from 1991 to 2001, given that the total amount spent on the construction of the house is 3,60, 000 in 1991 and ‘8,64,000, in 2001 is
=> Amount spent on steel in 1991 = $$\frac{50}{360}$$ * 3,60,000
= 50,000
Total amount spent in 2001 = 8,64,000
Angle subtended by steel in 2001 = 60°
=> Amount spent on steel in 2001 = $$\frac{60}{360}$$ * 8,64,000
= 1,44,000
Instructions
The pie chart given below represents the modes of transport for 1400 officers of the Staff Selection Commission, Kolkata. Study the chart and answer the following questions.
Question 31
The ratio of two-wheelers and cars being used as modes of transport is
=> No. of officers using cars = $$\frac{21}{100}$$ * 1400 = 294
Instructions
The production figures of a perfume manufacturer are given in the form of percentage in sub-divided bar diagram. Study the diagram and answer the questions.
Question 35
What is the ratio of percentage production of rose perfume during 1995 to that during the year 1997 ?
Clearly, the group of students having height between 150-160 cm is maximum (25).
Instructions
The adjoining pie-chart shows the proportional expenditure on various items of Amar’s family. If monthly income of Amar is 48,000, answer the questions.
Question 47
Had his income be 40,000 how much would be spent on food ?
Expenditure on transport and education = (15 + 5)% = 20%
Difference in expenditure = 5% of 48,000 = Rs. 2400
Hence, option A is the right answer.
Instructions
The sub divided bar diagram given below depicts the result of Class XII students of a school for three years. Study the diagram and answer the questions given below :
Question 51
The percentage of students passed with Second class in the year 2000 is
Cost estimated by a family in renovation of its house Total cost estimate Rs. 2,40,000
During the process of renovation the family actually incurs miscellaneous expenditure of Rs. 20,400. The miscellaneous expenditure incurred by the family is what percent of the total estimated cost?
Now Total estimated cost = 2,40,000 Now actual Miscellaneous expenditure = 20,400 Now therefore miscellaneous expenditure as expressed in percentage to total cost = $$\frac{20,400}{2,40,000}\times\ 100$$ = 8.5%
Question 6
In a certain country, allocations to various sectors of the yearly budget per Rs.1000 crores are represented by this pie-diagram. The expenditure (in Rs.) on Agriculture is
A health drink company prepares the drinks of three different flavours P, Q, R. The production of three flavours over a period of sixyears has been expressed on bar graph provided below. Study the graph and answer the questions.
(Production of 3 different flavours of health drinks of a company in 6 years in Lakh bottles)
Question 7
In which of the following years the percentage of rise or fall in production from the previous year is maximum for the flavour of Q?
=> % decline in production = $$\frac{60-40}{60}$$ * 100
= $$\frac{20}{60}$$ * 100 = 33.33%
Question 11
What is the difference between the average production of flavour Q in 2008. 2009 and 2010 from that of flavour P in 2005, 2006 and 2007 in lakh bottles is :
students passed in 2nd division in the year 2010 = 60
students appeared for exam in the year 2010 = 200
percentage = $$\frac{60}{200}\times100=30$$%
so the answer is option A.
Instructions
The following bar diagram shows the percentage of Hindus, Sikhs and Muslims in a state during the years from 2004 to 2007. Examine the bar diagram and answer the following questions.
Question 26
The ratio between the Hindu and Sikh population in 2004 was
Question 27
If the total population of the state in 2004 was 5 lakhs, then the Hindu and Muslim population in that year was
Question 28
If the total population of the state in 2005 was 5 million, then the Hindu population was [1 million = 10,00,000]
Instructions
The sub divided bar diagram given below depicts H.S. Students of a school for three years. Study the diagram and answer the questions.
In the graph, ratio of income to expenditure is given, while exact value of income or expenditure is not provided.
Hence, % decrease in income cannot be determined.
Data inadequate
Ans - (D)
Question 39
If the income shows positive growth in every year throughout the period (2000 - 2005), then in how many years the expenditure shows a positive growth ?
=> % increase in production = $$\frac{1200-600}{600}$$ * 100
= $$\frac{600}{600}$$ * 100 = 100%
Instructions
In the following questions, the pie-chart shows the number of students admitted in different faculties of a college. Study the chart and answer the questions.
Question 44
How many students are more in commerce than in law if 1000 students are in science?
=> Total no. of students = $$\frac{1000}{100}$$ * 360 = 3600
Instructions
The following bar diagram shows the percentage of Hindus, Sikhs and Muslims in a state during the years from 2004 to 2007. Examine the bar diagram and answer the following questions.
Question 47
The ratio between the Hindu and Sikh population in 2004 was
Clearly, least no. of 4 students. is for the 0-10 marks .
Instructions
The following pie chart shows the marks obtained by a student in an examination, who scored 720 marks in all. Study the diagram and answer the questions given below.
average income = $$\frac{30+50+40+60+60}{5}=\frac{240}{5}$$=48lakhs
income is more than 48lakhs in 2001, 2003 & 2006.
so the answer is option A.
Instructions
In the following questions, the following Bar Diagram shows the percentage of 7 coloured balls sold in 5 shops A, B, C, D and E. All the five shops sold an equal number of balls. Study the graph and answer all the questions.
Question 11
In shop A, the ratio of percentage of violet balls and yellow balls is :
Let us assume that each shop sells100 balls. Now, total number of balls = 500. Total yellow balls = 20+5+15+0+30 = 70 Percentage = 70/500 = 14/100 = 14%. Option C is the right answer.
Question 14
The difference between the sum of percentages of violet balls sold to the sum of percentages of blue balls sold is
Since all the shops sold equal number of balls and we are asked to find the ratio, we can directly use the percentages involved. Total percentage of violet balls = 35+0+0+15+0 = 50 Total percentage of blue balls = 10+0+15+0+0 = 35 Difference in percentage = 15%
Option B is the right answer.
Question 15
The ratio of total number of red balls sold to the total number of orange balls sold is :
Since all the shops sell the same number of balls, total number can be equated to total percentage (Since ratio is asked) Total number of redballs sold = 0 + 35+0+ 20+ 45 = 100 Total number of orange balls sold = 30 + 30+ 35 + 50 = 145
Ratio = 100:145 = 20:29 Option D is the right answer.
Instructions
The number of mobile simcards in 4 states are given in multiple bar diagrams. Study the diagram and answer the questions.
Question 16
In Assam, the ratio of Aircell simcard and Airtel simcard sold is:
percentage of simcards sold in Gujarat = $$\frac{46}{121}=38.02\sim38$$%
so the answer is option B.
Instructions
Study the graph carefully and answer the following questions. Profit Earned by a company (in crore rupees) during certain years
Question 21
If the income in the year 2003 was 60 crores and the expenditure of that year equals the expenditure of the year 2005, the income of the company (in crore rupees) in 2005 was
% increase in profit = $$\frac{5}{70}\times100=7.142\sim7$$
so the answer is option C.
Instructions
Directions : Population of the five adjacent areas of a town, in the year of 2020, are represented in the following Pie-chart. The ratio of the numbers of males to that of females in these areas are states in the table below. The total of the population in all the five areas is 72 lakh. Study the Pie-chart and the table and then answer the questions.
Ratio of number of males(M) to females(F)
Question 26
12 lakh in the population of the area
Question 27
The number of males in the areas S1 and S4 together is
Instructions
The following graph shows the demand and production of cotton by 5 companies A, B, C, D and E. Study the graph and answer questions BAR DIG
Question 1
What is the ratio of companies having more demand than production to those having more production than demand?
The following graph shows the production of wheat flour (in 1000 tonnes) by three companies X, Yand Z over the years. Study the graph and answer the questions.
Question 5
What is the difference between the production of company Z in 2004 and company Yin 2000 (in thousand tonnes) ?
Average production of X for 5yrs = $$\frac{300+450+250+500+400}{5}=380$$
Average production of Y for 5yrs = $$\frac{250+350+350+500+400}{5}=370$$
Average production of Z for 5yrs = $$\frac{350+400+450+350+350}{5}=380$$
so the answer is option A.
Instructions
Directions : The following graph shows the production of cotton bales of 100 kg each in lakhs by different states A, B, C, D and E over the years. Study the graph and answer the following Questions.
Question 9
In which State(s) is there a steady increase in the production of cotton during the given period?
Only in A and C there is a steady increment in production of cotton as in D and E , It is decresed and in B production is equal for two years. Hence answer will be C).
Question 10
How many kg of cotton was produced by State C during the given period?
Production of C in year 2003-2004 = 6 per 100 kg in lakh
in year 2004-05 = 11 per 100 kg in lakh
in year 2005-06 = 15 per 100 kg in lakh
Total will be 32 per 100 kg in lakh or 320000000 kg
Question 11
The number of States for which the production of cotton in 2005-2006 is less than or equal to the preceding year is
In B, production is same as its previous year whether in C , it is decreased.
Instructions
Directions :The pie chart, given here, represents the number of valid votes obtained by four students who contested election for school leadership. The total number of valid votes polled was 720. Observe the chart and answer the questions based on it.
Number represented in pie-chart are in degrees.
 91- 6303239042


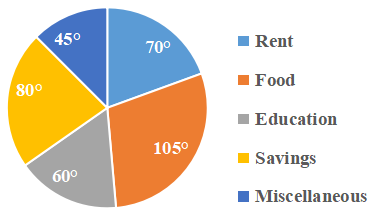

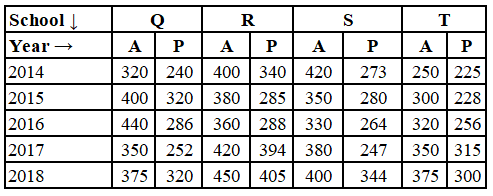


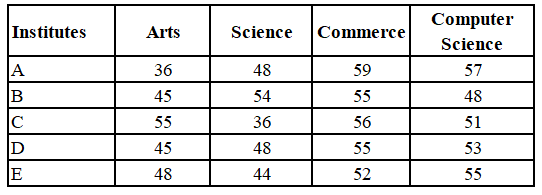
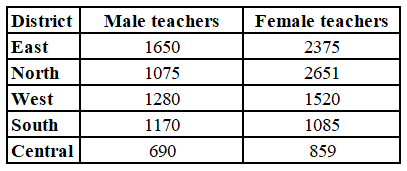


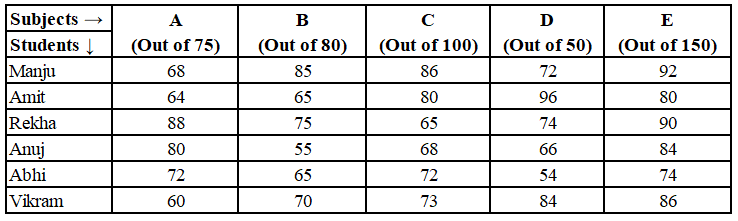
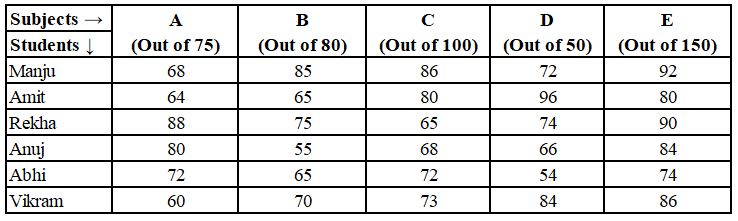


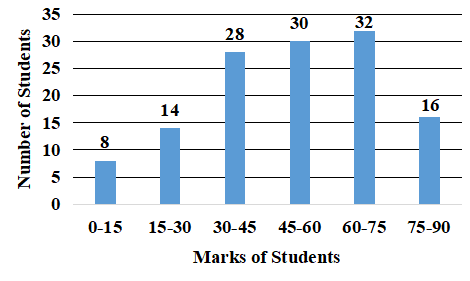
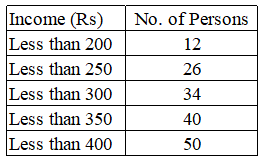

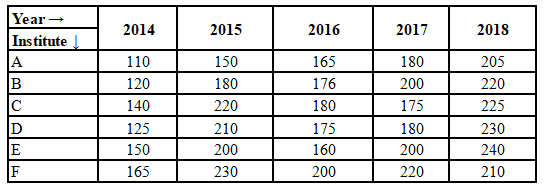


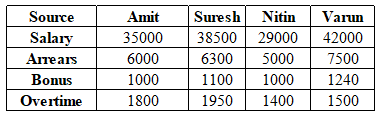
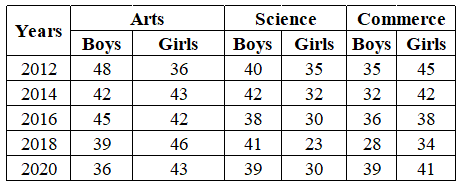


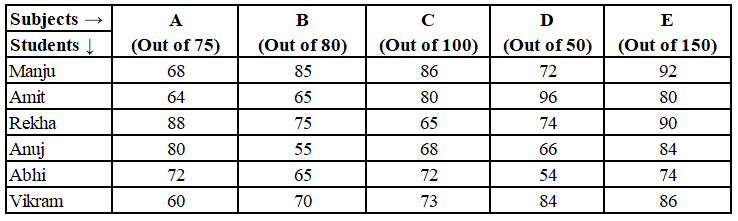


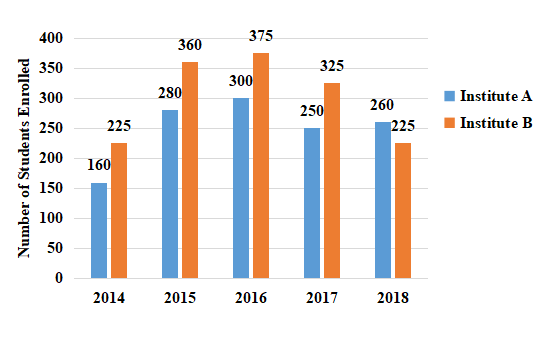
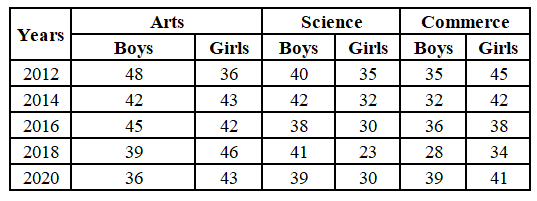


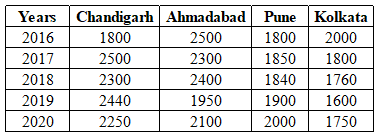
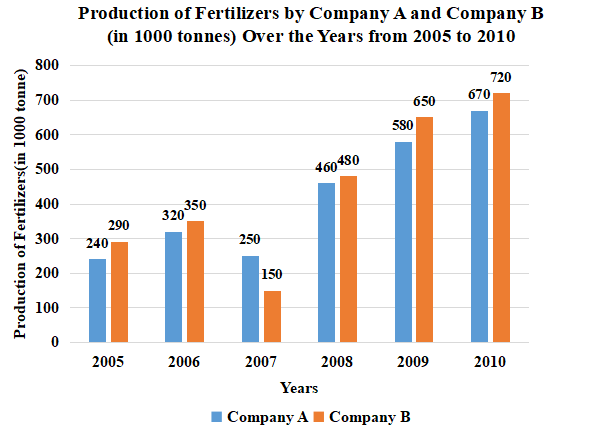

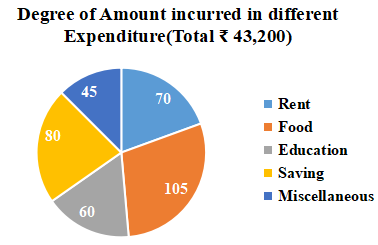


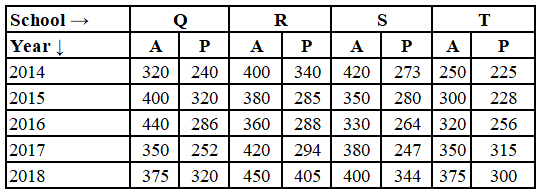


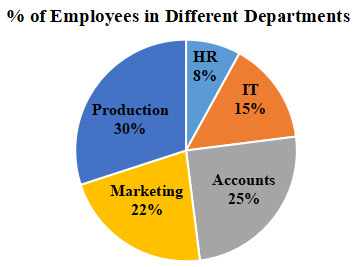

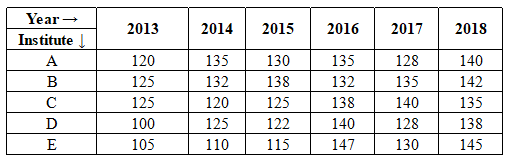
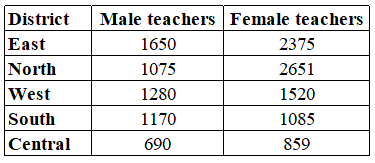
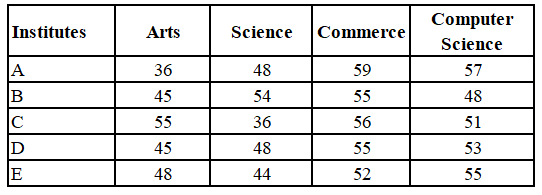
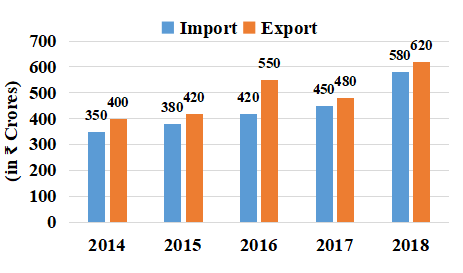
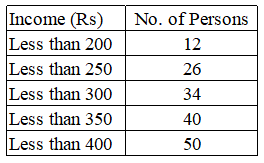
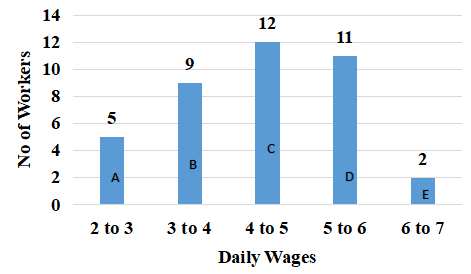
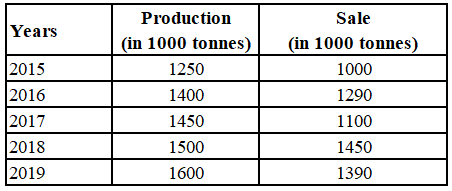
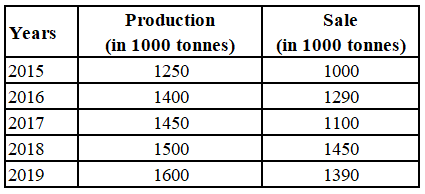
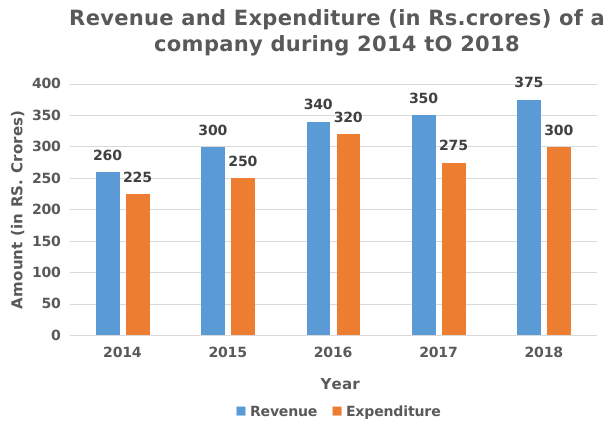


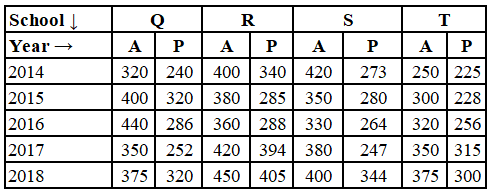


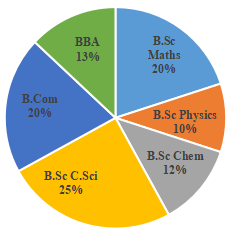


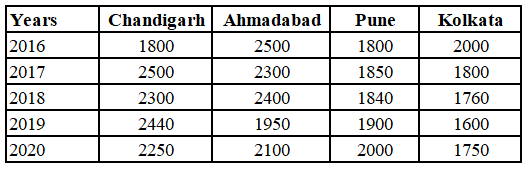
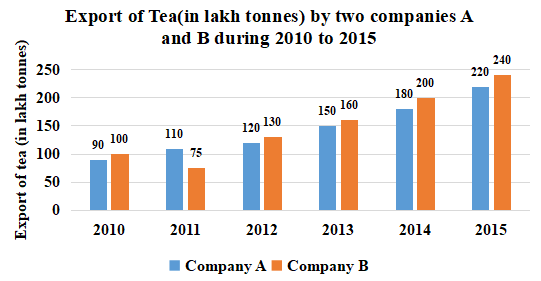

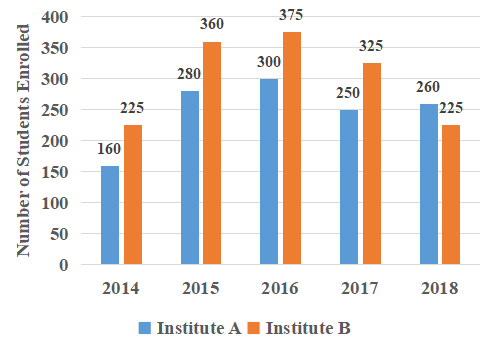


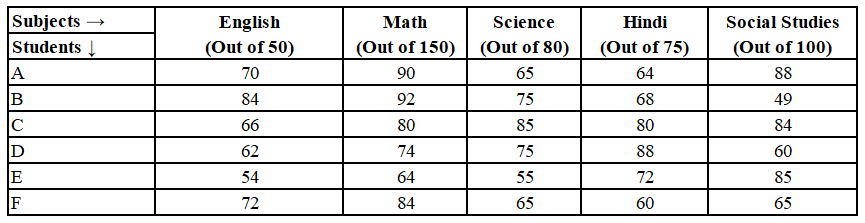
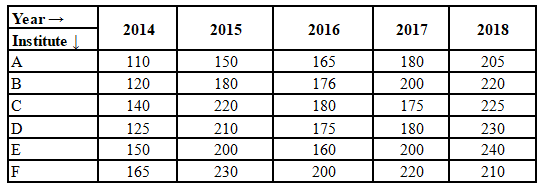

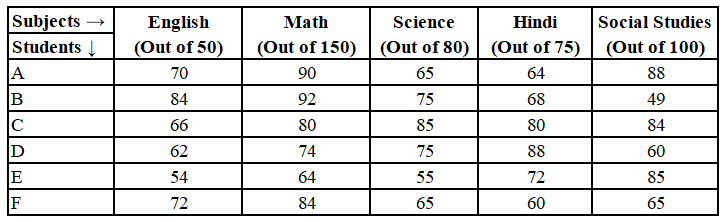
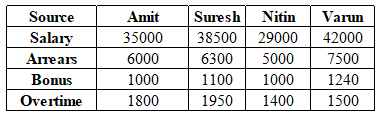
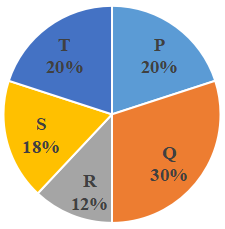


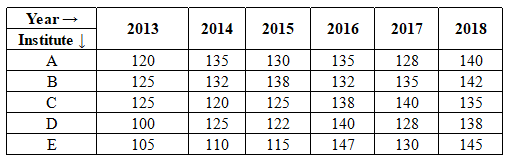
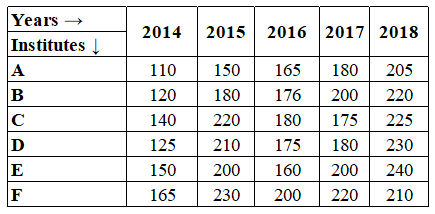
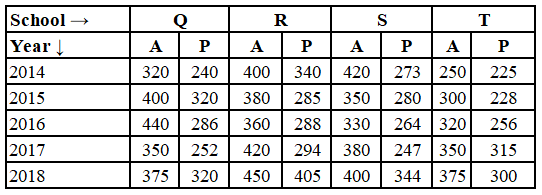


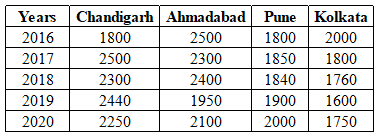


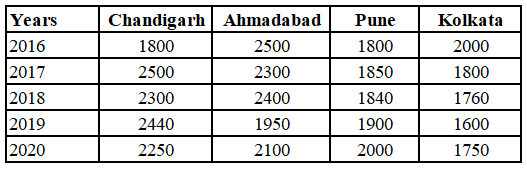


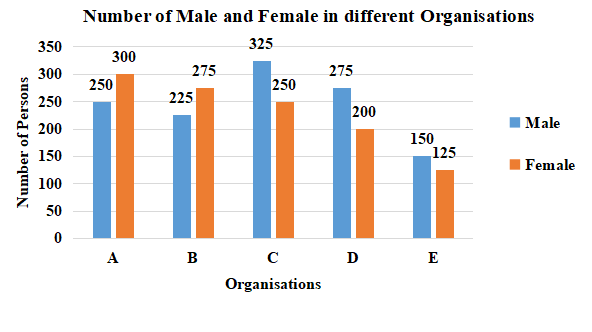
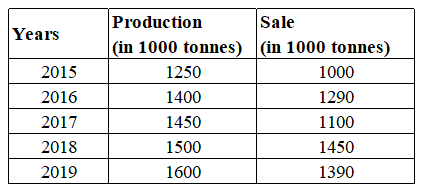
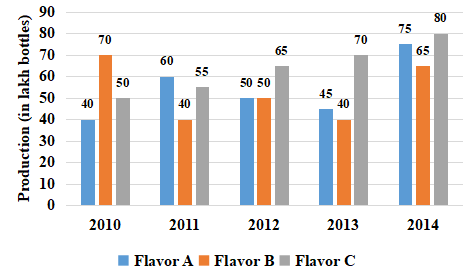


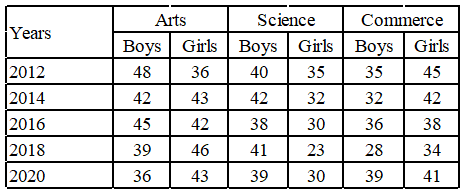


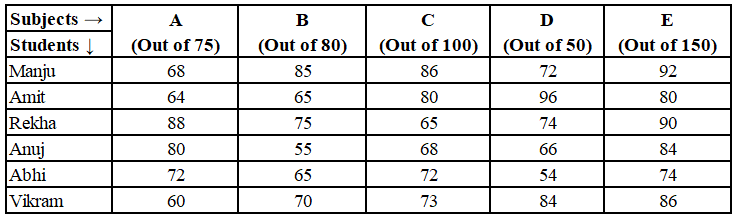


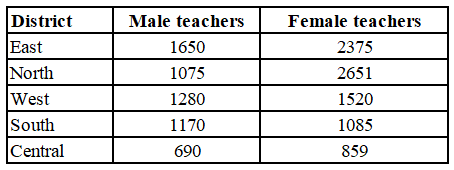


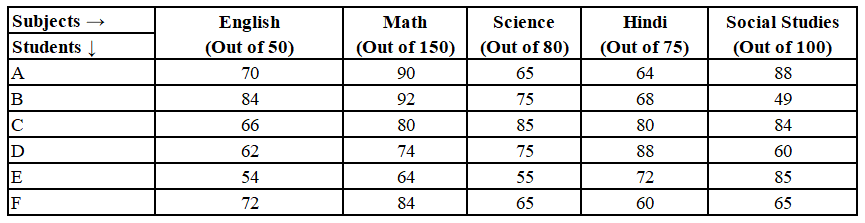


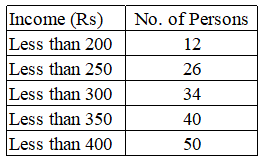
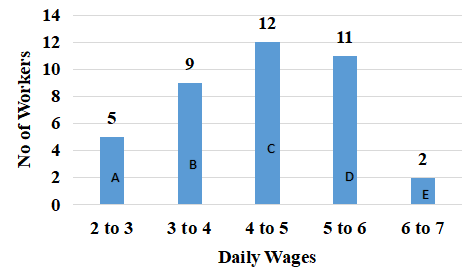


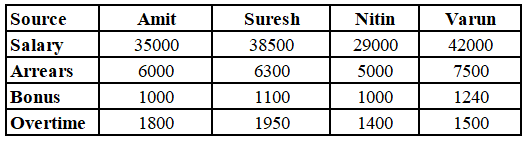
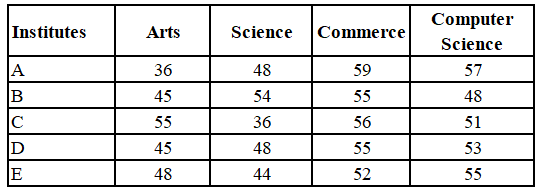

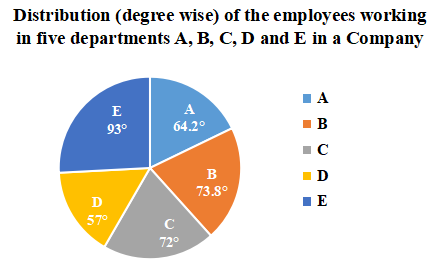

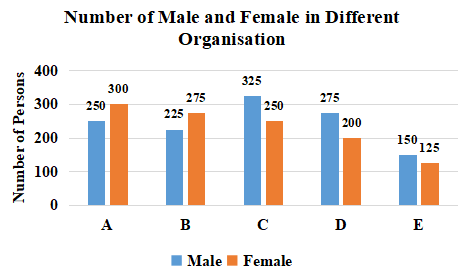

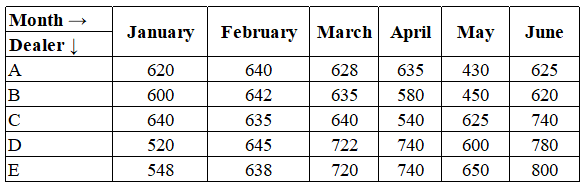
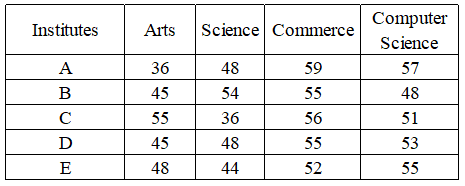
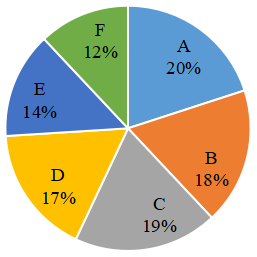
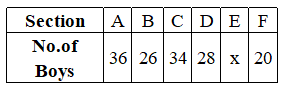


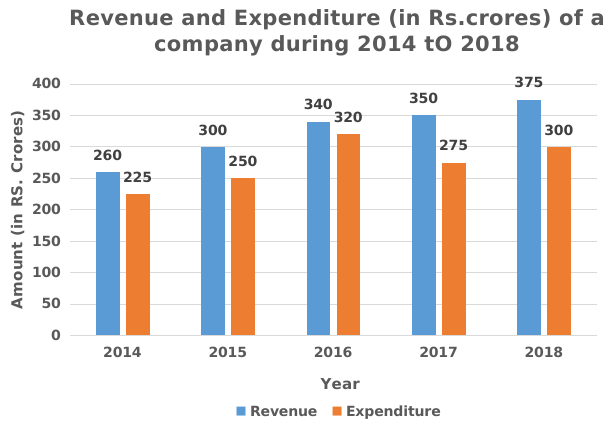


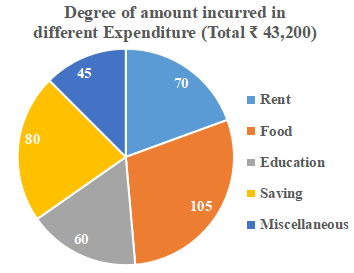


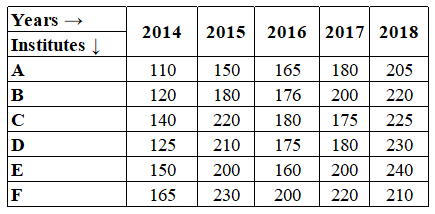
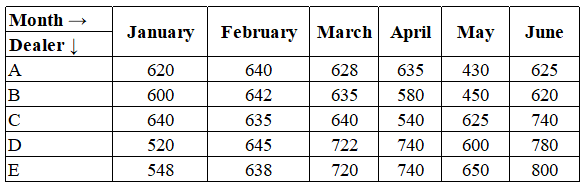

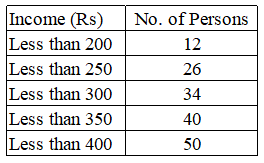
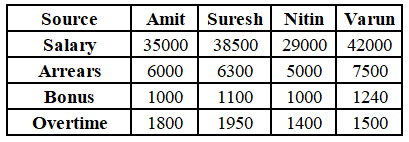
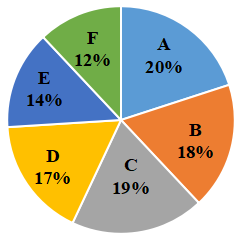
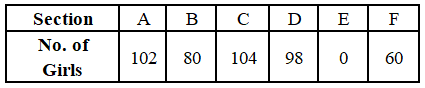

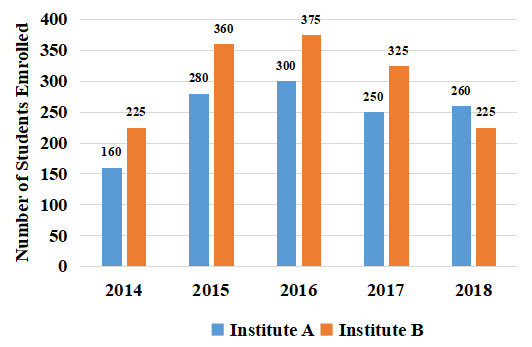
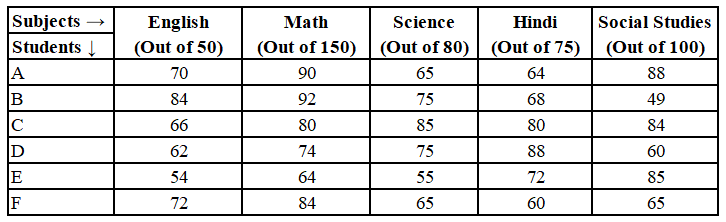

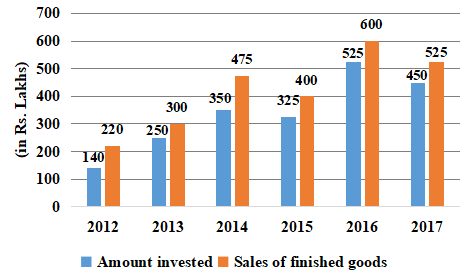


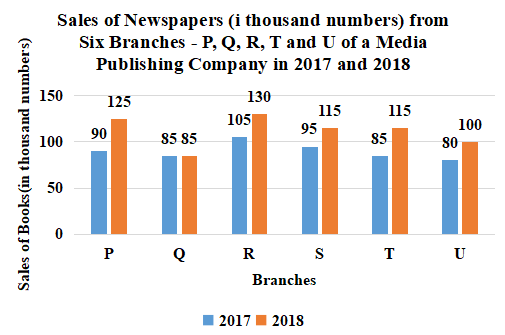
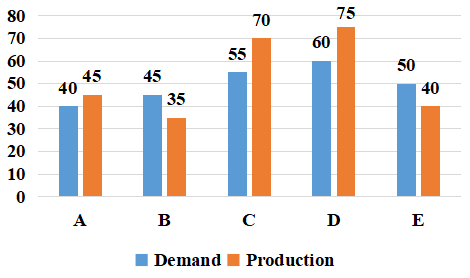
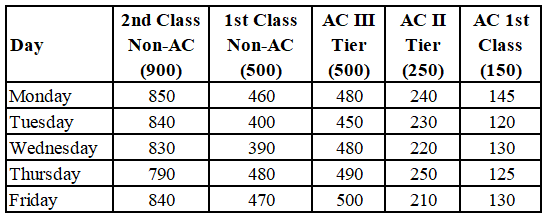


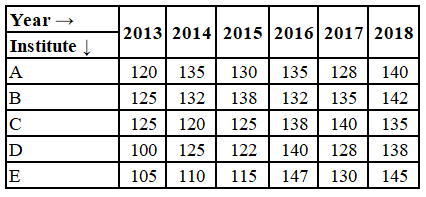


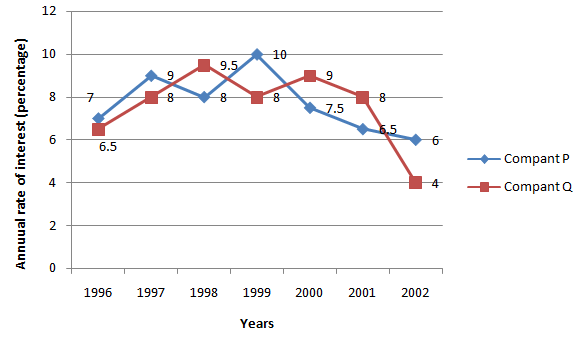
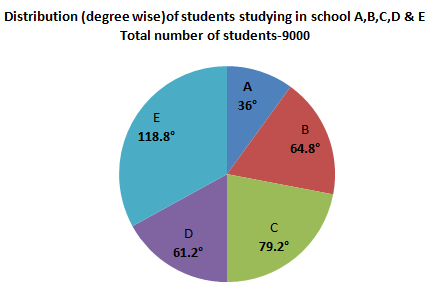

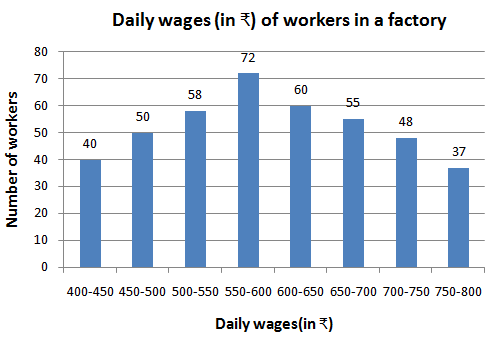

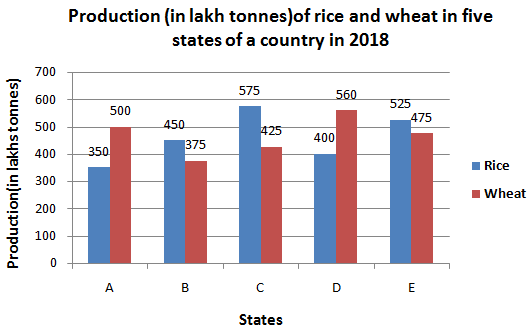


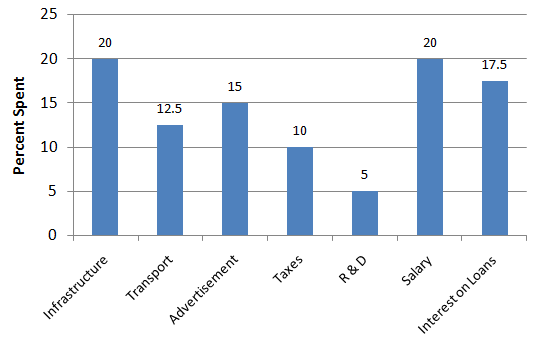


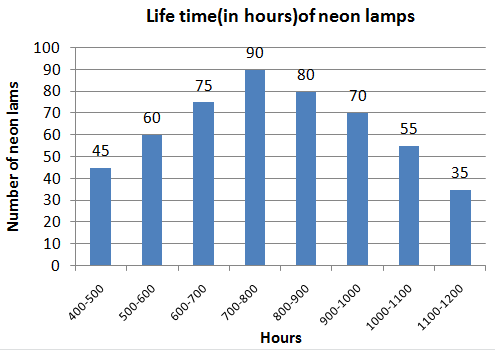


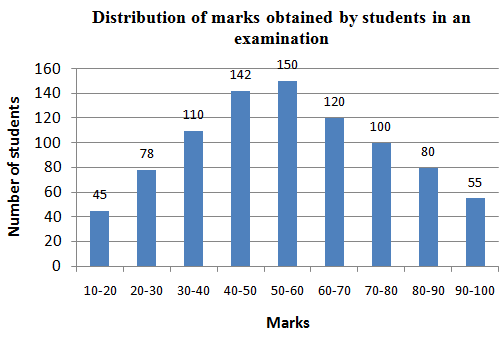


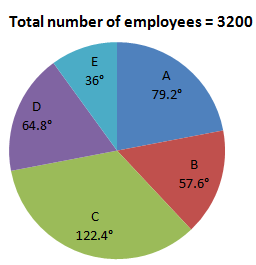


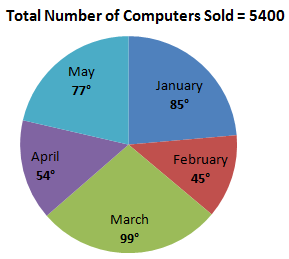

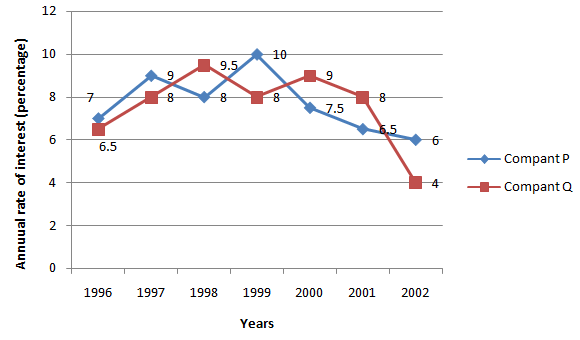


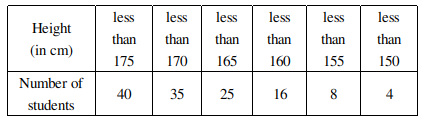
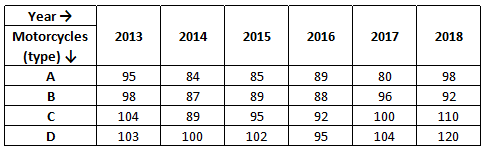


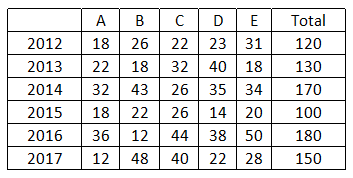


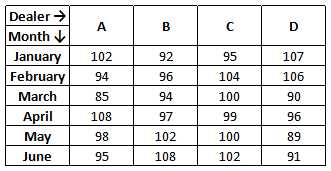


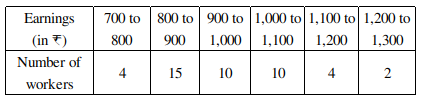
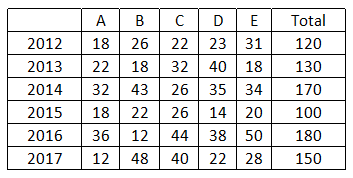





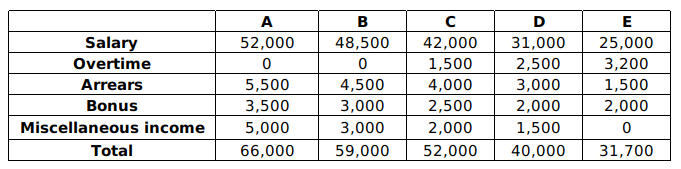
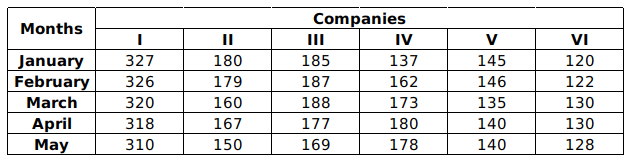






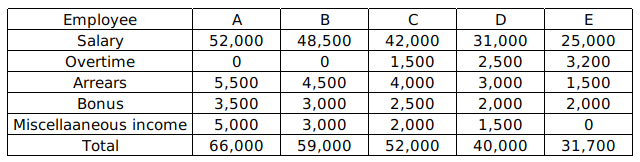


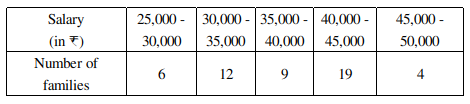






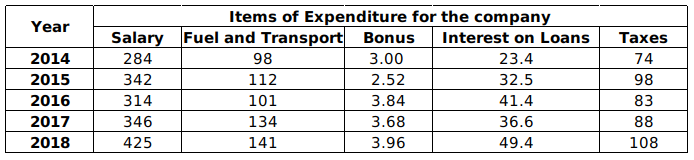


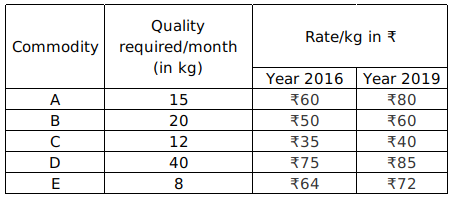


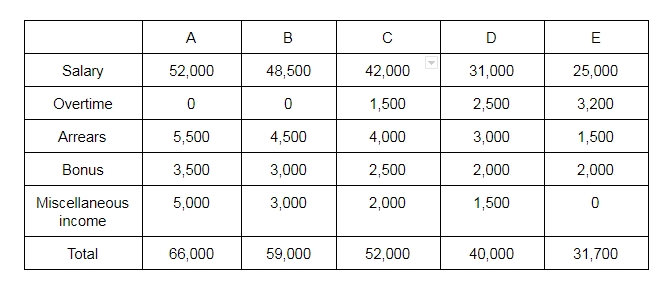


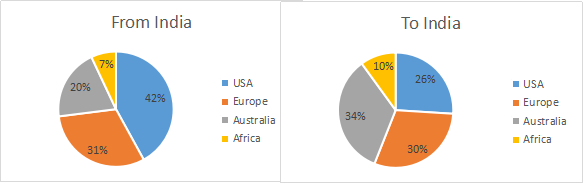


_pEWJdkE.png)


.png)


.png)


.png)


.png)


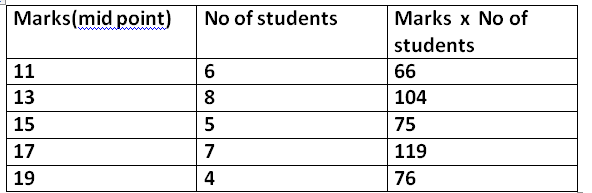


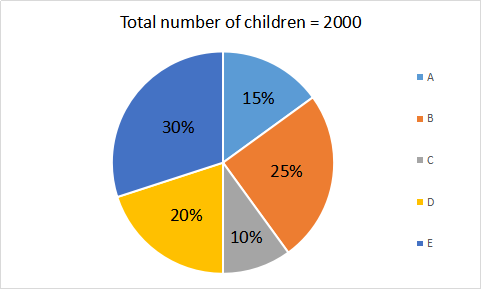


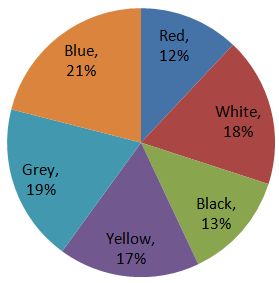


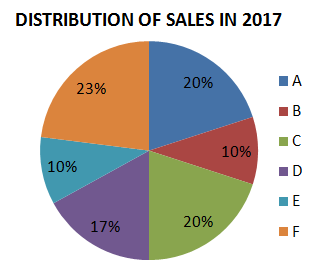
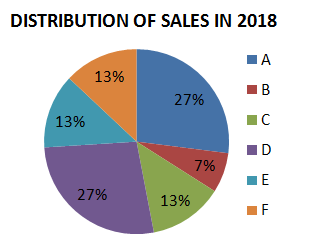


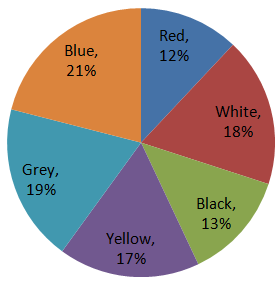


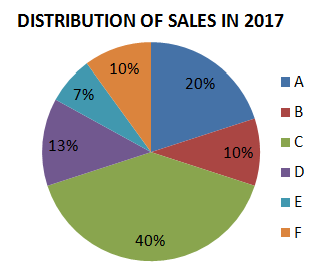
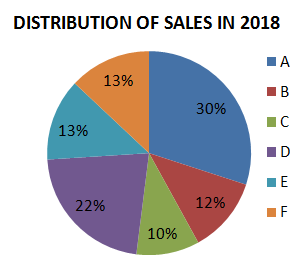


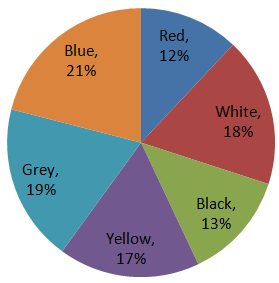


_ftQN1Vl.png)


_nOuAmRt.png)