NPAT Common 2020 QP2
The given pie charts show the percentage distribution of the total employees (executives and non-executives) and that of the executives in different departments of a company. Study the charts and answer
the questions that follow.


NPAT Common 2020 QP2 - Question 71
What percent (approximately) of the employees in the Marketing and HR departments are non-executives?
NPAT Common 2020 QP2 - Question 72
If the ratio of the male to female non-executives in the HR department is 4:5, then how many female HR non-executives are working in the company?
NPAT Common 2020 QP2 - Question 73
Which of the following departments has the highest number of non-executives?
NPAT Common 2020 QP2 - Question 74
Among the females in the Production department, the ratio of executives to non-executives is 2 : 7, and among the males in the same department, the said ratio is 3:25. How many male non-executives are working in the Production department?
Study the given table and answer the questions that follow.
(B and G refer to boys and girls, respectively.)
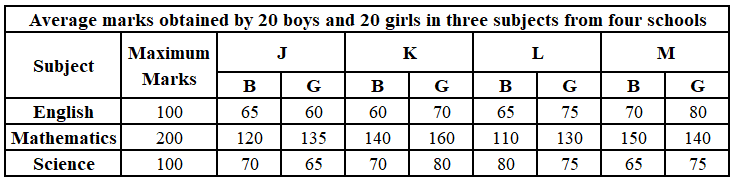
NPAT Common 2020 QP2 - Question 75
In which of the following schools, did girls have the highest average percentage of marks in all the three subjects?
NPAT Common 2020 QP2 - Question 76
In how many schools, did boys score higher average percentage of marks in Mathematics compared to English?
NPAT Common 2020 QP2 - Question 77
In which of the following schools, was the difference between the average percentage of marks of boys and that of girls in all three subjects the maximum?
NPAT Common 2020 QP2 - Question 78
In English and Science, the average marks of the girls exceed that of the boys by approximately:
The graph below shows the percentage of enrolled students in five differ ent schools appearing for the examination and the percentage of students who have appeared and passed the examination. Study the graph and answer the questions that follow.
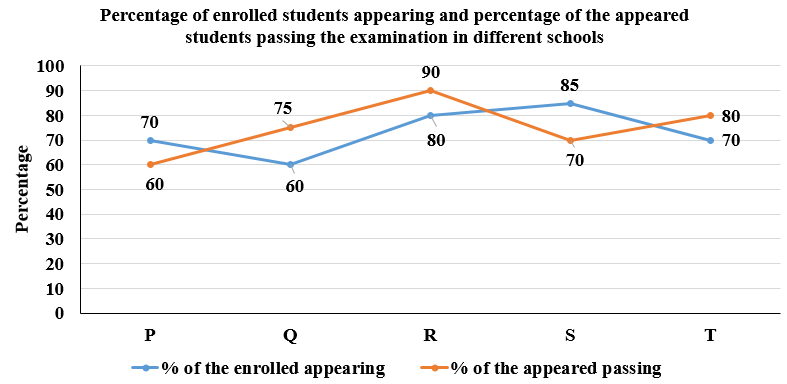
NPAT Common 2020 QP2 - Question 79
If 576 students passed the examination in school R, then how many students were enrolled in school R?
NPAT Common 2020 QP2 - Question 80
lf a total of 1500 students were enrolled in schools P and T and 700 of them passed, then how many students were enrolled in school T?
