You travel by Delhi Metro every day from Botanical Garden, Noida to Hauz Khas, Delhi. At Hauz Khas metro station, you use an escalator to get out of the station. The escalator takes 80 seconds to get you down. One day, the escalator was not working and you walk up the escalator in 50 seconds. How many minutes does it approximately take you to walk up the working escalator?
IIFT 2019 Question Paper
For the following questions answer them individually
Solution
It is given that by using the escalator, one can get out of the station in 80 sec.
Let us consider the number of steps =80
Speed of the escalator = 1 step/sec
When the escalator was not working, the time taken by a person = 50 sec
The speed of the person = 80/50=8/5 steps/sec
Time taken by a person walking down a moving escalator = $$\ \frac{\ 80}{\ \frac{\ 8}{5}-1}$$
=$$\ \frac{\ 80}{\ \frac{\ 3}{5}}$$
=2.22 min
B is the correct answer.
If $$x=8-\sqrt{32}$$ and $$y=2+\sqrt{2}$$, then $$\left(x+\frac{1}{y}\right)^2$$ is given by:
Solution
$$x=8-\sqrt{32}$$ and $$y=2+\sqrt{2}$$,
We have to find the value of $$\left(x+\frac{1}{y}\right)^2$$
$$\left(8-\sqrt{\ 32}+\ \frac{\ 1}{2+\sqrt{\ 2}}\right)^2$$
$$(\ \frac{\ 8\left(2+\sqrt{\ 2}\right)-\sqrt{\ 32}\left(2+\sqrt{\ 2}\right)+\ \ 1}{2+\sqrt{\ 2}})^2$$
$$\left(\ \frac{\ 9}{2+\sqrt{\ 2}}\right)^2$$
$$\ \frac{\ 81}{6+2\sqrt{\ 2}}$$
$$\left(\ \frac{\ 1}{y}\right)^2=\ \left(\frac{\ 1}{2+\sqrt{\ 2}}\right)^2$$ = $$6+2\sqrt{\ 2}$$
=$$\left(\ \frac{\ 2-\sqrt{\ 2}}{2}\right)^{^2}$$
=$$\ \frac{\ 6-4\sqrt{2\ }}{4}$$
=$$\ \frac{\ 3-2\sqrt{2\ }}{2}$$
$$x^2=64+32-64\sqrt{\ 2}$$
=$$96-64\sqrt{\ 2}$$
=32($$3-2\sqrt{\ 2}$$) = 32*$$2y^2$$
we get, $$x^{2\ }=\ 64y^2$$
$$\ \frac{\ 81}{y^2}=\ \frac{\ 81}{64}x^2$$
D is the correct answer.
Alternative solution,
$$xy=\left(8-\sqrt{\ 32}\right)\left(2+\sqrt{\ 2}\right)=4\sqrt{\ 2}\left(\sqrt{\ 2}-1\right)\times\ \sqrt{\ 2}\left(\sqrt{\ 2}+1\right)=8\left(2-1\right)=8$$
(As $$xy=8\ \longrightarrow\ y=\dfrac{x}{8}$$)
$$\left(x+\frac{1}{y}\right)^2=\left(\frac{\left(xy+1\right)}{y}\right)^2=\left(\frac{\left(xy+1\right)\times\ x}{8}\right)^2=\left(\frac{\left(8+1\right)\times\ x}{8}\right)^2=\frac{81}{64}\times\ x^2$$
If the co-ordinates of orthocentre and the centroid of a triangle ABC are (—5, 7) and (5, 5), then the circumcentre of the triangle ABC is :
Solution
Centroid divides orthocenter and circumcenter in the ratio of 2:1
The co-ordinates of orthocentre and the centroid of a triangle ABC are (—5, 7) and (5, 5)
Let the co-ordinate of circumcenter be (x,y)
5=$$\ \frac{\ 2x-5}{3}\ =\ 5$$ and $$\ \frac{\ 2y+7}{3}\ =\ 5$$
x=10 and y = 4
Hence the circumcenter = (10, 4)
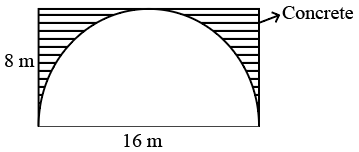
Consider a cuboidal underground tunnel of length 500 m whose cross-section is given in the figure. If $$1 m^3$$ of concrete costs 1000 rupees, find the amount of money needed to build the Tunnel.
Solution
Area of the tunnel to be filled with concrete = 16*8-$$\pi\ \left(32\right)$$
Length of the length along which the tunnel has to be filled with concrete = 500m
Volume = 16*8-$$\pi\ \left(32\right)$$*500
= $$32(4-\pi)$$*500
Cost of concrete per $$1 m^3$$ = 1000
Cost of $$32(4-\pi)$$*500 = $$32(4-\pi)$$*500*1000
=$$16(4-\pi)*10^{6}$$
C is the correct answer.
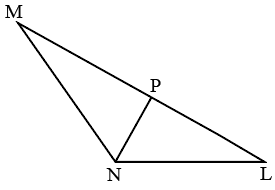
In $$\triangle MNL$$, line NP bisects the angle MNL. If NP : NL = 2 : 3 and angle MNL = $$120^\circ$$. Then NP : NL : MN is:
Solution
Let the value of MN be p
Since NP is the angular bisector
NP= $$\ \frac{\ 2\times\ MN\times\ NL}{MN+NL}\cos\theta\ \ $$
2x=$$\ \frac{\ 2\times\ p\times\ 3x}{p+3x}\cos60$$
p=6x
NP: NL: MN = 2:3:6
B is the correct answer.
Derivation for the length of angular bisector:
Let CP be the angular bisector of $$\angle\ ACB$$. And lengths of AB,BC,CA, CP,AP,PB be c,a,b,x,m,n respectively.

From triangles CPB and CPA using cosine rule we get:
$$n^2=a^2+x^2-2axCos\left(C\right)\ and\ m^2=b^2+x^2-2bxCos\left(C\right)$$
According to angle biscetor rule: $$\ \frac{b}{m}=\frac{a}{n}$$
.'.$$\frac{a^2}{b^2}=\frac{n^2}{m^2}$$= $$\frac{a^2+x^2−2axCos(C)}{\left(b^2+x^2−2bxCos(C\right)}$$.
$$\frac{a^2}{b^2}=\frac{a^2+x^2−2axCos(C)}{b^2+x^2-2bxCos\left(C\right)}$$
Upon equating we get, $$(a^2−b^2)x−2ab(a−b)Cos(C)=0$$
since x$$\ne\ 0$$,
x=$$\frac{2ab(a−b)Cos(C)}{a^2−b^2}$$
.'.x=$$\frac{2abCos(C)}{a+b}$$.
A group of women in a society decided to execute interior and exterior decoration of the society in a week’s time. Since 11 women dropped out every day from the second day, the entire decoration was completed on $$12^{th}$$ day. How many women participated at the beginning ? (Answer to the nearest integer)
Solution
Let x be the number of women who decided to execute the interior and exterior decoration of the society in a week’s time
Let the efficiency of each of them be 1
Total work = 7x
Number of women who worked on first day = x
Number of women who worked on second day = x-11
Number of women who worked on third day = x-22
....
On similar lines, the number of women who worked on $$n^{th}$$ day = x-(n-1)11
Number of women who worked on day 12=x-121
x+x-11+x-22+........x-(n-1)11 = 7x
12x-(11+22+....121)=7x
5x=$$\ \frac{\ 12}{2}\left(2\times\ 0+11\times\ 11\right)$$
x=145
C is the correct answer.
Joseph is in a dilemma. He has been offered a job which would pay him ₹ 80,000 per month for first three years and ₹ 1,20,000 per month for the next three years, and ₹ 1,50,000 per month for the remaining four years. He has also been offered an MBA at a prestigious place and he is considering whether to accept the job or go for the MBA. The first year tuition fee for the MBA program is ₹ 16,00,000 and the second year tuition fee for the MBA program is ₹ 20,00,000. After MBA, he'll get a salary of ₹ 2,00,000 per month for the first four years and then ₹ 2,50,000 per month for the remaining four years. What will be the approximate percentage gain for Joseph in opting for the MBA instead of the job in the 10 years horizon considering no discounting of money ?
Solution
The sum accrued by Joseph if he had taken the job = (80000*3+120000*3+150000*4)*12
=144*$$10^5$$
If Joseph has taken the MBA program, tuition fee for the program = 1600000+2000000
Sum accrued post MBA = 200000*12*4+250000*12*4=21600000
Net amount = 21600000-3600000 = 180*$$10^5$$
Net gain if Joseph had taken MBA over job 10 years down the lane= 36*10^5
Percentage of gain = $$\ \frac{\ 36\times\ 10^5}{144\times\ 10^5}$$
=25%
B is the correct answer.
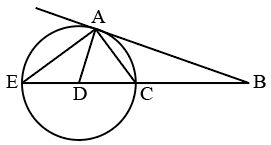
AB is the tangent on the circle at point A. The line BC meets the circle at points C and E. Line AD bisects the angle EAC. If angle EAC = $$60^\circ$$ and angle BAC : angle ACB = 2: 5. Find angle ABC :
Solution
Let us consider angle CAB=2x and angle ACB=5x
From Alternate segment theorem,
angle AEC = 2x
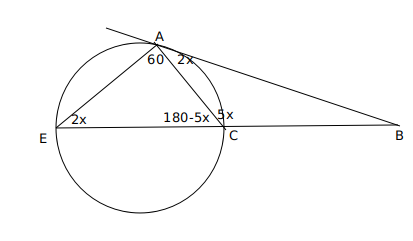
In triangle AEC, 60+180-5x+2x=180
3x=60
x=20
In triangle ABC, angle ABC = 180-7*20=40
A is the correct answer.
KBC restaurant chain regularly conducts survey of its customers. The customers are asked to rate the food quality, service and price as Excellent, Good and Fair. Customers are also asked whether they would comeback. It was found that 76% of customers say that they will come back. Amongst those who say that they will come back, 57% rate the restaurant as Excellent, 36% rate it as Good and remainder rate it as Fair. Of those who say that they will not return, the respective values are 14%, 32% and 54%. What percentage of customers rated the restaurant as good ?
Solution
Let the total customers be 100.
Number of customers who said that they will return = 76x
Number of customers who said that will not return = 24x
Number of customers among those who said that they will return rated the restaurant as good = 76x*0.36
Number of customers among those who said that they will not return rated the restaurant as good = 24x*0.32
Number of customers who rated the restaurant as good = 76x*0.36+24x*0.32 = 35.04x
Percentage of customers who rated the restaurant as good = approx 35%
B is the correct answer.
Four couples are to be seated in a circular table such that each couple sits together. In how many ways they can sit such that two males sit to the right of their female partners and the other two males sit to the left of their female partners ?
Solution
Two couples can be selected in $$^4C_2=6$$ ways.
The selected couples will have the males sitting to the left of the females, and the other couples will have it the other way around. In this way we cover all the possibilities of the conditions given.
The four couples can be seated in $$3!=6$$ ways.
Thus, the total ways of seating arrangement = $$6\times 6=36$$
Hence, the answer is option A.
Nawab has two sons Saif and Amir who have export businesses. Nawab’s satisfaction/ utility level is given by adding twice of the satisfaction level of Saif with the satisfaction level of Amir. If Saif makes a profit of ₹ 100, his satisfaction level goes up by 10% and if he suffers a loss of ₹100, his satisfaction level goes down by 10%. If Amir makes profit of ₹ 100, his satisfaction level goes up by 5% and if he suffers a loss of ₹ 100, his satisfaction level goes down by 15%. Currently, Nawab’s satisfaction level is 24 and the satisfaction level of Saif is the same as the satisfaction level of Amir. If Saif makes a profit of 100 and Amir suffers a loss of ₹ 100, what is the approximate percentage change in Nawab’s satisfaction level?
Solution
Nawab’s satisfaction/ utility level is given by adding twice of the satisfaction level of Saif with the satisfaction level of Amir.
Saif makes a profit of ₹ 100, his satisfaction level goes up by 10% and if he suffers a loss of ₹100, his satisfaction level goes down by 10%.
Amir makes profit of ₹ 100, his satisfaction level goes up by 5% and if he suffers a loss of ₹ 100, his satisfaction level goes down by 15%.
Nawab’s satisfaction level is 24 and the satisfaction level of Saif is the same as the satisfaction level of Amir
Let x be the satisfaction level of Saif
24=3x
x=8
If Saif makes a profit of 100 and Amir suffers a loss of ₹ 100, the satisfaction level of Saif and Amir goes up by 10% and goes down by 15% respectively.
The satisfaction of Saif and Amir = 8.8 and 6.8
Nawab's new satisfaction/ utility level = 2*8.8+6.8 =24.4
Percentage change = $$\ \frac{\ 24.4-24}{24}$$
=1.67%
D is the correct answer.
A man standing on the line joining the two poles finds that the top of the poles make an angle of elevation of $$60^\circ$$ and $$45^\circ$$ respectively. After walking for sometime towards the other pole, the angles change to $$30^\circ$$ and $$60^\circ$$ respectively. The ratio of the height of the poles is :
Solution
Let 'a' and 'b' be the heights of the two poles
X be the initial position of the man and the angles of elevation be $$60^0$$ and $$45^0$$
Distance between pole 1 and X = $$\ \frac{\ a}{\sqrt{\ 3}}$$ and distance between pole 2 and X = b
Let Y be the position of the man after walking sometime towards the other pole =
Distance between Y and pole 1 = $$\ \ a\sqrt{\ 3}$$ and distance between the pole 2 and Y = $$\ \frac{\ b}{\sqrt{\ 3}}$$
Since the distance between the poles will remain the same
$$\ \frac{\ a}{\sqrt{\ 3}}$$ + b = $$\ \ a\sqrt{\ 3}$$ + $$\ \frac{\ b}{\sqrt{\ 3}}$$
$$\ \frac{\ a}{b}=\ \ \frac{\ \sqrt{\ 3}-1}{2}$$
A is the correct answer.
An E-rickshaw owner makes 24 trips a month with 4 passengers per trip. If his interest cost for purchase of E-rickshaw is ₹ 120/month, he earns 15 percent profit a month (Profit is the difference between revenue and cost). What will be the approximate percentage profit for the same month if the owner undertakes 20 trips a month with 5 passengers and his interest cost is reduced by 10 percent for the month ?
Assume:
(a) Total cost to be proportional to the interest cost.
(b) Revenue per passenger is the same in both cases.
Solution
Consider the revenue per passenger = P
=> Total revenue = 24*4P = 96P
Since the total cost is proportional to interest, it can be assumed as 120*K
Total cost*(1+Profit/100)=Revenue
=> 120K(1+15/100) = 96P ..........(1)
New Revenue = 20*5P = 120*(0.9)K*(1+Profit/100) ..........(2)
Dividing (2) by (1),
25/24 = (0.9/1.15)(1+Profit/100)
Profit/100 = (25*23)/(18*24) - 1 = 1.33-1
=> Profit = 33%, Option A is the answer.
400 students were admitted to the 2018-19 MBA batch. 200 of them did not choose “Business Statistics”. 100 of them did not choose “International Management’. There were 80 students who did not choose any of the two subjects. Find the number of students who chose both Business Statistics and International Management.
Solution
The number of students in 2018-19 MBA batch = 400
Number of students who did not choose 'Business Statistics' = 200
Number of students who did not choose 'International Management' = 100
Number of students who did not choose any of the two subjects = 80
Number of students who choose at least one of the two subjects = 400-80=320
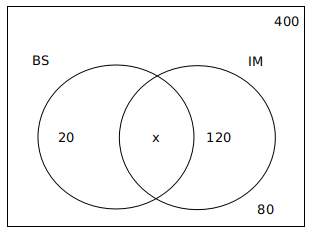
140+x=320
x=320-140=180
A is the correct answer.
At what time between 2.00 pm and 3.00 pm,the two arms of a watch are completely opposite to each other ?
Solution
Time when the tho hands of the clock are completely opposite to each other between 2.00 pm and 3.00 pm
let x be the minutes covered in between 2.00 pm and 3.00 pm
180=$$\frac{11x-60*2}{2}$$
x=43.6
B is the correct answer.
The number $$37^{371}-26^{371}$$ is divisible by:
Solution
Option A:
$$37^{371}-26^{371}$$ mod 10
=$$7^{371}-6^{371}$$
Since 7 and 10 are co-prime to each other
E(10) = 10*($$\left(1-\ \frac{\ 1}{2}\right)\left(1-\ \frac{\ 1}{5}\right)$$
=4
$$7^{4}$$ mod 10 = 1
$$7^{4*92}*7^{3}$$ mod 10 = $$1*7^{3}$$ mod 10 =3
$$6^{371}$$ mod 10 = 6
Hence $$37^{371}-26^{371}$$ is not divisible by 10
Option B:
$$37^{371}-26^{371}$$ mod 11
$$4^{371}-4^{371}$$ mod 11
Hence $$37^{371}-26^{371}$$ is divisible by 11
Option C:
$$37^{371}-26^{371}$$ mod 12
$$1^{371}-2^{371}$$ mod 12
Hence $$37^{371}-26^{371}$$ is not divisible by 12
Option D:
$$37^{371}-26^{371}$$ mod 15
$$7^{371}-11^{371}$$ mod 15
$$37^{371}-26^{371}$$ is not divisible by 15
B is the correct answer.
A motorboat takes the passengers from Rishikesh to Haridwar and back. Both the cities, Rishikesh and Haridwar are located on the banks of River Ganga. During Kumbh Mela,to earn more money, the owner of the motorboat decided to have more trips from Rishikesh to Haridwar and back, so he increased the speed of the motorboat in still water, by 50%. By increasing the speed, he was able to cut down the travel time from Rishikesh to Haridwar and back, by 60%. What is the ratio of the speed of motorboating still water to that of the speed of river Ganga?
Solution
Let the speed of the boat in the still water = 100x and the travel time = 100t and the distance between Rishikesh and Haridwar be 'd'
Let the speed of the river be 100r
Since the owner of the motorboat decides to increase the number of trips, he increased the speed.
Increased speed in still water = 150x
Final travel time = 40t
$$\ \frac{\ d}{100x+100r}+\ \frac{\ d}{100x-100r}=100t$$ ---(1)
After the ease in speed
$$\ \frac{\ d}{150x+100r}+\ \frac{\ d}{150x-100r}=40t$$ ---(2)
Dividing 1 by 2, we get x/r = $$\sqrt{\ \ \frac{\ 11}{6}}$$
A is the correct answer.
A cricket team has 11 players and each of them has played 20 matches till date. Virat, Rohit, Mahendra, Rahul and Shikhar have scored runs at an average of 60, 55, 50, 45 and 40 respectively. Rest of the players have scored at an average of 25 each. In the next 10 matches, Virat and Rohit each scored 900 runs whereas Mahendra scored twice that of Rahul. After 30 matches, if Virat’s new average score is twice that of Rahul, what is the approximate average score of Mahendra ?
Solution
The average scores of Virat, Rohit, Mahendra, Rahul and Shikhar in the first 20 matches are 60, 55, 50, 45,40 respectively.
In the next 10 matches, Virat and Rohit each scored 900 runs whereas Mahendra scored twice that of Rahul.
Virat's score in 30 matches = 60*20+900=2100
Let us consider Rahul scored x runs in last 10 matches, then Mahendra scores 2x runs.
Rahul's score in 30 matches = 45*20+x=900+x
Mahendra's score in 30 matches = 50*20+2x = 1000+2x
It is given that
After 30 matches, Virat’s new average score is twice that of Rahul.
2100=2(900+x)
x=150
Mahendra's score in 30 matches =1300
Average score of Mahendra = 43
C is the correct answer.
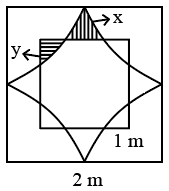
A square of length 1 m is inside a square of length 2 m and four quarter circles are joined as shown in the figure. The value of y —x is given by,
Solution
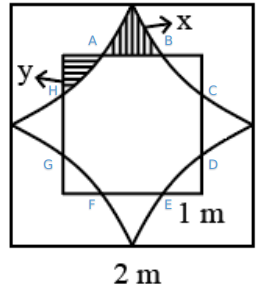
From the above figure area of the region bounded by ABCDEFGH = Are of the square with side 2 - (4*quadrants with side 1cm + 4x)
=4-$$\pi\ $$-4x
Which is same as the area of the square with side 1 cm -4y
4-$$\pi\ $$-4x = 1-4y
4x-4y=3-$$\pi$$
y-x= $$\frac{\pi-3}{4}$$
D is the correct answer.
Rohit purchased a cistern which had a leakage. The cistern can be filled by two inlet pipes, which can individually fill the cistern in 12 min and 15 min respectively. Despite leakage, the two inlet pipes together can fill the cistern in 20 min. How long will it take to empty the completely full the cistern due to leakage?
Solution
Let the capacity of the cistern be LCM of 12 and 15 = 60l
The rate of flow through the inlet pipe 1 = 60/12=5 l/min
The rate of flow through the inlet pipe 2 = 60/15=4 l/min
It is given that despite leakage the two inlet pipes together can fill the cistern in 20 min.
Let the flow through the leakage be x l/min
(5+4-x)20=60
9-x=3
x=6
The leakage will empty the cistern in 60/6=10 min
A is the correct answer.
In a triangle, the two longest sides are 13 cm and 12 cm. The angles of the triangle are in arithmetic progression. The radius of the circle inscribed in this triangle is :
Solution
Let x be the other side.
It is given that the angles are in AP, so the angles are 60-x, 60, 60+x
cos 60=$$\ \frac{\ x^2+169-144}{2\times\ x\times\ 13}$$
$$x^2-13x+25=0$$
x=10.6, 2.35
Inradii (r) = Area /Semi perimeter
when x= 10.6
$$\ \frac{\ \ \frac{\ 1}{2}\cdot12\cdot10.6*sin 60}{17.8}$$ = 3.09
when x= 2.34
$$\ \frac{\ \ \frac{\ 1}{2}\cdot12\cdot2.34*sin 60}{13.67}$$ = 0.9
x=1cm(approx)
D is the correct answer.
Consider the equation :
$$\mid x-5\mid^2+5\mid x-5\mid-24=0$$
The sum of all the real roots of the above equationis :
Solution
Let's consider x-5 as 'p'
Case 1: $$p \ge\ $$ 0
$$\mid x-5\mid^2+5\mid x-5\mid-24=0$$
$$p^2\ +5p\ -24\ =0\ $$
$$p^2\ +8p\ -3p\ -24\ =0\ $$
$$p\left(p+8\right)-3\left(p+8\right)\ =0\ $$
$$\left(p+8\right)\left(p-3\right)$$ = 0
p=-8 and p=3
x-5=3,x=8 This is a real root since x is greater than 5.
x-5=-8, x=-3. This root can be negated because x is not greater than 5.
Case 1: $$p < $$ 0
$$p^2\ -5p\ -24\ =0\ $$
$$p^2\ -8p\ +3p\ -24\ =0\ $$
p=8, -3
x-5=8, x=13. This root can be negated because x is not less than 5
x-5=-3, x=2. This is a real root because x is less than 5.
The sum of the real roots = 8+2=10
D is the correct answer.
According to birth registration data available with the South Delhi Municipal Corporation,7 babies were born in a particular week in a private hospital. What is the probability that three babies were born on the same day of the week?
Solution
The three babies who are born on the same day of the week can be selected in $$^{^7}C_3$$ ways
The number of ways in which a particular day can be selected = 7
The remaining four babies can be born in 6*5*4*3 ways
The probability that three babies were born on the same day of the week =$$\frac{^{^7}C_3*7*6*5*4*3}{7^7}$$
=$$\ \frac{\ 1800}{7^5}$$
A is the correct answer.
Monika buys a Samsung’s 360 litre refrigerator from M/s Coldrush Agencies for ₹ 42,000. She makes a down payment of ₹ 12,000 and the remaining amount in 4 equal half yearly instalments. If M/s Coldrush Agencies charge an interest of 10% per annum, approximately what amount Monika has to pay every six month ?
Solution
Cost of refrigerator= 42,000
Amount paid as downpayment by Monika = 12,000
So the amount on which Monika has to pay the interest = 30,000.
Interest charged per annum = 10%
Since she is repaying the amount half-yearly, the interest = 5%
30000*$$\ \frac{\ 105}{100}$$ = $$\ \frac{\ x}{1.05^3}+\ \frac{\ x}{1.05^2}+\ \frac{\ x}{1.05}+x$$
31500 = 3.723x
x=8460
C is the correct answer.
Ms. Debjani after her MBA graduation wants to have start-up of her own. For this, she uses ₹ 8,00,000 of her own savings and borrows ₹ 12,00,000 from a public sector bank under MUDRA Scheme.As per the agreement with the bank,she is supposed to repay the principle of this loan equally over the period of the loan which is 25 years. Two years after taking the first loan, she borrowed an additional loan of ₹ 8,00,000 to finance expansion plan of her start-up. If Ms Debjani clears all her loans in 25 years from the date of taking the first loan, how much total interest she has to pay on her initial borrowing? Assume simple interest rate at 8 per cent per annum.
Solution
For the first year, interest= 1200000*0.08
It has been given that she repays the principal of the loan in 25 years i.e she pays $$\frac{1200000}{25}$$ = Rs 48000 at the end of every year.
Therefore the interest for the second year is calculated only on the remaining sum i.e 1200000-48000 = Rs 1152000
for the second year, interest = 1152000*0.08
On similar lines for the twenty-fifth year = 48000*0.08
This is in AP with first term 48000*0.08 with common difference 3840
Total interest = $$\ \frac{\ 25}{2}\left(2\times\ 48000\cdot0.08+24\cdot3840\right)$$
=1248000
A is the correct answer.
Read the passage and answer the questions.
Successful companies, no matter what the source of their capabilities, are pretty good at responding to evolutionary changes in their markets-what in The Innovator’s Dilemma (Harvard Business School, 1997), Clayton Christensen referred to as sustaining innovation. Where they run into trouble is in handing or initiating revolutionary changes in their markets, or dealing with disruptive innovation (DI).
Sustaining technologies are innovations that make a product or service perform better in ways that customers in the mainstream market already value. Compaq’s early adoption of Intel’s 32-bit 386 microprocessor instead of the 16-bit 286 chip was a sustaining innovation. So was Merrill Lynch's introduction of its Cash Management Account, which allowed customers to write checks against their equity accounts. Those were breakthrough innovations that sustained the best customers of these companies by providing something better than had previously been available.
Disruptive innovations create an entirely new market through the introduction of a new kind of product or service, one that’s actually worse, initially, as judged by the performance metrics that mainstream customers value. Charles Schwab's initial entry as a bare-bones discount broker was a disruptive innovation relative to the offering of full-service brokers like Merrill Lynch. Merrill Lynch’s best customers wanted more than Schwab-like services. Early personal computers were a disruptive innovation relative to mainframes and minicomputers. PCs were not powerful enough to run the computing applications that existed at the time they were introduced. These innovations were disruptive in that they didn’t address the next-generation needs of leading customers in existing markets. They had other attributes, of course, that enabled new market applications to emerge-and the disruptive innovations improved so rapidly that they ultimately could address the needs of customers in the mainstream of the market as well.
Sustaining innovations are nearly always developed and introduced by established industry leaders. But those same companies never introduce-or cope well with-disruptive innovations. Why? Our resources-processes-values framework holds the answer. Industry leaders are organized to develop and introduce sustaining technologies. Month after month, year after year, they launch new and improved products to gain an edge over the competition. They do so by developing processes for evaluating the technological potential of sustaining innovations and for assessing their customers’ needs for alternatives. Investment in sustaining technology also fits in with the values of leading companies in that they promise higher margins from better products sold to leading-edge customers.
Disruptive innovations occur so intermittently that no company has a routine process for handling them. Furthermore, because disruptive products nearly always promise lower profit margins per unit sold and are not attractive to the company’s best customers, they’ re inconsistent with the established company’s values. Merrill Lynch had the resources-the people, money and technology-required to succeed at the sustaining innovations (Cash Management Account) and the disruptive innovations (bare-bones discount brokering) that it has confronted in recent history. But its processes and values supported only the sustaining innovation: they became disabilities when the company needed to understand and confront the discount and on-line brokerage businesses.
The reason, therefore, that large companies often surrender emerging growth markets is that smaller, disruptive companies are actually more capable of pursuing them. Start-ups lack resources, but that doesn’t matter. Their values can embrace small markets, and their cost structures can accommodate low margins. Their market research and resource allocation processes allow managers to proceed intuitively; every decision need not be backed by careful research and analysis. All these advantages add up to the ability to embrace and even initiate disruptive change.
According to the passage, DI is more difficult for companies to adopt because :
Solution
Option A is incorrect because the passage states that industry leaders are more skewed towards developing sustaining technologies. This does not mean that they cannot implement DI successfully in their companies. It is a matter of policy of the company that favours sustainable innovations more.
Option B is quite close, but it cannot be clearly inferred that there is a lack of understanding in larger companies regarding DI. Rather, the passage states that though the larger companies recognize the positives of DI, they prefer to concede ground to smaller companies, and prefer to pursue sustainable innovation.
Option C is incorrect. The passage does not talk about geographical location anywhere in the passage.
Option D is the correct answer. The companies which have an established business structure, do not want to move out of their comfort zone and incur additional cost. Hence it is the correct answer.
The disadvantages of DI are that:
Solution
Option A is incorrect. The passage suggests that disruptive innovation is indeed useful to the customers, and brings in a new wave of innovation.
Option C is incorrect. Since the passage says that DI is more easily carried out by start ups, this option conveys a point that is directly opposite to the passage.
Option D is incorrect. The passage explicitly states that smaller companies are better off entering new markets.
Option B is the only option that is mentioned in the passage. It states that DI has lower profit margins, and initially has smaller markets. Hence, it is the correct answer.
How does the author differentiate between Sustaining Innovation (SI) and Disruptive Innovation (DI) ?
Solution
From the lines,
"Sustaining innovations are nearly always developed and introduced by established industry leaders. Month after month,year after year, they launch new and improved products to gain an edge over the competition."
and
"Disruptive innovations occur so intermittently that no company has a routine process for handling them. "
we can infer that option C is the correct answer as DI occurs intermittently and SI occurs continuously.
According to the author, smaller companies are better suited to pursue DI because :
Solution
According to the author, smaller companies are better suited to pursue DI because they can accommodate lower margins in a way that the larger companies' policies would never allow themselves to do.
Option A is incorrect. The passage never mentions about the quality of the products.
Option B is incorrect. The passage never compares the quality of the trained workforce in both the cases.
Option D is incorrect. The new markets prefer start ups, not because their products are cheaper, but because their innovations are radically different from the existing products in the marker.
Option C is the view of the author of the passage. Hence, this is the correct answer.
Read the passage and answer the questions.
A few years ago I was on my boat with one of my employees, a great guy named Keenon; I was supposed to be giving him a pep talk and performance review.
“When I think of what we do, I describe it as uncovering the riptide”, I said.
“Uncovering the riptide,” Keenon said.
“Yes, the idea is that we - you and I and everyone here - have the skills to identify the psychological forces that are pulling us away from shore and use them to get somewhere more productive.”
“Somewhere more productive,” Keenon said.
“Exactly,” I said. “To a place where we can...”
We had talked for about forty-five minutes when my son Brandon, who runs operations for the Black Swan Group, broke out laughing.
“I can’t take it anymore! Don’t you see? Really, Dad, don’t you see ?” I blinked. Did I see what? I asked him.
“All Keenonis doing is mirroring you. And he’s been doing it for almost an hour.”
“Oh,” I said, my face going red as Keenon began to laugh.
He was totally right. Keenon had been playing with me the entire time, using the psychological tool that works most effectively with assertive guys like me: the mirror. Your personal negotiation style - and that of your counterpart - is formed through childhood, schooling, family, culture and a million other factors; by recognizing it you can identify your negotiating strengths and weaknesses (and those of your counterpart) and adjust your mindset and strategies accordingly. Negotiation style is a crucial variable in bargaining. If you don’t know what instinct will tell you or the other side to do in various circumstances, you'll have massive trouble gaming out effective strategies and tactics. You and your counterpart have habits of mind and behaviour, and once you identify them you can leverage them in a strategic manner. Just like Keenon did.
There’s an entire library unto itself of research into the archetypes and behavioural profiles of all the possible people you're bound to meet at the negotiating table. It’s flat-out overwhelming, so much so that it loses its utility. Over the last few years, in an effort primarily led by my son Brandon, we've consolidated and simplified all that research, cross-referencing it with our experiences in the field and the case studies of our business school students, and found that people fall into three broad categories. Some people are Accommodators; others—like me—are basically Assertive; and the rest are data-loving Analysts.
Accommodators think that as long as there is a free-flowing continuous exchange of information, time is being well spent. They will yield a concession to appease or acquiesce and hope the other side reciprocates. The Assertive type believes time is money. For them, getting the solution perfect isn’t as important as getting it done. Assertives are fiery people who love winning above all else, often at the expense of others. Analysts are methodical and diligent. They are not in a big rush. Instead, they believe that as long as they are working toward the best result in a thorough and systematic way, time is of little consequence. Their self-image is linked to minimizing mistakes. Their motto is as much time as it takes to get it right.
A study of American lawyer-negotiators found that 65 percent of attorneys from two major U.S. cities used a cooperative style while only 24 percent were truly assertive. And when these lawyers were graded for effectiveness, more than 75 percent of the effective group came from the cooperative type; only 12 percent were Assertive. So if you’re not Assertive, don’t despair. Blunt assertion is actually counterproductive most of the time.
Remember, your personal negotiating style is not a straitjacket. No one is exclusively one style. Most of us have the capacity to throttle up our non-dominant styles should the situation call for it. But there is one basic truth about a successful bargaining style: To be good, you have to learn to be yourself at the bargaining table. To be great you have to add to your strengths, not replace them.
With respect to the passage, identify which of the following statement is correct:
Solution
After reading the passage we can understand that negotiation tactics are not genetically transmitted. The father and son mentioned in the passage have different negotiation tactics. Therefore option A is incorrect.
The passage states that although the bargaining style of people varies subtly depending upon the person with whom the bargaining is happening, the negotiation tactics usually remains the same. Option B is therefore incorrect.
Option C is incorrect. The passage never mentions that mirroring someone is an effective negotiation tactic.
Option D can be inferred from the passage. Hence it is the correct answer.

Finishing the negotiation is more important than ‘getting it right’ for :
Solution
" The Assertive type believes time is money. For them, getting the solution perfect isn’t as important as getting it done."
From the above statement it is clear that the Assertive type believes that finishing the negotiation is more important than getting it right.
Option C is the correct answer.
Select the most appropriatetitle for this passage:
Solution
The passage does not go into detail about bargaining tactics. It delves more into the different types of negotiators. Hence, option A is incorrect.
Option C talks only about assertion whereas the passage talks not only about assertion but also about other negotiation skills. Option C is incorrect as well.
The passage never talks about different types of leverage. Hence, this option is incorrect as well.
Option B is the correct answer.
‘Every wasted minute is a wasted dollar’ is best associated with :
Solution
The assertives believe that time is money. Therefore , the phrase every wasted minute is a wasted dollar would be best associated with people whose negotiation style is assertive.
Read the passage and answer the questions.
Much debate surrounds which kind of political system best achieves a functioning market economy with strong protection for property rights. People in the west tend to associate a representative democracy with a market economic system, strong property rights protection, and economic progress. Building on this, we tend to argue that democracy is good for growth.
However, some totalitarian regimes have fostered a market economy and strong property rights protection and have experienced rapid economic growth. Five of the fastest-growing economies of the past 30 years - China, South Korea, Taiwan, Singapore, and Hong Kong- had one thing in common at the start of their economic growth: undemocratic governments. At the same time, countries with stable democratic governments, such as India, experienced sluggish economic growth for long periods. In 1992, Lee Kuan Yew, Singapore’s leader for many years, told an audience, “I do not believe that democracy necessarily leads to development. I believe that a country needs to develop discipline more than democracy. The exuberance of democracy leads to undisciplined and disorderly conduct which is inimical to development.”
However, those who argue for the value of a totalitarian regime miss an important point: If dictators made countries rich, then much of Africa, Asia, and Latin America should have been growing rapidly during 1960 to 1990, and this was not the case. Only a totalitarian regime that is committed to a market system and strong protection of property rights is capable of promoting economic growth. Also, there is no guarantee that a dictatorship will continue to pursue such progressive policies. Dictators are rarely benevolent. Many are tempted to use the apparatus of the state to further their own private ends, violating property rights and stalling economic growth. Given this, it seems likely that democratic regimes are far more conducive to long-term economic growth than are dictatorships, even benevolent ones. Only in a well-functioning, mature democracy
are property rights truly secure. Nor should we forget Amartya Sen’s arguments where he says that states, by limiting human freedom, also suppress human development and therefore are detrimental to progress.
While it is possible to argue that democracy is not a necessary precondition for a free market economy in which property rights are protected, subsequent economic growth often leads to the establishment of a democratic regime. Several of the fastest-growing Asian economies adopted more democratic governments during the past three decades, including the East Asian economies of South Korea and Taiwan, Thus, although democracy may not always be the cause of initial economic progress, it seems to be one consequence of that progress.
The author believes that:
Solution
"although democracy may not always be the cause of initial economic progress,it seems to be one consequence of that progress."
From the above lines it can be inferred that democracy can both be the cause and the consequence of the economic progress.
East Asian economic growth model exhibits the following sequence:
Solution
" Several of the fastest-growing Asian economics adopted more democratic governments during the past three decades, including South Korea and Taiwan"
Though the fastest growing Asian countries were undemocratic at the start, form the above lines we can infer that they are slowly becoming more and more democratic.
Option B is the correct answer.
The necessary condition for economic growth is :
Solution
After reading the passage it can be inferred that the author is of the opinion that neither democracy nor being undemocratic is a necessary condition for economic growth. Rather, the author is of the opinion that undemocratic governments that have established strong market economies and have protected their property rights have enjoyed a period of rapid growth.
Further, in the second paragraph, the author states that in a well functioning , mature democracy, property rights are truly secure.
Options A,B,C all mention factors like democracy,totalitarian regime and benevolent dictatorship respectively. While the author agrees that all these could achieve economic growth, he is of the opinion that those regimes should have proper market economy and property rights.
Option D hence is the correct answer.
The argument in the passage is built on the premise :
Solution
After reading all the sentences in the passage, it is evident that the passage points out that neither a democratic regime nor a totalitarian regime in itself ensures economic growth.
Option A is the correct answer.
Read the passage and answer the questions.
Japan presents an interesting case study of how culture can influence competitive advantage. Some scholars have argued that the culture of modern Japan lowers the costs of doing business relative to the costs in most Western nations. Japan’s emphasis on group affiliation, loyalty, reciprocal obligations, honesty, and education all boost the competitiveness of Japanese companies. The emphasis on group affiliation and loyalty encourage individuals to identify strongly with the companies in which they work. This tends to foster an ethic of hard work and cooperation between management and labour “for the good of the company.” Similarly, reciprocal obligation and honesty help foster an atmosphere of trust between companies and their suppliers. This encourages them to enter into long-term relationships with each other to work on inventory reduction, quality control, and design - all of which have been lacking in West, where the relationship between a company and its suppliers tends to be a short-term one structured around competitive bidding rather than one based on long-term mutual commitments. In addition, the availability of a pool of highly skilled labor, particularly engineers, has helped Japanese enterprises develop cost-reducing, process innovations that have boosted their productivity. Thus, cultural factors may help explain the success enjoyed by many Japanese businesses in the global market place. Most notably,it has been argued that the rise of Japan as an economic power during the second half of the twentieth century may be in part attributed to the economic consequences of its culture.
It also has been argued that the Japanese culture is less supportive of entrepreneurial activity than, say American society. In many ways entrepreneurial activity is a product of an individualistic mind-set, not a classic characteristic of the Japanese. This may explain why American enterprises, rather than Japanese corporations, dominate industries where entrepreneurship and innovation are highly valued, such as computer software and biotechnology. Of course, obvious and significant exceptions to this generalization exist. Masayoshi Son recognized the potential of software far faster than any of Japan’s corporate giants; set up his company, Soft bank, in 1981; and over the past 30 years has built it into Japan’s top software distributor. Similarly, dynamic entrepreneurial individuals established major Japanese companies such as Sony and Matsushita. But these examples maybe the exceptions that prove the rule, for as yet there has been no surge in entrepreneurial high-technology enterprises in Japan equivalent to what has occurred in the United States.
Masayoshi Son represents :
Solution
Masayoshi San is anomaly when considering traditional Japanese, who are not very supportive of entrepreneurial spirit. They are more in favour of collaborative attitude rather than individualistic spirit. Masayoshi San was however an entrepreneur and hence he is an exception to Japanese culture.
Option C is the correct answer.
Japanese culture is supportive of:
Solution
From the passage we can see that the Japanese prefer long term relationships to short term relationships. Hence option D is incorrect.
Japanese culture is not very supportive of enterpreneurial spirit. Hence, option B is incorrect.
Japanese culture makes no mention about Japanese being particularly supportive of product innovation. Hence, this option is incorrect as well.
Option A , which mentions that Japanese culture is supportive of collaborative attitude is the correct answer.
In the passage the author mainly tries to:
Solution
The main idea of the passage is to show how Japanese culture has led to Japan enjoying a competitive advantage.
The passage does not make any claim about the sour labour relations in Japan. Hence option B is wrong.
The passage states that Japanese culture is less supportive of enterpreneurial activity than their western counterparts. Hence, option C is wrong.
The main subject of the passage is the competitive advantange enjoyed by the Japanese. The sluggishness of the American firms is a secondary tangential point.
Option A brings out the main idea of the passage efficiently and hence it is the correct answer.
Japanese business practices emphasize:
Solution
"... reciprocal obligation and honesty help foster an atmosphere of trust between companies and their suppliers."
From the above lines it can be inferred that Japanese business practices have relationships built on trust and mutual commitment.
Option D is the correct answer.
Use the table for answering the following questions :

Complete the crosswords using words from the above table. There are more words than required.
Hint :
(a) Across: Producing tears (b) Across : Mocking
(a) Down: Unpredictable (b) Down: Resembling a caveman
.png)
Solution
(a) Across : The word lachrymose means producing tears.
(b) across : To be sardonic with someone means to mock someone.
(c) Down : The word capricious means to be unpredictable.
(d) Down : Trogolodytic means caveman -like.
Option B is the correct answer.
Below given (a) and (b) explain the meaning/synonym of two words from the above table. Identify the correct matching option from the choices given below :
(a) Idealistic but impractical
(b) Extremely thorough
Solution
The meaning of the word quixotic is idealistic and impractical. The word scrupulous means extremely thorough.
Option C is the correct answer.
Below given (a) and (b) explain the meaning /synonym of the two words from the above table. Identify the correct matching option from the choices given below :
(a) Change of fortune
(b) Unruly
Solution
The word vicissitude means change of fortune. Similarly, the word boisterous means unruly.
Option B is the correct answer.
Select the option which expresses a relationship similar to the one expressed in the italicized pair.
SAVAGE: BARBARIC: :
Solution
Savage and barbaric are synonyms. The only other synonyms among the options are venomous and virulent. Hence, option D is the correct answer
PERTINACIOUS: ASTUTE: :
Solution
Pertinacious and astute are synonyms. Similarly, the only synonyms in the options are foible and weakness. Option A is the correct answer.
DILATE : CONTRACT: :
Solution
Dilate and contract refers to the contraction and dilation of the pupil of the eyes. They are two opposing actions.
Wax and wane similarly refers to the waxing and waning of the moon. This would be the correct answer.
SERENE: AGITATED: :
Solution
The words serene and agitated are antonyms. The only two words that are antonyms are odious and pleasant. Hence option C is the correct answer.
Direction : Fill in the blank with appropriate preposition given in the options:
The peasant refused to grovel ________ the feet of his master.
Solution
The peasant refused to grovel at the feet of his master. The correct preposition to be used is "at". Hence, it is the correct answer.
Only the blood-stained road was a witness ________ his assassination.
Solution
Only the blood-stained road was a witness to his assassination. The correct preposition that is grammatically correct is "to".
Option D is the correct answer.
For the following questions answer them individually
Match each word in the left hand column with the description in the right hand column which best describes its meaning/synonym :

Solution
The meaning of the words are as follows.
Schism : Split or a division.
Torsion: twisting of an object because of applied torque
Zephyr : A gentle wind.
Palliative : a medicine that relieves pain
Intrepid : courageous.
Option B is the correct answer.
Identify the correct sentence from the given options :
Solution
The meaning of the word lose is to be deprived of. The meaning of the word loose is not taut.
Only is option A has the words lose and loose been used correctly. Hence, it is the correct answer.
Choose the option that best describes the meaning of each of the following idioms and phrases:
To flog a dead horse :
Solution
The meaning of the idiom , to flog a dead horse is to do something in vain,. Option A is the correct answer.
A pipe dream :
Solution
The meaning of the idiom , a pipe dream is to have an impracticable plan. Option C is the correct answer.
Ante meridiem :
Solution
The term Ante merediem indicates time after midnight to noon. The term post merediem indicates the time from noon to midnight. Option A is the correct answer.
Fill in the blanks with appropriate words given in the options :
Sunita’s _______ in athletics yielded rich _______ as she got a scholarship.
Solution
Only excellence and dividends would fit in the blanks to make a meaningful and grammatically correct sentence.
In _________ of international matters, there is always an element of risk in ________ one might do.
Solution
In case of international matters, there is always an element of risk in whatever one might do. Only the words case and whatever would yield the contextual meaning required in the aforementioned sentence. Hence, option A is the correct answer.
Each question comprises four sentences (A), (B), (C) and (D). Arrange the sentences in a correct and meaningful order.
(A) Particular finger positions or gestures of the hand, common to their age and civilization, delivered a message that was instantly recognized by those who understood the symbolism.
(B) Since ancient times hands have been used in cave paintings, drawings, sculpture and fine art as symbols of communication.
(C) European religious paintings represented the Holy Trinity by the extended thumb, index and middle fingers of a hand.
(D) Ancient Egyptian and Semitic art, for example, depicted celestial power by a hand painted in the sky.
Choose the correct option.
Solution
After reading all the sentences it can be inferred that hands and finger positions were recognized by those who understood the symbolism in ancient times.
Option B introduces this idea and hence it is the introductory sentence of the passage. Option A further establishes how, particular finger positions delivered a message that was recognized by those who understood the symbolism. Hence, it should logically follow B.
Options D and C gives two examples of such symbolism. Here, D should precede C because, D has the term "for example" in it.
The correct order of sentences is therefore BADC
(A) Some people are born with greater possibilities or ‘potential intelligence’ than others.
(B) Intelligence is improved by learning.
(C) It is no longer thought that intelligence is a general quality, underlying all behaviour and inherited wholly from our parents.
(D) However, this potential may not develop unless it is encouraged and stimulated by influences surrounding the child from birth.
Choose the correct option :
Solution
After reading all the sentences, it can be inferred that the passage talks about how intelligence develops and is not an acquired quality.
Sentence C clears a misconception that intelligence is wholly inherited from our parents. Hence, it forms the introductory lines of the passage.
Sentence B clarifies the statement made in sentence C. Hence, it should be the second sentence of the passage.
Sentence A gives the idea that some people are born with greater possibilities than others. Sentece D follows this idea and gives the conclusion that though this is the case, the potential would develop only with the right influences.
Hence, the correct ordering of the sentences is CBAD
(A) The commission also wants insurers to be legally bound to provide compulsory cover for pedestrians and cyclists involved in accidents with cars.
(B) A shake up of the law governing the industry across Europe will make it far easier for individuals to switch insurance companies.
(C) Plans were announced by the European Commission that should lead to greater competition in the vehicle insurance market.
(D) It should mean that companies are no longer able to restrict the length of time motorists may keep their vehicles in EU states other than the ones in which they are registered.
Choose the correct option :
Solution
After reading all the lines of the paragraph, it can be inferred that the passage talks about how plans were made for regulation of automobile laws in EU states.
Sentence C introduces the plans that were announced by the European Commission. Hence, it should serve as the introductory sentence.
Sentence B gives the reason that the plans would make it far easier for individuals to switch insurance companies. Hence, it would follow sentence C.
Sentences D and A give the two major changes proposed in the plan. A should follow D because A begins with , " The commission also wants".
Hence, the correct order is CDBA
Answer the questions with the given information and the graph.
The analyst at a retail giant has modelled the consumer spending and consumer sentiment to prepare a strategy on product offers in the upcoming festive season. The data given in the figure are from last 10 years on 3 parameters namely, food spending (Food_Spend), style spending (Style_Spend), and sentiment index (Sentiment_Index). Study the figure below and answer the following questions :

From the years mentioned below, in which year total of Food_Spend and StyleSpend as a proportion of Sentiment_Index is lowest ?
Solution
2011 : 910/390= 2.33
2013: 1330/750= 1.77
2016: 970/550 = 1.75
2017: 960/370 = 2.6
Option C , 2016 is the correct answer.
From the years mentioned below, in which year Food_Spend as a proportion of Style_Spend is lowest ?
Solution
2012 : 520/350 = 1.49
2013 : 700/650 = 1.07
2015 : 520/450 = 1.15
2016 : 520 / 450= 1.15
2013 is the lowest and hence it is the correct answer.
In which year, ratio of percentage annual change in Style_Spend to percentage annual change in Sentiment_Index is highest ?
Solution
2015 = (450-300)/300 = 0.5
2014 = (650-300)/650 =0.54
2013 = (620-350)/350 = 0.77
2011 Style spend = (350-300)/350= 0.14
2011 sentiment index = 140/250 = 0.56
2011 ratio = 1/4.
2012 Style spend = 50/300 = 1/6
2012 sentiment index = 140/390
Ratio 2012 = 0.06
2014 Style spend = (650-300)/650 =0.54
2014 sentiment index =360/750=0.48
Ratio = 1.1
2017 style spend = 100/450
2017 sentiment Index = 160/550
Ratio = 0.75
Option C is the correct answer.
In which year, highest annual percentage change in StyleSpend is recorded ?
Solution
2015 = (450-300)/300 = 0.5
2014 = (650-300)/650 =0.54
2013 = (620-350)/350 = 0.77
2011 = (350-300)/350= 0.14
The highest percentage change is in the year 2013
Direction : Answer the questions with the given information and the data.
Given below are transactions of 17 customers who brought products available from a range of 5 products namely Product A, Product B, Product C, Product D and Product E, on a particular day. “1” means product was purchased and “0” means product was not purchased on that day. There tail manager wants to study the product purchase behaviour based on customer transactions. Example of Paired Product purchase, there are three paired product purchases made by customer with Customer_ID : 101 - (1) Product A and Product D, (2) Product A and Product E and (3) Product D and Product E.

How many paired product purchases were done with Product A as one product ?
Solution

With A as one of the product, A-B, A-C, A-D, A-E are the pairs.
Hence, the total is 17
Assuming profit margin of the products is as follows : Product A - ₹ 50, Product B - ₹ 45, Product C - ₹ 60, Product D - ₹ 40 and Product E - ₹ 70, which of the following paired product purchases generates highest profit margin given the existing buying frequency ?
Solution

Product A and Product D = 6*90 = 540
Product A and Product E = 5*120 = 600
Product B and Product D = 8 * 85= 680
Product B and Product E = 5 * 115=575
Given the profit margins of the products as follows : Product A - ₹ 50, Product B - ₹ 45, Product C - ₹ 60, Product D - ₹ 40 and Product E - ₹ 70, and the retailer decides to offer discount in case customer buys more than two products. The discount is equal to 10% of the margin of higher margin product in the combination of products purchased, then how many customer in the sample data generate profit margin of ₹ 150 or more ?
Solution

From the above table we can see that the answer is 5
How many customers buy lowest selling product pair as well as highest selling product pair ?
Solution

Lowest selling pair is A-C with 2 customers.
Highest selling pair is B-D with 8 customers.
Only 115 buys both. Hence, the answer is 1.
Answer the questions with the given information and the data.
The figures given below show the amount of work distribution (in operational hours) for a toy manufacturing company having manufacturing plants in Chennai and Kanpur. Each plant carries out six activities. Planned operational cost per hour of Chennai and Kanpur plants are ₹ 250 and %₹300 respectively. However, the actual operational cost per hour is ₹ 270 in Chennai and ₹ 315 in Kanpur.
Cost Difference (in %)=Absolute ((Actual Cost —- Planned Cost) / Planned Cost) x 100
.png)
Overall Cost difference in Chennai plant is approximately :
Solution

Planned cost in chennai = 1032 * 250=258000
Actual cost in chennai = 1350 * 270 = 364500
Cost difference = (106500/258000)*100 = 41%
In how many activities plant in Chennai could meet at least 50% shortfall in the actual operational hours compared to planned operational hours of plant in Kanpur ?
Solution

In Activity 1, 50% shortfall of planned and actual in Kanpur is 25. Excess in chennai is 25. Hence this activity is counted.
In Activity 2 there is no shortfall
In Activity 3, the 50% shortfall is 50. Excess in chennai is 28. Hence this is incorrect
In Activity 4 and 5 there is no shortfall
In Activity 6 the 50% shortfall is 25. Excess in Chennai is 78. Hence, this activity is counted.
Whichof following activities has maximum cost difference in Kanpur Plant ?
Solution

ACtivity 1 : 50/100 * 100 = 50%
Activity 3 : 100/150 *100= 66.6%
Activity 4 : 50/100 *100 = 50%
Activity 5 = 50/250 * 100 = 20%
Activity 3 is the correct answer.
In how manyactivities plant in Chennai has higher planned operational hours as compared to plant in Kanpur ?
Solution

Chennai has more planned operational hours in Activity 2 and 6.
Answer the questions with the given information and the data.
The following table gives number of T-Shirts sold (in thousand units) in Delhi and Mumbai. The T-Shirts are sold in different styles (S1, S2, S3, and S4) with different colours as shown in the table.
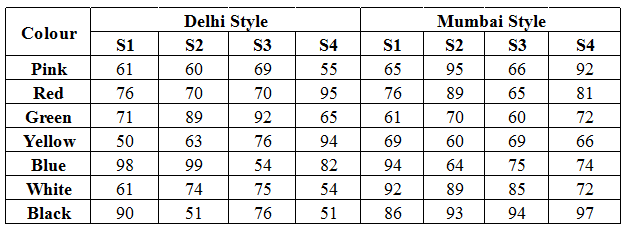
The average sales of which colour T-Shirt sold is same in both the cities ?
Solution
Yellow - Delhi : 70.75 ; Yellow - Mumbai : 66.
Blue - Delhi : 83.25 ; Blue - Mumbai :76.75
Black - Delhi :67 ; Black - Mumbai :92.5
Red - Delhi :77.75 ; Red - Mumbai :77.75.
Red has same average sales in both cities
Which style T-Shirt has highest difference in numberof units sold between twocities of Delhi and Mumbai?
Solution
S1- Delhi = 507 ; S1- Mumbai = 543 ; Difference = 36
S2-Delhi = 506 ; S2 - Mumbai=560 ; Difference = 54
S3 - Delhi =515 ; S3 - Mumbai = 154 ; Difference = 1
S4 - Delhi = 496 ; S4 - Mumbai = 554 ; Difference = 58.
Option D, S4 is the correct answer.
If the profit margin of T-Shirts of various styles S1, $2, S3 and S4 are = 100, ¥ 100, ¥ 120 and & 120 respectively, then among the colour an city combinations given below, which combination has the maximum profit ?
Solution
Red - Mumbai = 100*(76+89) + 120*(65+81)=34020
Red - Delhi = 100 *(76+70) + 120*(70 + 95) = 34400
Green - Delhi = 100*(71+89) + 120*(92+65) = 36040
Blue - Mumbai = 100*(94+64) + 120*(75+74) = 33680.
Maximum profit is with Green- Delhi
From the combinations given below, which one has minimum difference in units sold across cities of Delhi and Mumbai ?
Solution
Red S2 = |70 - 89| = 19
Green S2 = |89-70| = 19
Yellow S1 = |50-69| = 19
Black S3 = |76-94| = 18.
Option (d) , Black S3 is the correct answer.
Direction : Answer the questions based on the information provided.
In Gargi’s family there are 7 members A, B,C, D, E, F and G other than her consisting of Mother, Father, Brother, Sister, Uncle, Grandfather and Grandmother. They are Doctor, Professor, Director, Actor, Minister, Business Person and Artist by profession not necessarily in the same order. Gargi is a Manager of a leading restaurant and invites the family to her restaurant having round tables for seating to have dinner. The family members select a table for dinner while Gargi is on duty. Few other details are :
(a) The mother and father do not sit together.
(b) C is seated on the immediate left of Professor and A sits with B.
(c) The artist is either the sister or grandmother and sits to the immediate right of Father.
(d) The grandmother is seated on the immediate left of D who is an actor.
(e) G who is an artist sits with the Business person, F who is a female.
(f) E sits second to the left of Director.
(g) There is one family member between Grandmother and C, who is a Director.
(h) Father is a doctor and sits between Professor and Sister.
(i) Brother is not a Professor and sits with Grandmother.
How many minimum/least number of people are between the Business person and Professor ?
Solution
After reading the sentences D,G,B, we get two cases with the following partially filled table

After filling in details with b and e we arrive at

Here, father/doctor has to sit between professor and sister. This is violated in first case. Hence, it is rejected.

The final arrangement is as given above. There are two persons between business person and professor.
If B is a Doctor, then who is A ?
Solution
After reading the sentences D,G,B, we get two cases with the following partially filled table
After filling in details with b and e we arrive at
Here, father/doctor has to sit between professor and sister. This is violated in first case. Hence, it is rejected.
The final arrangement is as given above. If B is doctor, then A is professor.
If C is the Uncle, then Professor is :
Solution
After reading the sentences D,G,B, we get two cases with the following partially filled table
After filling in details with b and e we arrive at
Here, father/doctor has to sit between professor and sister. This is violated in first case. Hence, it is rejected.
The final arrangement is as given above. If C is uncle, then professor is grandfather.
Who sits three places to the right of Mother ?
Solution
After reading the sentences D,G,B, we get two cases with the following partially filled table
After filling in details with b and e we arrive at
Here, father/doctor has to sit between professor and sister. This is violated in first case. Hence, it is rejected.
The final arrangement is as given above. Director is the correct answer.
Direction : Answer the questions based on the information provided.
A group of students A,B, C, D, E, F, G, H and I visit Sheesh Mahal in Jaipur and play a game of standing in a horizontal line in front of a mirror as per the directions seen in the reflection. The group consists of four girls and five boys and none of the boys are at the extreme end positions. All the boys stand together with no girl in between. A takes the lead and stands in the centre to give directions as per those seen in the reflection. Some other directions which A gives are :
(a) Gis on the extreme left while A is to the immediate left of D.
(b) C stands two places to the right of A and is not a girl.
(c) H is second to the left of B and to the immediate right of G.
(d) E is not on the extreme ends and is not a girl.
(e) B always stands between two boys.
Which of the following statementis always true ?
Solution

Option A is the correct answer
Whois three placesto the right of A considering A’s direction sense and not that of the reflection ?
Solution

The answer is H.
If there are two students between F and D, then I as per reflection is :
Solution

From the diagram , we can infer that option C is the answer.
Direction : Answer the questions based on the information provided.
In a building with various offices on 12 floors there are two lifts. Lift 1 halts at even numbered floors and Lift 2 at odd numbered. A, B, C and D have their offices on 2, 8, 7 and 11 floors respectively. The office reaching time for A and C is 9:10 am while for B and D is 9:15 am and 9:20 am respectively. The attendance will be marked on the floor office. The lift takes 30 seconds to cross from one floor to another and halts on the selected floor for 30 seconds. The employees have to complete 8 hours and 30 minutes per day and are allowed to be late in the morning up to a maximum of 30 minutes which has to be compensated for in the evening. They have to enter the building from Ground i.e. ‘0’ floor and it is not necessary that the lift is always available.
D steps into Lift 1 by mistake with in it at 9:00 am at the ground floor and C is in Lift 2 at ground floor at the same time and realises only when the lift has started. Then approximately at what time will D reach office, if Lift 2 halts for additional 30 seconds after D boards it ?
Solution
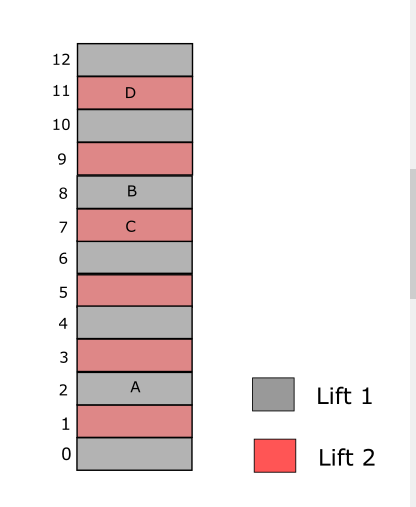
C travels for 7 floors on lift 2. It takes 3.5 minutes. Further it takes another .5 minutes at the 7th floor.Total of 4 minutes.
It travels another 3.5 minutes to the ground floor and spends 0.5 minutes halting at ground floor. Total of 8 minutes.
Now it travels for 5.5 minutes to the 11th floor. The question mentions that it halts for an extra 0.5 minutes. Therefore it takes 6 minutes. Total of 14 minutes.
Answer therefore is 9:14.
If A reaches the building at 9:08 am and Lift 1 is at the $$6^{th}$$ floor with only B in it, at what time can at the earliest leave from office on that given day ?
Solution

The lift is at the 6th floor. It takes 1 minute to reach 8 th floor. Further it stops for 30 seconds here.
It climbs down 8 floors. It takes 4 minutes for the same. It takes 30 seconds to halt at ground floor. Now it travels 2 floors to second floor in 1 minute. Totally it takes 7 minutes.
Therefore B reaches office at 9:15, which is his office start time. He can therefore leave office is 8 hours 30 minutes which is 5:45
Direction : Answer the questions based on the information provided.
In an organisation with three departments i.e. Marketing, Finance and HR, it was decided to shuffle the 70 employees between departments. To make optimum use of resources, the management assesses their capability based on their qualification. 3 employees can work in every department. 7 employees can work in Finance and Marketing only. 10 can work only in HR while the number of employees only in Marketing is double of that in only Finance. Employees in only Finance cannot be less than 10 while employees in Finance and HR only are three times of two less than that of Marketing and HR only. The organisation has employees with all possible combinations of their capabilities.
How many employees are capable to work in Marketing and HR only ?
Solution
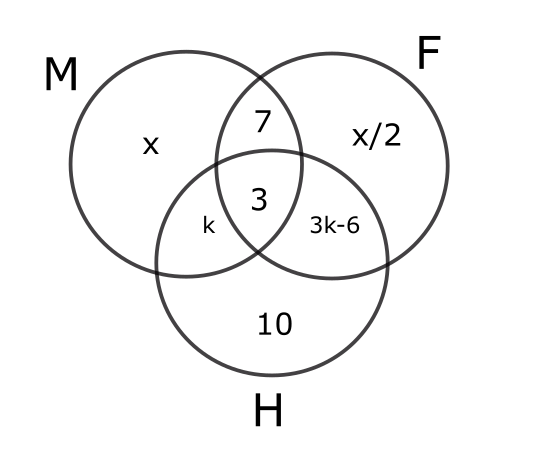
We know that x+x/2+k+3+3k-6+10+7=70
$$\frac{\ 3x}{2}$$ +4k =56
The solutions possible are x=24, k=5 and x=32 and k=2. But if k=2 then, only finance and hr would have 0. This is not possible as the question states that there exists employees in all possible combinations.
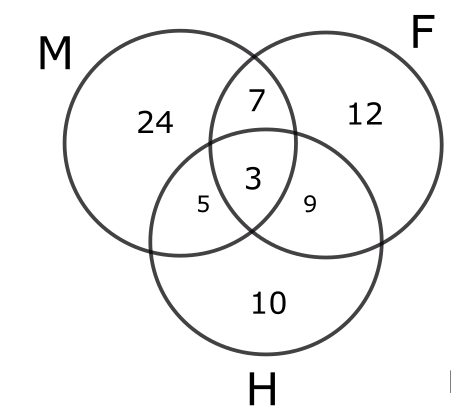
The number of employees in only marketing and HR is 5.
How many employees at the maximum are capable to work in Finance ?
Solution
We know that x+x/2+k+3+3k-6+10=70
$$\frac{\ 3x}{2}$$ +4l =56
The solutions possible are x=24, k=5 and x=32 and k=2. But if k=2 then, only finance and hr would have 0. This is not possible as the question states that there exists employees in all possible combinations.
Finance has 31 people.
For the following questions answer them individually
Complete the given sequence 63, 215, 511, 999
Solution
63 = $$4^3-1$$
215=$$6^3-1$$
511=$$8^3-1$$
999=$$10^3-1$$
Similarly, the required answer is $$12^3-1$$= 1727
Direction : Answer the questions based on the information provided.
A word arrangement, when rearranged by given input follow a particular rule/logic in each step.
Following is an example of input and rearrangement. Study that rule/logic and apply on given problem.
INPUT one cannot but feel sorry for him
Steps /Results :
(I) but cannot one sorry feel him for
(II) cannot but feel sorry one for him
(III) but cannot sorry feel him for one
(IV) sorry cannot but him feel one for
If Step VI reads, ‘the best way of promoting our nation’, what will be the arrangement of the input ?
Solution

Step 5 would be : cannot sorry feel him but for one.
Step 6 would be : sorry cannot him feel one for but.
If the step 6 was: the best way of promoting our nation
"sorry" the first word in the 6th step was at the 5th position in the sentence.
Similarly "the" must be at the 5th position. Only sentence 3 has "the" in the 5th position. Hence, it is the correct answer.
If Step V reads, ‘weeks of tepid slothful and weak performance’, what would step VI read ?
Solution

Step 5 is : cannot sorry feel him but for one.
Instead it is :weeks of tepid slothful and weak performance
Step 6 would be:of weeks slothful tepid performance weak and
Option B is the correct answer.
For the following questions answer them individually
2014 Hong Kong protest was termedas:
Match the Juice brands with their Company.

Which companylaunched India’sfirst ethanol based bike ?
The Gandhi Solar Park (GSP) wasrecently inaugurated at the headquarters of which international organisation ?
Adani Group wonthe bid to manage and develop which ofthe following airports in India ?
“83” is a biopic on which famous personality ?
The 2018 Winter Olympics games were heldin :
Match the Sea Port with the Country where it is located :

Heis a French Business magnate, investor and an art collector. He is the Chairman and Chief executive of LVMH,the world’s largest luxury goods company. Heis the second richest person in the world according to Forbes Magazine as on July 2019. Identify the Personality.
Which ministry launched the UDAAN Scheme?
According to latest UN International Migrant Stock 2019 report, which country is the leading country of origin of international migrants in 2019 ?
Scientist's plan to build an elevator between Earth and the Moon to cut down on the rocket fuel needed for a trip between the Earth and the Moon is known as:
Who is the co-founder of multi-brand sneaker store “Veg NonVeg” ?
Which of the following is not a recipient of Ramon Magsaysay Award ?
Which of the following country is not a member of BIMSTEC ?
With which of the following countries Afghanistan shares its border ?
(a) Turkmenistan
(b) Uzbekistan
(c) Tajikistan
(d) Iran
(e) Kyrgyztan
Select the correct option :
Name of which of the following shoe brandis derived from a ‘wild cat’ found in Americas ?
Match the festivals with the states in which they are celebrated :

The terms “Technical foul” and “Flagrant Foul” are most commonly associated with which of the following sport ?
Identify the name of ISRO Mission whoseobjective is to carry a three membercrew to low earth orbit and return them safely to a pre-defined destination on earth ?

