IIFT 2018 Question Paper
Based on the information given below, answer the questions which follow.
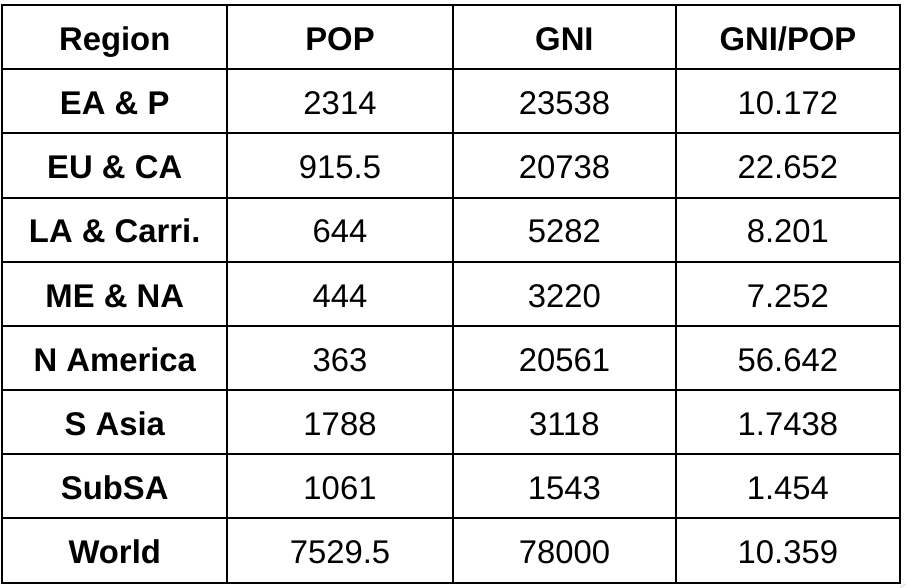
The data on select economic indicators for entire world comprising of 7 regions namely East Asia & Pacific, Europe & Central Asia, Latin America & Caribbean, Middle East & North Africa, North America, South Asia and Sub-Saharan Africa is presented in Table-1 for the year 2017. Further, Table-2 represents the economic indicators for select countries.
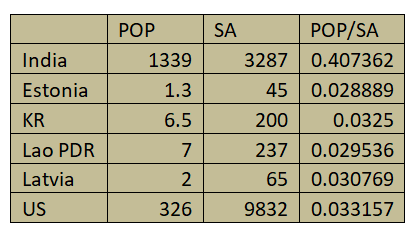
GNI refers to Gross National Income (USD Billions). PPP refers to Purchasing Power Parity (USD Billions). POP refers to Population (Millions) and SA refers to Surface Area (Thousands sq. km)
Table-1: Economic Indicators for Different Regions of World

Table-2: Economic Indicators for Select Countries

IIFT 2018 - Question 1
Arrange the countries in order of increasing population density (number of people per sq. kms).
IIFT 2018 - Question 2
For which of the region, the 'GNI per capita' is closest to that of 'GNI per capita' of world?
IIFT 2018 - Question 3
What percentage of world's GNI is represented by combined GNI of India and US?
IIFT 2018 - Question 4
Which region has third lowest difference between 'PPP per capita' and 'GNI per capita'?

Based on the information given below, answer the questions which follow.
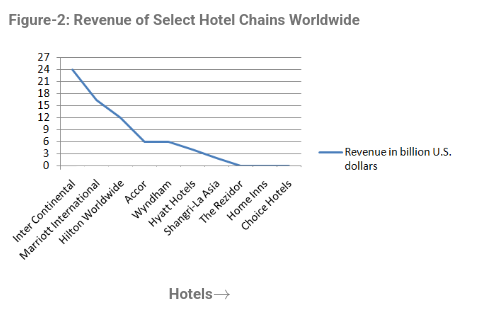
The occupancy rate of a hotel is the share of available rooms that are occupied during a given time. Figure- I presents quarter wise average hotel occupancy in four regions (Asia-Pacific, America, Europe and Middle East & Africa) for the year 2016. Figure-2, shows the revenue of select hotel chains worldwide in 2016.
Figure-1: Region Wise Average Hotel Occupancy Rates
Occupancy rates

Regions $$\rightarrow$$
IIFT 2018 - Question 5
Considering the total revenue of the hotel industry in 2016 as 495.17 billion USD. what is the percentage contribution of revenue of select hotel chains to hotel industry revenue?
IIFT 2018 - Question 6
For Hilton Worldwide, considering 70% average occupancy rate for 365 days of operations and average room rent of 350 USD per day, the total number of rooms available (in 000's) in Hilton Worldwide per day approximately are:
IIFT 2018 - Question 7
If the number of available rooms in each of the four regions (Asia-Pacific, America, Europe and Middle East & Africa) are in the ratio 1:2:5:4, the average occupancy rate for Quarter-1 are:
IIFT 2018 - Question 8
Assuming that there is no change in the number of available rooms in a given year in all four regions, the correct arrangement in the increasing order of average annual occupancy rates is :
Based on the information answer the questions which follow.
IBM is one of the most valuable technology brand in the world. Visualizing the trends, IBM has added and dropped business segments across years. For example, "Technology Services and Cloud Platforms (TSCP)" which started in 2015 only, generated a revenue of approximately 34280 million U.S. Dollars in 2017. Table shows the Global Revenue generated by IBM in nine different segments of its business from 2010 to 2017 in millions USD.
IBM's Golbal Revenue from 2010 to 2017 (in millions U.S. Dollars)

TSCP-Technology Services & Cloud Platforms. CS-Cognitive Solutions, GBS-Global Business Services, SYS-Systems, GF-Global Financing, Other. SOFT-Software. GTS-Global Technology Services and S&T-Systems and Technology
IIFT 2018 - Question 9
For the year 2017, if the revenue in different segments is represented on a pie-chart, what sector angle would be represented by 'Global Business Services (GBS)'?
IIFT 2018 - Question 10
Which segment has earned third highest cumulative revenue in the time period 2010-2017?
