Group
Group

How Well Does Cracku's DashCAT Predict Your CAT Percentile?
Many CAT aspirants often wonder, “If I score X in DashCATs, what percentile will I get in the actual CAT?” To answer this, we analyzed data from thousands of students who appeared for both DashCAT mocks and CAT 2025. The results show that DashCAT scores give a fairly reliable estimate of your real exam performance.
However, it’s important to understand that DashCAT percentiles are calculated among a highly competitive group of serious aspirants. This group is much more focused and prepared compared to the overall CAT candidate pool of over 2.5 lakh students. Because of this tougher competition, your percentile in DashCAT may appear lower than expected.
In reality, many students see an improvement in their percentile in the actual CAT exam. So, if you are performing decently in DashCATs, you can expect a slightly better result in CAT. In simple terms, DashCAT gives you a realistic and often conservative prediction of your CAT percentile.
How Many Aspirants Take Cracku's DashCATs Every Year?
Taking regular CAT mock tests is a key part of effective CAT preparation. It helps you track your progress, improve your strategy, and get used to the pressure of the actual exam. That’s why thousands of aspirants take DashCATs every year, and the number continues to grow as more students trust its quality and relevance.
The increasing participation clearly shows that serious CAT aspirants understand the importance of mock tests. Practicing in a structured and realistic exam environment is no longer optional it plays a crucial role in turning preparation into actual performance on exam day.
Correlation Between DashCAT Score and CAT Score
DashCATs are designed to be slightly tougher than the actual CAT. The difficulty level is moderate to high so that students can adapt to real exam pressure instead of just solving easy questions. Below is a comparison of average DashCAT scores vs actual CAT 2025 scores based on real student data.
Comparison for Top Performers
| Avg. DashCAT Score | Actual CAT Score | Total DashCATs Given | Delta |
|---|---|---|---|
| 98.05 | 107 | 19 | +8.95 |
| 96.67 | 113 | 12 | +16.33 |
| 92.56 | 100 | 18 | +7.44 |
| 87.00 | 104 | 11 | +17.00 |
| 83.69 | 80 | 16 | -3.69 |
| 83.22 | 99 | 18 | +15.78 |
Comparison at the Middle
| Avg. DashCAT Score | Actual CAT Score | Total DashCATs Given | Delta |
|---|---|---|---|
| 66.64 | 69 | 14 | +2.36 |
| 66.61 | 80 | 18 | +13.39 |
| 65.20 | 63 | 20 | -2.20 |
| 61.75 | 89.37 | 20 | +27.62 |
| 59.53 | 64 | 17 | +4.47 |
| 58.55 | 52 | 11 | -6.55 |
Note: This data includes only students who attempted 10 or more DashCATs. On average, students can expect 10-15 marks higher in the actual CAT compared to their DashCAT average. The more mocks you take, the better you get at handling exam pressure so aim for 20+ mocks for the best results.
Score Delta = Actual CAT Score – Avg. DashCAT Score (This shows how much a student scored above or below their DashCAT average in the real exam.)
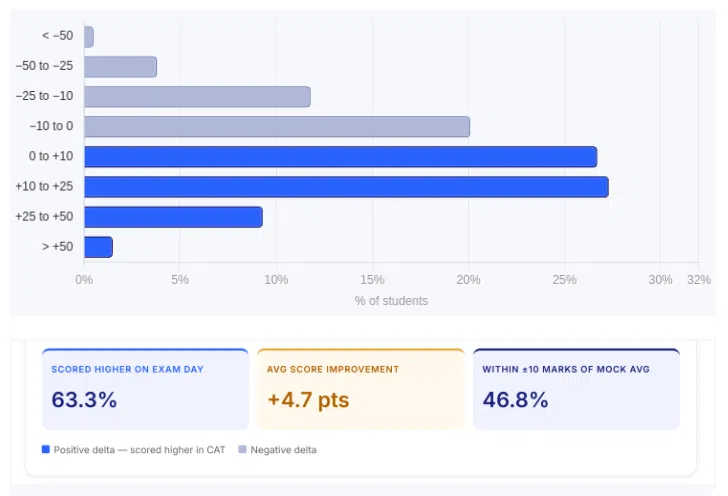
Cracku's DashCAT Percentile vs Actual CAT Percentile
Among students who took both DashCAT mocks and the CAT 2025, around 71% saw an improvement in their percentile in the actual exam compared to their average DashCAT percentile. One reason for this is that DashCAT percentiles are calculated within a more competitive group of serious aspirants, unlike the full CAT pool of over 2.5 lakh students.
Another important reason is consistent preparation. Students who regularly took DashCATs became more comfortable with exam pressure, time management, and question patterns. This practice helped them perform better on the actual exam day.
Overall, DashCAT mocks are designed to feel slightly tougher so that the real CAT exam feels more manageable. This is why many students end up scoring a higher percentile in the actual exam.

What DashCAT Percentile Translated to in CAT 2025
The data shows a clear and consistent pattern your average DashCAT percentile is a good indicator of how you are likely to perform in the actual CAT 2025. Students who consistently score well in mocks tend to achieve similar or even better percentiles in the real exam.
Percentile Comparison Table
| Avg. DashCAT Percentile | Avg. CAT 2025 Percentile | % Crossing 90th in CAT | % Crossing 99th in CAT |
|---|---|---|---|
| ~70th | ~87th | 51% | — |
| ~80th | ~90th | 63% | 8% |
| ~90th | ~92nd | 85% | 22% |
| ~95th | ~97th | 90% | ~50% |
The trend is simple: consistent performance in DashCAT mocks leads to strong results in the actual exam. For example, students who averaged around the 95th percentile in DashCAT had nearly half of them reach the 99th percentile in CAT. This is not by chance it is the result of regular practice, better time management, and getting comfortable with exam pressure.
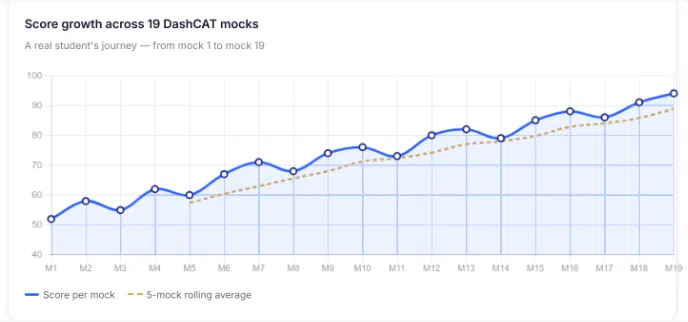
Every Mock Counts: Tracking Score Growth Across DashCATs
The chart below shows a real student’s progress across 19 DashCAT attempts, and one thing is clear it’s not a straight upward line. In the beginning, scores are usually lower, often in the 50s or low 60s, as students are still getting used to the exam pattern, time pressure, and difficulty level.
There are ups and downs during the journey. It’s normal to score well in one mock and then drop in the next. This should not worry you. What really matters is the overall progress. As students keep practicing, their scores usually improve, reaching the 70s and 80s after a few mocks. Those who attempt 15+ mocks often stabilize in the high 80s to mid 90s.
This pattern is common for most students. Taking more mocks may not guarantee a perfect score, but it helps reduce inconsistency and improves overall performance. In simple terms, regular practice helps you become more stable and confident in the actual exam.
Aim for 20 or more DashCATs before exam day. The first few mocks are about learning the format. The last few are about proving to yourself that you are ready.
How Does Cracku's DashCAT Prepare Students for CAT?
Mock tests are a very important part of preparing for the CAT. They help students understand the exam pattern and learn how to manage time and pressure during the test. DashCAT supports this by providing mocks that are very similar to the actual CAT in terms of difficulty and format.
One of the biggest advantages of DashCAT is its detailed analysis after each test. Students can clearly see their performance based on accuracy, time management, and question selection. This helps them understand their mistakes and improve their strategy with every mock.
With regular practice, students become more confident and develop a smarter way to attempt the exam. It’s not just about knowing concepts, but also about applying them effectively under pressure. Starting early, tracking your progress, and learning from each mock can make a big difference. In the end, students who reach top percentiles are usually the ones who practice consistently and strategically.