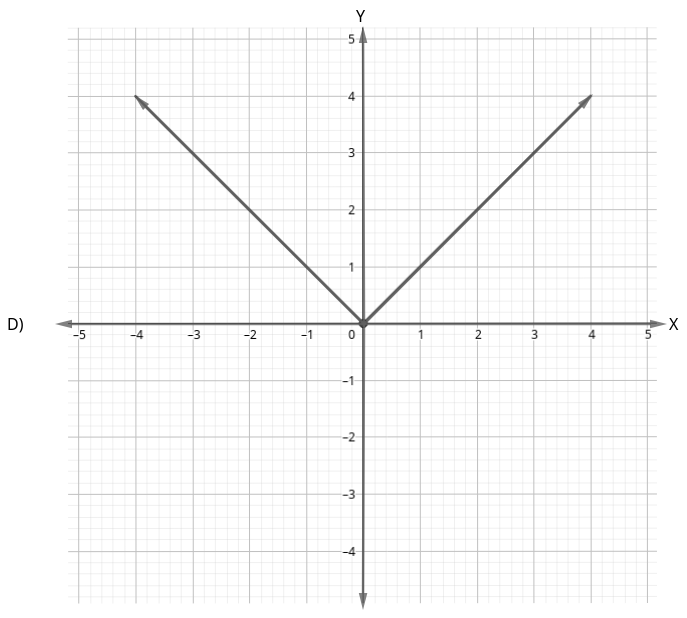
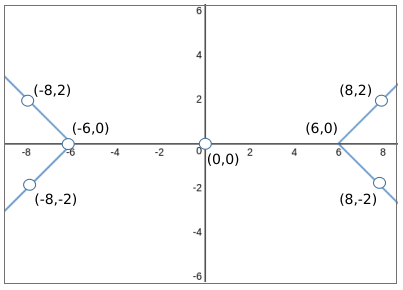
Consider the following figure that shows the graph of the function $$F$$ defined by
$$F(x) = | 2x | + 4$$ for all numbers x:
For which of the following functions G defined for all numbers x does the graph of G intersect the graph of F?
Sign in
Please select an account to continue using cracku.in
↓ →
Consider the following figure that shows the graph of the function $$F$$ defined by
$$F(x) = | 2x | + 4$$ for all numbers x:
For which of the following functions G defined for all numbers x does the graph of G intersect the graph of F?
F(x) = |2x| + 4
Option A: G(x) = x + 3
If x > 0 or x = 0
2x + 4 = x + 3
x = -1 < 0
Therefore, this case is not possible.
If x < 0
-2x + 4 = x + 3
3x = 1
x = 1/3 > 0
Therefore, this case is not possible.
Option B: G(x) = 2x - 2
If x > 0 or x = 0
2x + 4 = 2x - 2
This case is not possible.
If x < 0
-2x + 4 = 2x - 2
x = 1.5 > 0
This case is not possible.
Option C: G(x) = 2x + 3
If x > 0 or x = 0
2x + 4 = 2x + 3
This case is not possible.
If x < 0
-2x + 4 = 2x + 3
x = 0.25 > 0
This case is not possible.
Option D: G(x) = 3x - 2
If x > 0 or x = 0
2x + 4 = 3x - 2
x = 6
This case is possible.
Therefore, the answer is option D.
Functions, Graphs and Statistics Questions are an important part of the Quantitative Aptitude section in CMAT 2027. These questions assess a candidate's understanding of mathematical functions, graphical interpretation, and basic statistical concepts such as mean, median, mode, and data representation. Candidates may be required to interpret graphs, analyze numerical data, and apply statistical reasoning to solve problems efficiently. Aspirants preparing for the CMAT 2027 Exam should thoroughly study these topics as part of the CMAT Syllabus to strengthen their Quantitative Aptitude skills and improve overall exam performance.
Regular practice of Functions, Graphs and Statistics Questions helps candidates improve data interpretation, analytical thinking, and numerical problem-solving abilities. Understanding how to interpret charts, graphs, and statistical measures enables candidates to solve questions accurately within the limited exam time. Practicing questions from CMAT Previous Papers helps candidates become familiar with the level and variety of questions that may appear in the exam. Additionally, taking a CMAT Mock Test provides valuable exam practice, improves speed and accuracy, and helps candidates identify areas that require further improvement before CMAT 2027.
Yes, Functions, Graphs and Statistics is an important topic in the Quantitative Aptitude section of CMAT. It tests a candidate's ability to interpret data, understand mathematical relationships, and apply statistical concepts to solve problems.
The number of Functions, Graphs and Statistics questions varies from year to year. CMAT does not specify a fixed number of questions from any individual Quantitative Aptitude topic.
CMAT may include questions on mathematical functions, graph interpretation, line graphs, bar graphs, pie charts, tables, mean, median, mode, and other basic statistical concepts.
Build a strong understanding of fundamental concepts, practice interpreting different types of graphs and charts, revise statistical formulas, and solve previous year questions and mock tests regularly.
Most Functions, Graphs and Statistics questions in CMAT are of easy to moderate difficulty. Consistent practice and a clear understanding of concepts can help candidates solve them quickly and accurately.
Cracku's CMAT Functions, Graphs and Statistics Questions provide topic-wise practice, detailed solutions, and exam-oriented questions that help candidates strengthen concepts, improve accuracy, and boost confidence for CMAT 2027.
Start your IIM journey with the right preparation and crack CAT 2026.
Educational materials for CAT preparation