Solution
In these type of questions
we go through the options :
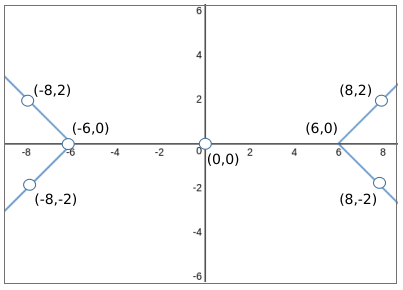
Now when x=6 or -6 the value of y is 0
so let us put value of y=0 in all options and check which option satisfies x=6 and -6
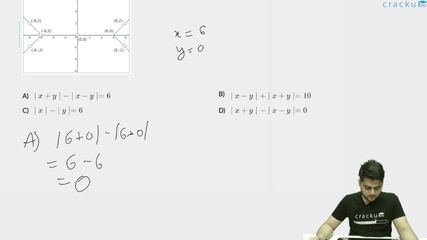
Putting x=6 and y=0 in option A
we get |6+0|-|6-0| = 0
But RHS =6 so this option is discarded
Now putting in option B
|6-0|+|6+0| =12
But RHS is 10
so this option is also discarded .
Now option C we get
|6|-0 =6
so we can say graph can be of |x|-|y|=6
Now satisfying option D
we get |6+0|-|6-0|=0
So we can say 6,0 and -6,0 satisfies option D as well
Now you have to eliminate between C and D
If you observe |x+y|-|x-y|=0 will pass through origin
and the graph here is not passing through origin so you can eliminate option D
Therefore the graph will be |x|-|y|=6
Get AI Help
Video Solution
Click on the Email ☝️ to Watch the Video Solution
Create a FREE account and get:
- All Quant Formulas and shortcuts PDF
- 40+ previous papers with detau solutions PDF
- Top 500 MBA exam Solved Questions for Free

CMAT Quant Questions | CMAT Quantitative Ability
CMAT DILR Questions | LRDI Questions For CMAT
CMAT Verbal Ability Questions | VARC Questions For CMAT
Free CMAT Quant Questions
Book Free CAT Mentorship
Get personalized CAT strategy from a 99%iler
500+ students mentored
OTP Verification
Enter the 6-digit code sent to your phone
Booking Summary
Enter OTP
Didn't receive the OTP?


