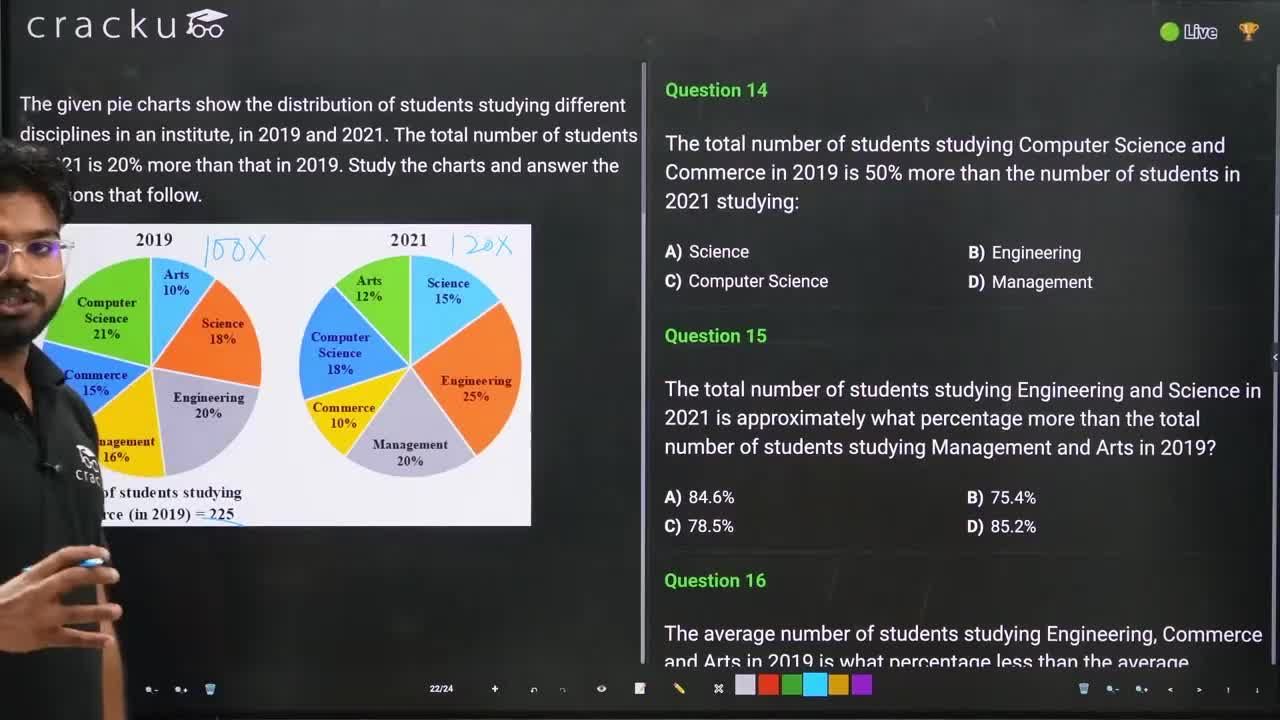
The given pie charts show the distribution of students studying different disciplines in an institute, in 2019 and 2021. The total number of students in 2021 is 20% more than that in 2019. Study the charts and answer the questions that follow.

The total number of students studying Computer Science and Commerce in 2019 is 50% more than the number of students in 2021 studying:
Solution
The required figure is given below:
Let the total number of students in 2019 be $$x$$.
Number of Commerce students = $$15\%\ of\ x=225$$ (given)
$$x=1500$$
Number of students in 2021 increased by 20% as compared to 2019.
Total number of students in 2021 = $$1500\times\left(1+20\%\right)=1800$$
In 2019,
Number of students in Computer Science = 21% of 1500 = 315
Number of students in Arts = 10% of 1500 = 150
Number of students in Science = 18% of 1500 = 270
Number of students in Engineering = 20% of 1500 = 300
Number of students in Management = 16% of 1500 = 240
Number of students in Commerce = 225 (given)
In 2021,
Number of students in Computer Science = 18% of 1800 = 324
Number of students in Arts = 12% of 1800 = 216
Number of students in Science = 15% of 1800 = 270
Number of students in Engineering = 25% of 1800 = 450
Number of students in Management = 20% of 1800 = 360
Number of students in Commerce = 10% of 1800 = 180
Total number of students studying Computer Science and Commerce in 2019 = 315 + 225 = 540
Let the number of students studying a particular subject in 2021 = $$x$$
Total number of students studying Computer Science and Commerce in 2019 is 50% more than the number of students studying a particular subject in 2021
Hence, $$x\times\left(1+50\%\right)=540$$
$$x=360$$
The required subject in 2021 is Management.
Hence, total number of students studying Computer Science and Commerce in 2019 is 50% more than the number of students studying Management in 2021.
$$\therefore\ $$ The required answer is D.
Get AI Help
Video Solution
Click on the Email ☝️ to Watch the Video Solution

SRCC Quant Questions | SRCC Quantitative Ability
SRCC DILR Questions | LRDI Questions For SRCC
SRCC Verbal Ability Questions | VARC Questions For SRCC
Free SRCC DILR Questions
Book Free CAT Mentorship
Get personalized CAT strategy from a 99%iler
500+ students mentored
OTP Verification
Enter the 6-digit code sent to your phone
Booking Summary
Enter OTP
Didn't receive the OTP?


