Question 140
Study the given pie-chart and answer the question that follows.
The pie-chart shows the number of boys studying in play group of various schools (A, B, C).
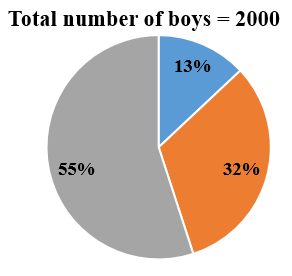
What is the average number of boys studying in schools A and C?
Create a FREE account and get:
- Free SSC Study Material - 18000 Questions
- 230+ SSC previous papers with solutions PDF
- 100+ SSC Online Tests for Free


