Sign in
Please select an account to continue using cracku.in
↓ →
 CAT WhatsApp Group
The chart below shows the price data for seven shares - A, B, C, D, E, F, and G as a candlestick plot for a particular day. The vertical axis shows the price of the share in rupees. A share whose closing price (price at the end of the day) is more than its opening price (price at the start of the day) is called a bullish share; otherwise, it is called a bearish share. All bullish and bearish shares are shown in green and red colour respectively.
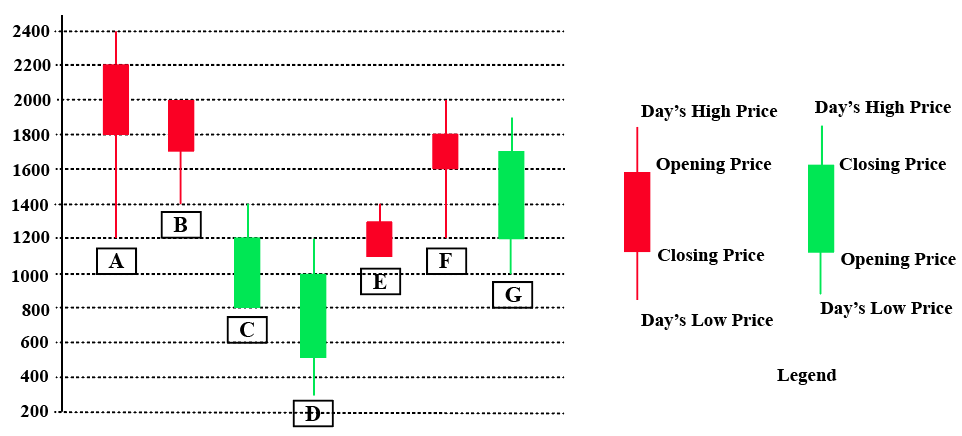
Daily Share Price Variability (SPV) is defined as (Day’s high price - Day’s low price) / (Average of the opening and closing prices during the day). Which among the shares A, C, D and F had the highest SPV on that day?

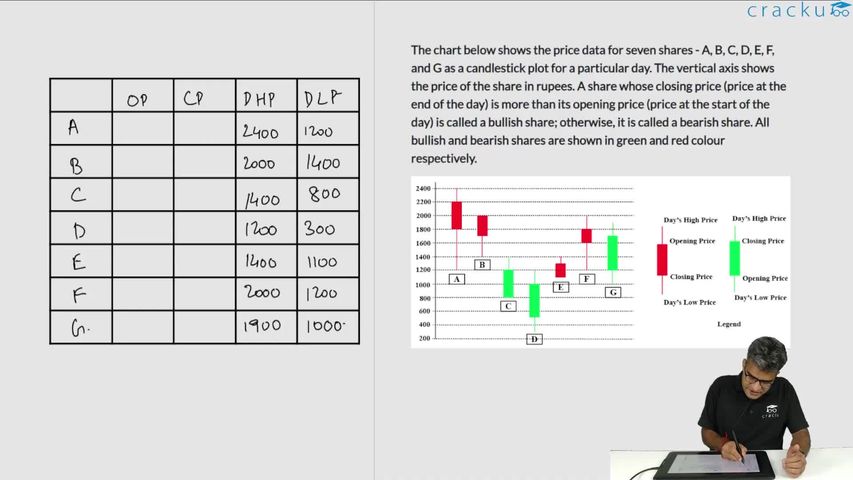
Writing down the values given in the candlestick chart in the form of a table for ease of calculation,
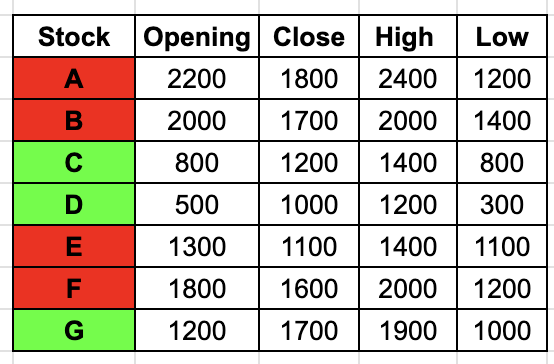
We are given that, Daily Share Price Variability (SPV) is defined as (Day’s high price - Day’s low price) / (Average of the opening and closing prices during the day)
Calculating it for the four options,
Stock F: 800/1700=8/17
Stock A: 1200/2000=3/5
Stock D: 900/750=90/75=6/5
Stock C: 600/1000=3/5
Clearly Stock D has the highest SPV.
Click on the Email ☝️ to Watch the Video Solution
Create a FREE account and get:
Book Free CAT Mentorship
Get personalized CAT strategy from a 99%iler
500+ students mentored
OTP Verification
Enter the 6-digit code sent to your phone
Booking Summary
Enter OTP
Didn't receive the OTP?
Start your IIM journey with the right preparation and crack CAT 2026.

Educational materials for CAT preparation

Ask our AI anything

AI can make mistakes. Please verify important information.
AI can make mistakes. Please verify important information.
 91- 6303239042