Number of consumers in the age group 26-40 who did not prefer drink B is
SRCC GBO 2013 Question Paper
The table given below indicates the number of consumers who preferred one or both drinks. Read the table and answer questions.

Solution
Let's tabulate all the information from the given table:
The calculation is as follows:
Consider the male 18 - 25 range:
=> Total consumers = 600
=> Out of them, 240 like A, 180 like B, 90 like both
=> Number of people who like either = 240 + 180 - 90 = 330
=> 600 - 330 = 270 people don't like any of the drinks.
Doing the same calculation for all the categories and tabulating, we get:

In the age group 26 - 40, Males: 840 - 480 = 360 did not prefer B, Females: 540 - 360 = 180 did not prefer B, in total 360 + 180 = 540 is the required answer.
Number of consumers over 40 years who preferred at least one drink is
Solution
Let's tabulate all the information from the given table:
The calculation is as follows:
Consider the male 18 - 25 range:
=> Total consumers = 600
=> Out of them, 240 like A, 180 like B, 90 like both
=> Number of people who like either = 240 + 180 - 90 = 330
=> 600 - 330 = 270 people don't like any of the drinks.
Doing the same calculation for all the categories and tabulating, we get:
In the 41-60 category: The number of consumers who preferred either of the two drinks = 420 + 360 = 780.
The number of consumers in the age group 18-25 who prefer only one drink is
Solution
Let's tabulate all the information from the given table:
The calculation is as follows:
Consider the male 18 - 25 range:
=> Total consumers = 600
=> Out of them, 240 like A, 180 like B, 90 like both
=> Number of people who like either = 240 + 180 - 90 = 330
=> 600 - 330 = 270 people don't like any of the drinks.
Doing the same calculation for all the categories and tabulating, we get:
In 18-25:
Males: Number of people who only prefer 1 drink = 240 + 180 - 2*90 [subtracting those who like both] = 240
Females: 180 + 120 - 2*60 = 180
=> Required answer = 240 + 180 = 420.

The percent of consumers more than 40 years of age who did not prefer any one of the drink is about
Solution
Let's tabulate all the information from the given table:
The calculation is as follows:
Consider the male 18 - 25 range:
=> Total consumers = 600
=> Out of them, 240 like A, 180 like B, 90 like both
=> Number of people who like either = 240 + 180 - 90 = 330
=> 600 - 330 = 270 people don't like any of the drinks.
Doing the same calculation for all the categories and tabulating, we get:
Total consumers above 40 years old = 1200 + 960 = 2160; out of these, 780 + 600 = 1380 preferred none of the drinks.
=> Required %age = 1380/2160 * 100 = 63.88 = 69%
In all, how many consumers did not prefer any drink?
Solution
Let's tabulate all the information from the given table:
The calculation is as follows:
Consider the male 18 - 25 range:
=> Total consumers = 600
=> Out of them, 240 like A, 180 like B, 90 like both
=> Number of people who like either = 240 + 180 - 90 = 330
=> 600 - 330 = 270 people don't like any of the drinks.
Doing the same calculation for all the categories and tabulating, we get:
Total consumers above 40 years old = 1200 + 960 = 2160; out of these, 780 + 600 = 1380 preferred none of the drinks.
=> Total number of consumers who did not prefer any drink is 270 + 90 + 780 + 480 + 240 + 600 = 2460
The following table classifies the tea and coffee habits of all employees of a company. Complete the table and answer the questions.

How many Employees drink more than 3 three cups of tea a day?
Solution
The completed tables will be:
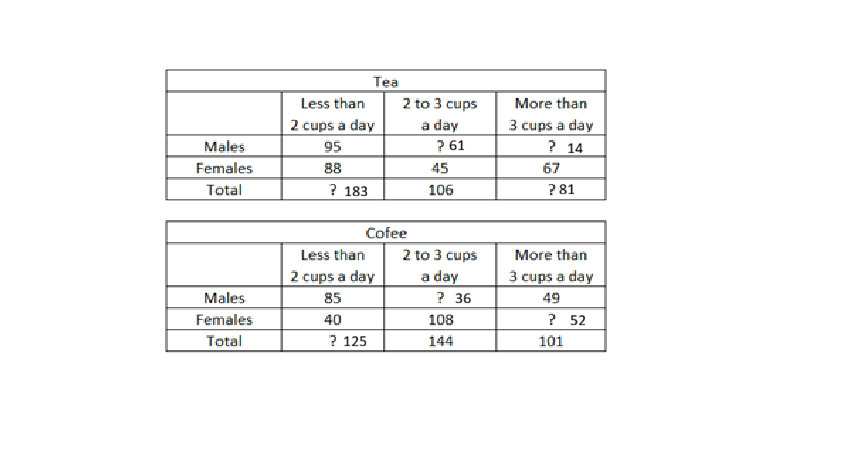
Employees drinking more than 3 cups of tea a day = 81.

Number of females who drink two or more cups of a tea per day is
Solution

Number of females who drink two or more cups of a tea per day are 45 + 67 = 112.
The percentage of male employees in the company is close to
Solution
According to the table, number of male employees = 85 + 36 + 49 = 170 and,
Total number of employees = 125 + 144 + 101 = 370.
The percentage of male employees = $$\frac{170}{370}\times\ 100\ \approx\ 45.9\%$$.
The number of employees who drink upto three cups of coffee per day is
Solution
According to the table, employees who drink upto 3 cups of coffee per day are: 144 + 125 = 269.

The ratio of the number of males who drink two or more cups of tea per day to the number of employees who drink less than 2 cups of coffee per day is
Solution

The required ratio = (61+14) : 125 = 75 : 125 = 3:5.
The following table gives demand and supply of cement, in million tons, for the period 2005 to 2010. Surplus is defined as excess of supply over demand. Read the table and answer the Questions.

The surplus of cement was lowest for the year
Solution
Surplus = Supply - Demand.
Surplus in,
2005 = 3.1
2006 = 0.6
2007 = 1.2
2008 = 0.8
2009 = 2.5
2010 = 0.7
The surplus is minimum for the year 2006.
The percentage increase in demand of cement was the highest as compared to its previous year in
Solution
Percentage increase in Demand = $$\frac{Current\ year\ demand\ -\ \Pr evious\ year\ demand}{\Pr evious\ year\ demand}\times\ 100$$.
This percentage is highest for 2009 i.e. $$\frac{57.5-53.4}{53.4}\times\ 100\ =\ 7.6\%$$.

What was the approximate average surplus (in million tons) of cement for the period 2005 to 2010 ?
Solution
Surplus = Supply - Demand.
So, Surplus for the period 2005 - 2010 = Total Supply - Total Demand = 8.9.
The average surplus = 8.9/6 = 1.48.
In how many years the supply (in million tons) of cement was more than the average supply for 2005 to 2010 ?
Solution
The average supply for 2005 to 2010 = $$\frac{48.2+48.3+51.2+54.2+60+62.4}{6}=54.05$$.
The annual supply for 2008, 2009 and 2010 is greater than the average i.e. for 3 years.
For the years 2005 to 2010, total supply of cement was x % more thanthe total demand. The value of x is closest to
Solution
Total Supply for all the years combined = 324.3 and Total Demand = 315.4.
Percentage by which Supply is more than Demand = $$\frac{324.3-315.4}{315.4}\times\ 100=2.82\%$$.

The following table shows the FDI in different states of a country in the year 2009-10.

The following graph shows the investment in different sectors.

Read the table and graph and answer the questions.
In which of the following pairs of states the ratio of investment (FDI) in power sector is 11 : 8 ?
Solution
Ratio of investment (FDI) in power sector of A and B = 55:58,
of B and C = 29:33,
of C and E = 11:8 and,
of A and D = 11:12.
Thus, the correct option is C.
The ratio of investment in IT in state G to the investment in ‘others’ in state A is
Solution
The investment in IT in state G = 30% of 600 = 180 and ,
the investment in ‘others’ in state A = 18% of 550 = 99.
The ratio = 180 : 99 = 20:11.
The total investment (in ₹ crore) in ‘Road Sector’ by states B, C and D is
Solution
Total Investments by states B, C and D = 580 + 660 + 560 = 1800.
Investment in Road Sector = 20% of 1800 = 360.
The FDI in cinema sector in state E is about what percent less than that in state B in telecom sector ?
Solution
FDI in cinema sector of E = 5% of E's FDI = 0.05*480 = 24.
FDI in telecom sector of B = 13% of B's FDI = 0.13*580 = 75.4
The FDI in cinema sector in state E is less than that in state B in telecom sector by: $$\frac{75.4-24}{75.4}\times\ 100\ =\ 68.1\%$$ $$\approx\ 68\%$$.
FDI in IT sector in State A is approximately what percent of that in telecom sector in state G and F combined ?
Solution
FDI in IT sector in State A = 30% of 550 = 165 and,
FDI in telecom sector in state G and F combined = 13% of (600 + 510) = 144.3.
The required percentage = $$\frac{165}{144.3}\times\ 100\ \approx\ 114.3\%$$.
Read the following graph and answer the questions:

The difference (in lakh tons) between the average production of sugar by six factories in 2009 and average production by the same factories in 2008 is about
Solution
Average production in 2009 = 70.833
Average production in 2008 = 61.667.
The difference = 9.166 $$\approx\ $$ 9.2
The percentage increase in production of sugar by factory B from 2009 to 2010 is approximately
Solution
The percentage increase in production of sugar by factory B from 2009 to 2010 = $$\frac{75-70}{70}\times\ 100\ \approx\ 7.1\%$$.
Which of the six factories has recorded the maximum percentage growth in production from 2008 to 2009 ?
Solution
Growth percentage from 2008 to 2009 = $$\frac{\Pr oduction\ in\ 2009\ -\ \Pr oduction\ in\ 2008}{\Pr oduction\ in\ 2008}\times\ 100$$.
Growth percentage in factory A = 7.7%,
in B = 16.6%,
in C = 22.22%,
in D = 30.7%,
in E = 0% and,
in F = 20%.
The highest growth in percentage terms is in the Production by factory D.
Production of sugar by factory C in 2009 and production of sugar by factory F in 2010 together is what percent of production by B in 2010 ?
Solution
Production of sugar by factory C in 2009 and production of sugar by factory F in 2010 together = 55 + 65 = 120.
Production by B in 2010 = 75.
The required percentage = $$\frac{120}{75}\times\ 100\ =\ 160\%$$.
In which of the following pairs of factories, the difference between average production for 2009 and 2010 is minimum?
Solution
Average production for 2009 and 2010 for all the factories are:
A = 70+55/2 = 62.5
B = 72.5
C = 52.5
D = 82.5
E = 90
and F = 62.5.
The minimum difference from among the options is D and E i.e. 7.5.
So, the correct answer is Option D.
The following pie-charts show the distribution of expenses over six different items A, B, C, D, E and F of a person for July and August 2012. She spent ₹ 27,000 in July and ₹ 30,000 in August, 2012


Read the charts and answer the questions
The ratio of money spent one items C and F together in July to that spent on B and E together in August is
Solution
Money spent on items C and F together in July = $$\frac{36+54}{360}\times\ 27000=6750$$.
Money spent on B and E together in August = $$\frac{72+54}{360}\times\ 30000=10500$$.
Required ratio = 6750 : 10500 = 9:14.
The difference (in ₹) between the amounts spent on C in August and D in July is
Solution
The amount spent on C in August = $$\frac{45}{360}\times\ 30000=3750$$ and,
The amount spent on D in July = $$\frac{72}{360}\times\ 27000\ =\ 5400$$.
The required difference = 5400 - 3750 = 1650.
The sum of the difference between the expenditurers in july and August on items C and that of F as a percentage of the change in total expenditure between the two months is
Solution
Amount Spent on C in July = $$\frac{45}{360}$$ of Total expense i.e. $$\frac{45}{360}\times\ 27000\ =\ 3375$$.
Amount spent on F in July = $$\frac{45}{360}\times\ 27000\ =\ 3375$$.
Amount spent on C in August = $$\frac{36}{360}\times\ 30000\ =\ 3000$$.
Amount spent on F in August = $$\frac{54}{360}\times\ 30000=4500$$.
Difference in expenditures of C = |3375 - 3000| = 375
Difference in expenditures of F = |4500 - 3375| = 1125
Sum of differences = 1500 and Total change in expenditures for the 2 months = 30000 - 27000 = 3000.
Now, percentage of Sum of differences on Total change = $$\frac{1500}{3000}\times\ 100\ =\ 50\%$$.
Number of items of July on which money spent is less than the average money spent on items in the month is
Solution
Number of items = 6 and total money spent = 360 degrees.
Average money spent = 360/6 = 60 degrees.
Number of items of July on which money spent is less than the average money spent on items in the month are 4 i.e. B, C, E and F.
If the amount spent on item B in August were the same as that in July, what would have been its central angle in the pie chart?
Study the following graph and answer the questions.

Total production of paper of the three factories together is equal for the years
Solution
Total production of paper of the three factories in the year:
2004 = 135,
2005 = 145,
2006 = 145,
2007 = 180,
2008 = 165,
2009 = 195 and,
2010 = 195.
So, the correct option is D i.e. 2009,2010.
In which of the following years for the factory B, the percentage rise or fall in the production from the previous year is maximum?
Solution
Production change in 2005 = $$\frac{50-30}{30}\times\ 100\ =\ 66.67\%$$,
in 2006 = $$\frac{15}{50}\times\ 100\ =\ 30\%$$,
in 2007 = $$\frac{20}{35}\times\ 100\ =\ 57.14\%$$,
in 2008 = $$\frac{5}{55}\times\ 100\ =\ 9.09\%$$,
in 2009 = $$\frac{10}{50}\times\ 100\ =\ 20\%$$ and,
in 2010 = $$\frac{5}{60}\times\ 100\ =\ 8.33\%$$.
So, the highest change is in 2005.
Average production of paper for year for the factory A is the what percentage of Avearage production per year for factory c?
Solution
Average production of paper for year for the factory A = 420/7.
Average production of paper for year for the factory C = 400/7.
The required percentage = $$\frac{\frac{420}{7}}{\frac{400}{7}}\times\ 100=105\%$$.
Ratio of total production of paper to the factory A to the total production by factory c is
Solution
Total Production by Factory A = 55 + 60 + 50 + 60 + 55 + 65 + 75 = 420.
Total Production by Factory C = 50 + 35 + 55 + 65 + 60 + 70 + 65 = 400.
The required ratio is 420 : 400 = 21:20.
In how many years the production of paper (in thousand tons)by factory c is less than the average production of paper by factory B over the years
Solution
Average production of paper by factory B over the years = 335/7 = 47.85.
Number of years the production of paper (in thousand tons)by factory c is less than the average production of paper by factory B over the years = 1 i.e. 2005 only.
Study the following graph (i) and (ii) which shows income in(₹ in crores) and percentage profit over the years 2003 to 2008, and answer the questions


In which year was the amount of profit was maximum?
Solution
Income = Expenditure*(1+P%) ==> Expenditure = $$\frac{Income}{1+P\%}$$.
Profit = Income - Expenditures ==> $$Income\ -\ \frac{Income}{1+P\%}=Income\times\ \left(\frac{1+P\%-1}{1+P\%}\right)=Income\times\ \left(\frac{P\%}{1+P\%}\right)$$.
This formula gives profits for all the years as:
2003 = 7.65,
2004 = 14.7
2005 = 14.36
2006 = 14
2007 = 17.87 and,
2008 = 16.66.
The year in which profit is maximum is 2007.
Difference in the amount of profit for 2005 and 2008 is
Approcimately what was the average expenditure(in ₹ crores) for the given years?
Solution
Profit % = $$\frac{Income\ -\ Expenditure}{Expenditure}\times\ 100$$.
Using this formula, we can calculate uniquely the Expenditures for every year.
The expenditures will be: 111.6, 65.3, 75.6, 56, 102.21 and 83.3 for the years 2003, 2004, 2005, 2006, 2007 and 2008 respectively.
This gives the average amount of Expenditures = Sum/6 $$\approx\ $$ 82.2.
The expenditure (in ₹ crores) in 2006 is
Solution
Profit % = $$\frac{I\ -\ E}{E}\times\ 100$$ where I = 70 and Profit % = 25.
This gives E(expenditure) for 2006 = 56.
If the profit percent in 2008 was 25, what would have been the expenditure (in ₹ crores) in that year ?
Solution
Profit % = $$\frac{I\ -\ E}{E}\times\ 100$$ where I = 100 and Profit % = 25%.
This gives the E(expenditure) for 2008 = 80.
In each of the following sentences four words or phrases have been underlined. One underlined part in each sentenceis not acceptable in standard English. Pick up that part and mark its number.
The government initiated/(1) various measure/(2) to raise/(3) the living standards/(4) of the people.
Solution
The government initiated various measures (plural) is the correct sentence.
Various measure is incorrect because the preceding word is 'various', showing plurality, it should be followed by a plural form of a word.
The book must be/(1) old for/(2) its cover is torn/(3) bad/(4)
Solution
Bad is the wrong word here because the sentence is describing the degree or extent of the tearing; how torn the cover is, not a moral or quality judgment.
The correct word is badly, an adverb, because it modifies the verb "torn", telling us how it is torn.
So the correct sentence is: "The book must be old, for its cover is torn badly"
The region has a climate so severe that/(1) the plants growing there/(2) had been/(3) rarely more than twelve inches high/(4)
The reason/(1) for my prolonged/(2) absence/(3) from the class was because/(4) I was ill.
Fill in the blanks with the most appropriate words.
When such .............. remarks are circulated, we can only blame and despise those who - produce them.
It would be difficult for one so ............. to be led to believe that all men are equal and that we must disregard race, colour and creed.
The enemy soldiers were hot in pursuit; desperate. The fugitive sought .............. in the village church.
Fitness experts claim that jogging is ............... once you begin to jog regularly, you may be unable to stop, because you are sure to love it more and more all the time.
Each question below consists of a related pair of words followed by four pairs of words.
Select the pair that best expressesthe relatioship similar to the original pair.
Clay: mould::
Solution
To figure out a similar pair, we first need to understand the pair already present.
The process of creating something out of clay is called moulding. So the relationship between clay and mould is that of the raw material and the process needed to transform it.
Similarly, the relationship between wood and carving is that of a raw material and the process for transforming it. Hence, it is the correct choice.
Other choices do not show the similar relationships at all.
Play: Acts::
Solution
To figure out a similar pair, we first need to understand the pair already present.
The relationship between a play and its acts is that a play is divided into acts that together form the whole play.
Similarly, a novel is divided into chapters that make up the complete novel. Hence, it is a similar pair.
Why not others:
Essay: topics- an essay is not divided into various topics; an essay is written on a single topic.
Game: players- a game is not divided into players, and players are not what form a game.
Poem: rhymes- rhyme is a literary style of poems; rhymes do not form a poem; stanzas form a poem.
Clock: time::
Solution
To figure out a similar pair, we first need to understand the pair already present.
The relationship between the clock and time is that the clock is an instrument that measures and shows time.
Similarly, a yardstick is an instrument that measures and shows distance.
Why not others:
- Watch and wrist do not have a measurement relationship.
- Radio and sound also do not have a measurement relationship.
- Odometer is used to measure distance and not speed so it is also incorrect.
Gazelle : swift::
Solution
To figure out a similar pair, we first need to understand the pair already present.
A gazelle is an animal that has swift, graceful movements. The relationship is between an animal and a positive adjective for its movements.
Similarly, a swan is an animal whose movements are described as graceful.
Why not others:
Horse: slow- a horse is not an animal with slow movements
Lamb: bleat- lamb makes a bleating sound, bleating is not about the lamb's movement
Lion: roar- roar is the sound the lion makes, not the movement,
In the following questions choose the alternative which best expresses the meaning of the given word.
Ecstasy
Solution
Ecstasy means happiness or joy.
Joy is the correct synonym for ecstasy.
Foster
Solution
Fostering means to support or encourage the development of something.
Rear means to help something grow, nurture or breed it. Hence, 'breed' is a close synonym of 'foster'.
Why not others:
- fondle- to stroke or caress lovingly
- roll- action of moving by turning over
- speed- rate at which object covers certain distance
Credible
Solution
Credible refers to being able to convince someone or believable.
Hence, believable is the correct synonym.
Insipid
Solution
Insipid refers to something dull, lacking in flavour, taste or interest.
Flat also refers to something dull or bland, lacking lustre, taste or interest. Hence, flat is the correct synonym.
Why not others:
Lucid means easy to understand.
Witty means full of wit and smarts.
Vulgar means unpleasant.
Choose the word which is opposite in meaning to the given word.
Hubbub
Undulating
Curtail
Resilient
In the following questions the word at the top is used in four different ways. Choose the option in which the usage of the word is incorrect or inappropriate.
PUSH
HARBOUR
RIGHT
MASTER
Fill in the blanks with appropriate alternative.
Anurag asked me ..............
During the summer months,there is
We heard an incessant noise from our neighbours' house. They .............. all the time.
The breakdown was said .............. a defective transformer.
In the following questions, a sentenceis given in active voice. Find the correct passive voice version from the given alternatives.
Somebody has put out the light.
Solution
- Locate the Subject (somebody), Verb (put out), and Object (light).
- The object of the active sentence becomes the subject of the passive sentence.
- The tense of the "be" verb must match the tense of the active sentence. (present perfect- has put out)
- The original subject (someone) is introduced with "by" (or dropped if unknown/unimportant), dropped here, since there is an unknown person (somebody)
Using these rules, " The light has been put out." is the right choice.
We justly rebuked him for acting so selfishly.
Solution
- Locate the Subject (we), Verb (rebuked), and Object (him).
- The object of the active sentence becomes the Subject of the passive sentence.
- The tense of the "be" verb must match the tense of the active sentence. (simple past- justly rebuked)
- The original Subject(we) is introduced with "by" (or dropped if unknown/unimportant)
Using these rules, "He was justly rebuked by us for acting so selfishly" is the correct choice.
The rules forbid passengers to cross the railway line.
Solution
- Locate the Subject (rules), Verb (forbid), and Object (passengers).
- The object of the active sentence becomes the subject of the passive sentence.
- The tense of the "be" verb must match the tense of the active sentence. (simple present- forbid)
- The original subject (rules) is introduced with "by" (or dropped if unknown/unimportant)
Using these rules, "Passengers are forbidden by the rules to cross the railway line." is the correct choice.
In the following sentences replace the underlined words with the appropriate expression from the given alternatives.
His friends expected that he would escape with a fine.
How did these things happen ?
Nobody was at home when the fire started.
The crew of the boat underwent terrible suffering.
In the following passage there are blanks which have been numbered. For each blank, four words are suggested. Find out the most appropriate word to fill in the blank.
If you ask some people, “How did you learn English so well ?” You may get a surprising answer : “In my sleep!”
These are ......76 who have taken part in one of the ..............77 exeriments to test learn- while-you-sleep methods, .......78 are now being tried out in several countries, and with ..........79 subject, of which English is only one. Specialists say that .........80. sleep study method speeds language learning tremendously.
76
77
78
79
80
In questions given below, Assumption ‘A’ is followed by Reasons RI and RII. Apply RI and RII to A and mark your answer as under:
A.Since time immemorial, more people have been killed or made to suffer in the name of religion than for any other reason.
RI. The essence of religion is hatred of other religions.
RII.Those who lose their lives in the name of religion go straight to Heaven, so devotees do not mind losing their lives
Solution
The assertion talks about people being killed in the name of religion, among other reasons. However, it doesn't state anything about hatred or that people who are dying shall straightaway go to heaven. Hence, none of the given reasons are correct.
A. Most of the columms of modern magazines are covered with news of political events.
RI.Readers are very much interested in political turmoil and scandals.
RII.It is not difficult to write about politics as one does not need originality.
Solution
The assertion talks about the abundance of columns on political events. Hence, it is clear that the readers are in the same, else this would not have been the case. However, we cannot comment on the originality, as those columns also require a certain level of effort/originality. Hence, only R1 is correct.
A.only Secularism in thought word and deed can save India from Chaos.
RI.Communal differences would only result in nots and destruction of life, faith, property
RII.our democracy Demands open mind and heart for moral, Spiritual and physical uplift of the country
Solution
The assertion talks about the need for secularism in India. R1 is too narrow by the use of 'only', while R2 is vague as we cannot say anything about the requirements of democracy and having an open mind/heart. R2 is totally disconnected with the idea of secularism.
A Vice-Chancellors do not have a very comfortable time.
RI.Students are always causing disciplinary problems.
RII. When people become vice-chancelors they are very old.
Solution
The assertion talks about Vice-chancellors not having a very comfortable lives.
R1 can be a possible reason since the VC is supposed to handle the internal affairs of a college. However, R2 is incorrect because the assertion does not talk about discomfort in sense of being old.
A. TV does not give much coverage to activities undertaken by ex-Presidents and Prime Ministers.
RI. Everyone salutes the chair.
RII. Those persons do not perform any activity worth mentioning.
Solution
The assertion talks about lesser coverage of the ex-president/PM.
R1 is incorrect, as saluting the chair shall not be the reason for not covering ex-members if they are performing significant functions.
R2 is correct, as the ex-members would not have many noteworthy activities under their portfolio.
Find the old-man out
Solution
Lazy, lethargic, and idle are synonyms. However, subdued means calm, which is entirely different in terms of the connotation.
Solution
Sabotage, blackmail, and forgery are criminal conduct. On the other hand, snobbery is an attitude in which one likes people of higher social status.
Solution
Orange, cotton, and snow are found naturally in the environment. However, milk is extracted from lactating animals through special efforts.
Solution
The odd one out is "Wall" as it is the final product.
Solution
The word "Tasty" is the odd one out as the other 3 words represent the state of a food item.
Match the following questions with (1), (2), (3) and (4) on the basis of similar relationship. The items may not be in the same order.
Car : road : petrol
Solution
As car operates on petrol, and runs on road: Pen operates on ink and writes on a paper.
Day: light : night
Solution
As day signifies light, and the opposite is night: Life signifies being alive, and the opposite is dead.
Music : dance : art
Solution
As music and dance are art forms, the Army and navy are a part of the defense.
Body : livere : heart
Solution
Just like liver and heart are situated in the body, post office and hospital are situated in the city.
A word arrangement machine when given an input line of words, rarranges them following a particular rule in each step. The following is the illustration of the input and the steps of arragement:
Input : She was shot dead at, her residence
Step I : at was shot dead she her residence
Step II : at her shot dead she was residence
Step III : at her she dead shot was residence
Step IV : at her she was shot dead residence
Step V: at her she was shot dead residence
Since the words are fully arranged, the machine stops. Otherwise it may go on till the words get fully arranged. Study the logic and answer the questions.
In how many steps will the following input be fully arranged ?
Input : India has always been a critical factor
Solution
In the final step, the words are arranged based on the number of letters in the word and words with same number of letters are arranged alphabetically.
Like in Step 1, as "at" should come on the 1st position because it has least number of letters, the 1st word i.e. "she" will be exchanged with "at".
Similarly, "India has always been a critical factor" will be arranged as:
Step 1: a has always been India critical factor
Step 2: a has been always India critical factor
Step 3: a has been India always critical factor
Step 4: a has been India always factor critical
So, the given sentence could be arranged in 4 steps.
What would be the Step III for the following input ?
Input : this is one thing on which I caution
Solution
The words are arranged on the basis of the number of letters and words with equal number of letters are arranged alphabetically.
At every nth step, nth word is exchanged with the correct word.
For, "this is one thing on which I caution", the steps will be:
step 1: I is one thing on which this caution
step 2: I is on thing one which this caution
step 3: I is on one thing which this caution.
So, the step 3 will be : I is on one thing which this situation
If step Il of an input reads "by he out the efforts made spells us," which of the following would be the last step ?
Solution
Step 2: by he out the efforts made spells us
Step 3: by he us out the efforts made spells
Step 4: by he us out the made efforts spells
Step 5: by he us out the made spells efforts.
So, the final step will be Step 5.
What could be the penultimate step for the following input ?
Input : You hardly see any motorised vehicle
Solution
The words are arranged on the basis of the number of letters and words with equal number of letters are arranged alphabetically.
At every nth step, nth word is exchanged with the correct word.
For the Input: You hardly see any motorised vehicle, the steps will be:
Step 1: any hardly see you motorised vehicle
Step 2: any see hardly you motorised vehicle
Step 3: any see you hardly motorised vehicle
Step 4: any see you hardly vehicle motorised
As the Input is completely arranged in 4 steps, the penultimate step is Step 3.
What could be the step IV for the following input ?
Input : the foliage along road can deceive you
Solution
The words are arranged on the basis of the number of letters and words with equal number of letters are arranged alphabetically.
At every nth step, nth word is exchanged with the correct word.
Now, for the Input : the foliage along road can deceive you,
Step 1: can foliage along road the deceive you
Step 2: can the along road foliage deceive you
Step 3: can the you road foliage deceive along
Step 4: can the you road along deceive foliage
Thus the answer is Option B.
Study the following information and answer the questions given below?
In a certain code, the symbol for 0 (Zero) is @ and for 1 is $. There are no other symbols for all other numbers greater than one. The numbers greater then | are to be written only by using the two symbols given above. The value of the symbol for 1 doubles itself every time it shift one place to the left. Study the following examples:
‘0’ is written as @
‘1’ is written as $
‘2’ is written as $ @
‘3’ is written as $ $
‘4’ is written as $ @@ and so on
Which of the following numbers will be represented by $ $ @ $ ?
Solution
Essentially, the code is a binary system where 1 is represented by $ and 0 is represented by @.
$$@$ can be written as 1101 and it's value will be 8 + 4 + 0 + 1 = 13.
Which of the following will represent the value of 3 x 3 +1 ?
Solution
Essentially, the code is a binary system where 1 is represented by $ and 0 is represented by @.
3*3+1 will be 10 and in binary system, 10 is written as 1010.
In the given code, 10 will be written as $@$@ i.e. Option B.
Which of the following numbers will be represented by $ @ @ @ $ ?
Solution
$@@@$ in the binary system can be written as 10001 which is 16 + 1 = 17.
What is the average of $$$@@ and $$@@
Solution
$$$@@ and $$@@ in binary system are 11100 and 1100 respectively.
In decimal system, they could be written as 28 and 12. Their average will be 20.
In binary system, 20 is written as: 10100 and the given code, it will be written as $@$@@.
What is the value of $$[(\$ @) + (\$ @) \div (\$ @)]^{\$ @}$$?
Solution
It is essentially a binary system where 1 is represented by $ and 0 is represented by @.
The given expression will be written as: [(10) + (10) / (10)]^(10) ==> [2 + 2/2]^2 = 3^2 = 9.
9 can be written as 3^2 i.e. (11)^10 is binary system.
In the code language, it can be written as ($$)^($@) i.e. Option D.
What is the value of $$[(8 + 16) \div (4 \times 3)]^3$$ ?
Solution
$$\left[\frac{\left(8+16\right)}{4\times\ 3}\right]^3=2^3=8$$.
In binary system, 8 will be written as 1000 and thus in the given code, it will be written as $@@@.
In each question below, there are three statements followed by four conclusions numbered I, II, III and IV. You have to take the given statements to be true even if they seem to be at variance with commonly known facts and then decide which of the given conclusions logically follow (s) from the given statement.
Statements : Some charts are darts.
All darts are carts.
Some carts are smarts.
Conclusions : I. Some charts are carts.
II. Some carts are darts -
III. Some darts are smarts.
IV. Some smarts are charts.
Solution
We shall test each of the conclusions:
1. Since all darts are carts and some darts are charts, it is definitely true that the charts that are darts shall be carts as well.
2. Since all darts are carts, this statement is true.
3. It is possible that the carts which are smart might not be darts at all.
4. Same logic as 3.
Statements : All boxes are tables.
No desks are tables.
Some desks are curtains.
Conclusions : I. No Boxes are desks.
II. Some Boxes are desks.
Ill. Some curtains are not boxes
IV. Some curtains are boxes.
Solution
1. Since all boxes are tables and no table is a desk, it is clear that no box shall be a desk. Hence, true.
2. Invalid with same logic as 1.
3. We know that no table is a desk, making no box a desk. Hence, the curtains which are desks cannot be boxes.
4. We can conclude 3 but we don't have much information to say whether some curtains are boxes.
Statement: No killer is a sweater.
No jacket is a sweater.
Some jacket are roses.
Conclusions : I. Some roses are sweters
II. some roses are not swaters.
Ill. No killer is a jucked.
IV. Some jackels are killers.
Solution
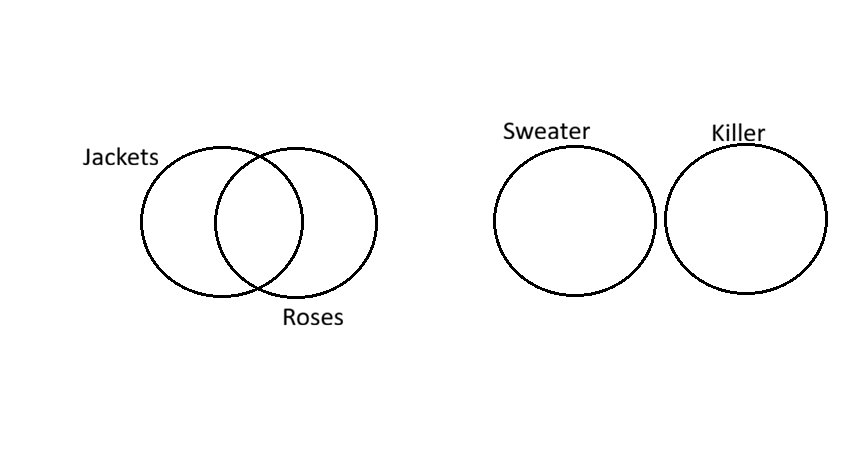
From the given information, we can infer that Either I or II and Either III or IV follow.
Statements: No student is decent
Some decent are bags.
All bags are roses
Conclusions: I. Some bags are not students.
II. All bags are students.
III. Some decents are roses.
IV. All roses are decent.
Solution
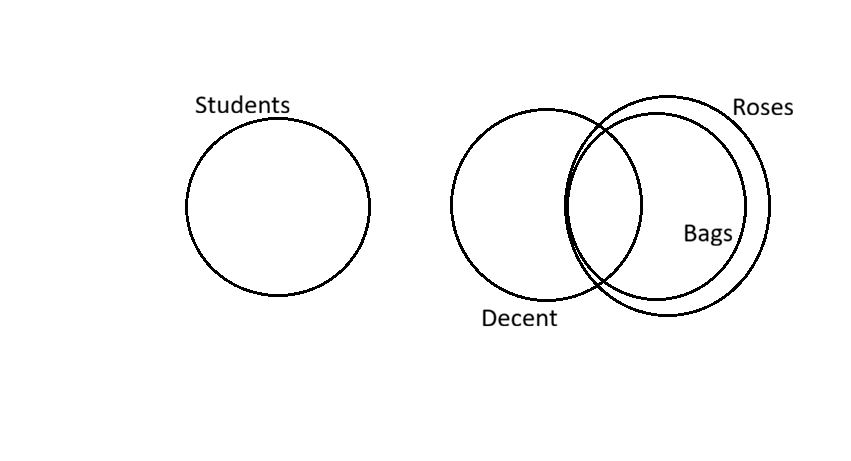
Only conclusions I and III follow.
Statements : Some birds are stones.
Some, tigers are birds.
All stones are grapes.
Conclusions : I. Some stones are birds.
II. Some stones ,are not birds.
Ill. Some grapes are birds.
IV. Some tigers are stones
Solution
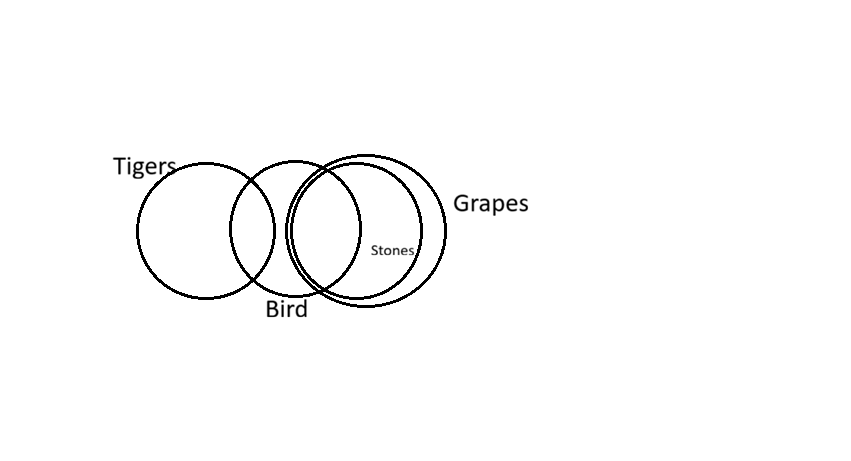
Only conclusions I and III follow.
A researcher studying organic compounds has found that five different molecules. T, W, X, Y and Z form chains according to the following rules :
A chain consists of three or more molecules, though the molecules in the chain are not necessarily different.
T is never found on either end of a chain.
If W appears in a chain, it appears more than once.
X is never found next to y in a chain.
W is never found on the end of a chain
unless Z is found somewhere in the chain.
If Y appears in a chain, Z appears also,
Whichof the following is a possible chain of molecules ?
Solution
TXYZ can not be a valid chain as T can not be at the end.
YTXX can not be a valid chain because Y and Z does not appear together.
WZTY can not be valid chain because W does not appear twice.
WWXZ is the only valid chain. Thus the answer is Option D.
Which of the followings is NOT possible chain of molecules ?
Solution
YWTZXX is not a possible chain because if W appears in a chain, it should appear atleast twice.
Thus, the answer is Option D.
The chain W W T Y Z X can be changed into another chain by carrying out any one of the following EXCEPT
Solution
A. A new chain can be formed by replacing Y with T.
B. A new valid chain can be formed by replacing Y with X.
C. The chain will be invalid if X is replaced by T because T can not appear on the end.
D. A valid chain can be formed by exchanging T and Z.
Thus, the answer is Option C.
Which of the following is not a chain but could be turned into a chain by changing the order of the molecules ?
Solution
XYTX and TXXY can not form a chain because the last condition is not satisfied i.e. If Y appears in a chain, Z appears also.
WTTW is not possible because both W and T are not found on the end of a chain.
WXXW is a possible chain by rearranging the elements as XWWX.
Which of the following sequences can be converted into a chain by adding Z and rearranging the molecules ?
I. X Y X T
II. W T T Z
III. X X Y W
Solution
XYXTZ forms a valid chain.
WTTZ and XXYW can not form a valid chain with Z because W should appear twice.
Thus, only I will be a valid chain with an additional Z.
In the following questions the symbols @, @, =, © and © are used with the following meaning :
P @ Q means P is greater than Q.
p @ Q means P is either greater than or equal to Q.
P = Q means is equal to Q.
P © Q means P is smaller than Q.
P © Q means P is either smaller than or equal to Q.
For each questions you have to assume given statements to be true and then decide which of the two given conclusions is / are definitely true. Give answer :
Statements: B @ V,K © C, C © B
Conclusions:
I. V @ C
II. B @ K
Solution
B>V, K<C, C<B
1. We know that both V and C are less than B. But we don't have any specific relation between V and C.
2. We know, B>C>K, hence B>K. Hence, true.
Statements : K @ T, S = K, T © R
Conclusions :
I.S @ R
II. T = R
Solution
K>T, S=K, T<R or T=R
1. We can conclude S>T. However, both S and R can be greater than T (or R=T), and hence, we cannot say that this conclusion is true.
2. This, again, is not certain.
Statements : U = M, P @ U, M @ B
Conclusion :
I. P = B
II. P @ B
Solution
U=M, P>U or P=U, M>B or M=B
from the given information, there are two possibilities as for both P/U and M/B, there are two cases.
Either P=B or P>B.
Statements: L @ N, J © P, P @ L
Conclusion:
I. J = L
II. P = N
Solution
L>N or L=N, J<P or J=P, P>L or P=L
1. Since there are two cases of P and L, we cannot say that J=L.
2. Same logic as 1.
Statements:H @ G, D @ E, H = E
Conclusion:
I. D @ H
II. G @ D
Solution
H>G or H=G, D>E, H=E
1. Since D>E=H, hence D>H.
2. G>E or G=E, and D>E, we can say that D>G.
For the following questions answer them individually
The number 123456789 and 999999999 are multiplied. How many of the digits in the product are 9's
Solution
To find : $$123456789\times999999999$$
= $$123456789\times(1000000000-1)$$
= $$123456789000000000-123456789$$
= $$12345678876543211$$
Thus, there are 0 9's
=> Ans - (A)
If the expression $$15^{6} \times 28^5 \times 55^7$$ is evaluated, the number of zeros at the end of the number is
Solution
Expression : $$15^{6} \times 28^5 \times 55^7$$
Number of 2's in the expression (in $$28^5$$) = $$(2)^{10}=10$$
Number of 5's = $$(5)^6\times(5)^7=13$$
$$\because$$ number of 2's are less than number of 5's, thus number of zeroes will depend on two, hence number of zeroes are 10
=> Ans - (B)
$$\sqrt[4]{2001 2001 2001 2001}$$ is closest to
Solution
Since options are not so close, we can think of the 4th root of $$2\times\ 10^{15}$$
This is nothing but 4th root of 2000 * $$10^{12}$$
=> 1000 * 4th root of 2000 [between 6 and 7] => Answer lies between 6000 and 7000 => Option-C
The units digit of $$(2002)^{2002}$$ is
Solution
Expression : $$(2002)^{2002}$$
It can be written as : $$(2002)^{4n+2}$$
Thus, the unit's digit will be same as $$(2)^2=4$$
=> Ans - (B)
Three different numbers are chosen such that when each of the numbers is added to the average of the remaining two, the number 65, 69 and 76 are obtained. The average of the three original numbers is
Solution
Let the three original numbers be $$x,y,z$$
According to ques, => $$x+(\frac{y+z}{2})=65$$
Similarly, $$y+(\frac{x+z}{2})=69$$
and $$z+(\frac{y+x}{2})=76$$
Adding all the equations, => $$(x+y+z)+(x+y+z)=65+69+76$$
=> $$x+y+z=\frac{210}{2}=105$$
Dividing both sides by 3, => $$\frac{x+y+z}{3}=\frac{105}{3}=35$$
$$\therefore$$ Required average = 35
=> Ans - (A)
abc and def are 3-digit numbers such that

and none of a, b, c, d, e, or f is 0. What is the sum a + b + c + d + e + f ?
Solution
Here, $$c+f=10$$ and $$b+e=9$$ and $$a+d=9$$ [because of carry over 1]
Adding all the equations, => $$a+b+c+d+e+f=10+9+9=28$$
=> Ans - (D)
When a number is divided by 5, the remainder is 2, when divided by 7, the remainder is 3, when divided by 9, the remainder is 4. The sum of digits of such smallest number is
Solution
We are given that when a number is divided by 5, the remainder is 2, when divided by 7, the remainder is 3, and when divided by 9, the remainder is 4.
Let the number be $$n$$
So, as per the question:
$$n=5a+2$$
$$n=7b+3$$
$$n=9c+4$$
Where $$a,b$$ and $$c$$ are whole numbers.
Now, we have
$$n=5a+2=7b+3$$
$$5a=7b+1$$
This linear equation has a solution when $$a=3 \text{ and } b=2$$
So the next solutions will appear when we increment $$a$$ and $$b$$ by $$7$$ and $$5$$, respectively.
Therefore, the general expression of $$a=3+(i-1)7$$
Let's substitute the value $$a$$ and find the number $$n$$.
$$n= 5a+2 = 5[3+(i-1)7]+2=35i-18$$
$$ $$
Similarly, we have
$$n=5a+2=9c+4$$
$$5a=9c+2$$
This linear equation has a solution when $$a=4 \text{ and } c=2$$
So the next solutions will appear when we increment $$a$$ and $$c$$ by $$9$$ and $$5$$, respectively.
Therefore, the general expression of $$a=4+(k-1)9$$
Let's substitute the value $$a$$ and find the number $$n$$.
$$n= 5a+2 = 5[4+(k-1)9]+2=45k-23$$
$$ $$
So we have: $$n=35i-18=45k-23$$
$$35i=45k-5$$
$$7i=9k-1$$
This linear equation has a smallest solution when $$i=5 \text{ and } k=4$$
Therefore,
$$n=35i-18=35*5-18$$
$$n=175-18=157$$
Hence, the sum of the digits of the smallest number that follows all the given conditions is$$=1+5+7=13$$
Hence, Option A is correct.
The expression
$$\frac{1}{8} + \frac{1}{10} + \frac{1}{11} + \frac{1}{15} + \frac{1}{20} + \frac{1}{41} + \frac{1}{110} + \frac{1}{1640}$$ is equal to
Solution
Expression : $$\frac{1}{8} + \frac{1}{10} + \frac{1}{11} + \frac{1}{15} + \frac{1}{20} + \frac{1}{41} + \frac{1}{110} + \frac{1}{1640}$$
= $$(\frac{1}{41} + \frac{1}{1640}) + (\frac{1}{10} + \frac{1}{20}) + (\frac{1}{11} + \frac{1}{110}) + (\frac{1}{8} + \frac{1}{15})$$
= $$(\frac{40+1}{1640})+(\frac{2+1}{20})+(\frac{10+1}{110})+(\frac{15+8}{120})$$
= $$\frac{1}{40}+\frac{3}{20}+\frac{1}{10}+\frac{23}{120}$$
= $$\frac{3+18+12+23}{120}=\frac{56}{120}=\frac{7}{15}$$
=> Ans - (D)
Let r be the least non-negative remainder when $$(22)^7$$ is divided by 123. The value of r is
Solution
When $$(22)^7$$ is divided by 123
= $$\frac{(22)^2\times(22)^2\times(22)^2\times22}{123}$$
Now, when we divide $$(22)^2=484$$ by 123, remainder is $$-8$$
= $$\frac{-8\times-8\times-8\times22}{123}$$
= $$\frac{-20\times22}{123}$$
=> Remainder = -(-52) = 52
=> Ans - (D)
if $$\frac{97}{19} = w + \frac{1}{x + \frac{1}{y}}$$ where x, y and w are all positive integers, the value of $$x + 2y - 3w$$ is
Solution
Expression : $$\frac{97}{19} = w + \frac{1}{x + \frac{1}{y}}$$
Breaking the L.H.S. expression = $$5+\frac{2}{19}$$
= $$5+\frac{1}{\frac{19}{2}}$$
= $$5+\frac{1}{9+\frac{1}{2}}$$
Comparing above equation with : $$w+\frac{1}{x+\frac{1}{y}}$$
=> $$w=5, x=9,y=2$$
To find : $$x + 2y - 3w$$
= $$9+2(2)-3(5)=9+4-15=-2$$
=> Ans - (B)
Let $$a = 2^{129} \times 3^{81} \times 5^{128}, b = 2^{127} \times 3^{81} \times 5^{128}, c = 2^{126} \times 3^{82} \times 5^{128}$$, and $$d = 2^{125} \times 3^{82} \times 5^{129}$$. Then
Solution
$$a = 2^{129} \times 3^{81} \times 5^{128}$$
$$b = 2^{127} \times 3^{81} \times 5^{128}$$
$$c = 2^{126} \times 3^{82} \times 5^{128}$$
$$d = 2^{125} \times 3^{82} \times 5^{129}$$
Eliminating common factors $$(2)^{125}\times(3)^{81}\times(5)^{128}$$
=> $$a=16,b=4,c=6,d=15$$
$$\therefore$$ $$b<c<d<a$$
=> Ans - (B)
The positive integer a is a 2-digit number (01, 02 are not 2-digit number) the positive integer b has ‘a’ digit and the positive integer ‘c’ has ‘b’ digits. The smallest possible value for c is
Solution
Smallest number having $$n$$ digits is $$(10)^{n-1}$$
Smallest possible value of $$a=10$$
Now, $$b$$ has 10 digits, thus smallest possible value of $$b=(10)^9$$
Now, $$c$$ has $$(10)^9$$ digits, thus smallest possible value of $$c=(10)^{10^9-1}$$
=> Ans - (D)
If $$2^{36} - 1 = 68 a$$ 19476735, when all the digits are correct except a, the correct value of a is
Solution
Expression : $$(2)^{36}-1$$
= $$(2^3)^{12}-1=(8)^{12}-1$$
Now, to check whether the number is divisible by 9, we have : $$(-1)^{12}-1=0$$
Thus, $$(2)^{36}-1$$ is divisible by 9, hence sum of its digits is also divisible by 9.
=> $$6+8+a+1+9+4+7+6+7+3+5=56+a$$
Thus, $$56+a=63$$
=> $$a=7$$
=> Ans - (C)
The value of
$$\frac{(1.121)^3 - (3.333)^3 + (2.212)^3}{(1.121)(3.333)(2.212)}$$ is
Solution
Expression : $$E=\frac{(1.121)^3 - (3.333)^3 + (2.212)^3}{(1.121)(3.333)(2.212)}$$
Let $$x=1.121,y=2.212,z=-3.333$$ and hence $$x+y+z=0$$ ------------(i)
=> $$E=-\frac{(x)^3+(y)^3+(-z)^3}{xy(-z)}$$ -----------(ii)
We know that, $$x^3+y^3+z^3-3xyz=(x+y+z)(x^2+y^2+z^2-xy-yz-zx)$$
=> $$x^3+y^3+z^3=3xyz$$ -------(iii) [$$\because x+y+z=0$$]
Thus, substituting value from equation (iii) in equation (ii), we get : $$E=-3$$
=> Ans - (C)
If $$a : b = 3 : 4, b : c = \frac{8}{9}$$ and $$c : d = \frac{2}{3}$$, then the value of $$\sqrt[4]{\frac{ad}{b^2}}$$ is
Solution
Given = $$a : b = 3 : 4, b : c = \frac{8}{9}$$ and $$c : d = \frac{2}{3}$$
Multiplying equation (iii) by 9 and equation (ii) by 2, and (i) by 4
=> $$a:b:c:d=12:16:18:27$$
To find = $$\sqrt[4]{\frac{ad}{b^2}}$$
= $$\sqrt[4]{\frac{12\times27}{16\times16}}$$
= $$\sqrt[4]{\frac{81}{64}}$$
= $$\frac{3}{2\sqrt2}=\frac{3\sqrt2}{4}$$
=> Ans - (D)
The value of $$\frac{\sqrt{43 - 12\sqrt{7}} - 2}{16 + 6\sqrt7}$$ is
Solution
Expression : $$\frac{\sqrt{43 - 12\sqrt{7}} - 2}{16 + 6\sqrt7}$$
= $$\frac{\sqrt{(\sqrt7)^2+(6)^2 - 2(\sqrt{7})(6)} - 2}{(\sqrt7)^2+(3)^2 + 2(\sqrt7)(3)}$$
= $$\frac{\sqrt{(6-\sqrt7)^2}-2}{(3+\sqrt7)^2}$$
= $$\frac{4-\sqrt7}{(3+\sqrt7)^2}$$
Let N be the greatest natural number that will divide 13511, 13903 and 14589 leaving same remainder in each case. The sum of digits of N is
Solution
$$N$$ divides each of 13511, 13903, 14589 leaving remainder $$r$$ in each case.
=> $$13511=aN+r$$ -----------(i)
$$13903=bN+r$$ --------------(ii)
$$14589=cN+r$$ --------------(iii)
Subtracting above equations, we get : $$392=(b-a)N$$
$$686=(c-b)N$$
$$1078=(c-a)N$$
Thus, $$N$$ must be a factor of all three of these numbers. Thus, $$N=$$ H.C.F. (392,686,1078) = 98
$$\therefore$$ sum of digits of $$N$$ = $$9+8=17$$
=> Ans - (D)
The value of
$$\frac{(0.251)^2 - (0.051)^2 - (0.511)^2 - 2(0.051)(0.511)}{(0.251)^2 - (0.051)^2 - 2(0.251)(0.051) - (0.511)^2}$$ is
Solution
Expression : $$\frac{(0.251)^2 - (0.051)^2 - (0.511)^2 - 2(0.051)(0.511)}{(0.251)^2 - (0.051)^2 - 2(0.251)(0.051) - (0.511)^2}$$
Let $$x=0.251,y=0.051,z=0.511$$
= $$\frac{x^2-(y^2+z^2+2yz)}{(x^2-y^2-2xy)-z^2}$$
= $$\frac{x^2-(y+z)^2}{(x-y)^2-z^2}$$
= $$\frac{(x+y+z)(x-y-z)}{(x-y-z)(x-y+z)}$$
= $$\frac{x+y+z}{x-y+z}$$
= $$\frac{0.251+0.051+0.511}{0.251-0.051+0.511}=\frac{0.813}{0.711}=\frac{271}{237}$$
=> Ans - (A)
The cost of making a rectangular table is calculated by adding two variables. The first is proportional to the area of the table and the other to the square of the length of the longer side. In making 2 m x 3 m table it costs ₹ 5,000 and in making a 1.5 m x 4 m table, it cost ₹ 6,400. The cost of making a 2.5 m x 2.5 m table is (nearest to a rupee)
Solution
Let cost of making a table = $$C=X+Y$$ -----------(i)
Now, $$X=k_1A$$, where $$A$$ is area of table
and $$Y=k_2l^2$$, where $$l$$ is length of longer side of table
In making 2 m x 3 m table it costs ₹ 5,000
=> $$C=(6k_1)+(9k_2)=5000$$ ------------(ii)
Similarly, $$6k_1+16k_2=6400$$ -------------(iii)
Subtracting equation (ii) from equation (iii), we get :=> $$7k_2=1400$$
=> $$k_2=\frac{1400}{7}=200$$
Similarly, $$k_1=\frac{3200}{6}$$
Now, for a table having dimension 2.5 m x 2.5 m
=> Cost = $$(6.25\times\frac{3200}{6})+(6.25\times200)$$
= $$6.25\times(\frac{3200}{6}+200)$$
= $$6.25\times\frac{4400}{6}\approx Rs.$$ $$4,583$$
=> Ans - (B)
Anu is walking at a constant speed halfway between two paralled train tracks. On each track is a train of the same length. They are approaching Anu from different directions both at the same speed v km/hour. The train going in the same direction as Anu going takes $$t_1$$, second to pass her, while the other takes $$t_2$$, seconds to pass her. Speed of Anu (in km/hour) is
Solution
Let Anu's speed = $$s$$ km/hr
Let length of each train = $$l$$ km and speed of each train = $$v$$ km/hr
Relative speed of train going in same direction = $$(v-s)$$ km/hr
=> Time taken = $$t_1=\frac{l}{v-s}$$ --------------(i)
Similarly, $$t_2=\frac{l}{v+s}$$ ------------(ii)
Comparing equations (i) and (ii),
=> $$t_1(v-s)=t_2(v+s)$$
=> $$vt_1-st_1=vt_2+st_2$$
=> $$s(t_2+t_1)=v(t_1-t_2)$$
=> $$s=\frac{v(t_1-t_2)}{(t_2+t_1)}$$
=> Ans - (A)
A multiple choice examination consists of 20 questions. The scoring is +5 for each correct answer, —2 for each incorrect answer, and 0 for each unanswered question. A student's score on the examination is 48. The maximum number of questions he could have answered correctly is
Solution
Let questions answered correctly = $$x$$ and unanswered questions = $$y$$, => incorrect questions = $$(20-x-y)$$
According to ques,
=> $$5x-2(20-x-y)=48$$
=> $$7x+2y=88$$
Since, sum of 2 positive numbers is positive, and 84 is the nearest multiple of 7 (when $$y=2$$)
=> $$7x=84$$ => $$x=12$$
Thus, maximum number of questions answered correctly = 12
=> Ans - (B)
At an institute, 99% of the 100 students are girls but only 98% of the students living on the compus are girls. If same girls live on campus, how many students live off compus ?
Solution
Total students = 100 and Number of girls = 99, Number of boys = 1
Let number of students living off campus = $$x$$, and number of students living on campus = $$(100-x)$$
2% of boys live on campus (since there is only 1 boy)
=> $$\frac{2}{100}\times(100-x)=1$$
=> $$100-x=50$$
=> $$x=50$$
=> Ans - (C)
A and B share a piece of land. The ratio of the area of A's portion to the area of B's portion is 2 : 3. They each grow wheat and barley on their pieces of land. The entire land is covered by wheat and barley in the ratio 7 : 3. On A's land, the ratio of wheat do barley is 4: 1. The raito of wheat to barley for B's land is
Solution
Let total area of land = $$100$$ sq. units
=> Total area of A's land = $$40$$ sq. units and B's land = $$60$$ sq. units
Also, Total wheat in the land = $$\frac{7}{10}\times100=70$$ sq. units and similarly, total barley = $$30$$ sq. units
A' land : Wheat = $$\frac{4}{5}\times40=32$$ sq. units
Barley = $$40-32=8$$ sq. units
=> Remaining wheat = $$70-32=38$$ sq. units and remaining barley = $$30-8=22$$ sq. units
$$\therefore$$ Ratio of wheat to Barley for B's land = $$\frac{38}{22}=19:11$$
=> Ans - (B)
A box has apples and oranges. $$\frac{2}{3}$$ of all the apples and $$\frac{3}{4}$$ of all the oranges are rotten The number of rotton apples equals the number of rotton oranges. What fraction of the total number of fruits in the box is rotton ?
Solution
Let number of apples = $$3x$$ and number of oranges = $$4y$$
=> Number of rotten apples = Number of rotten oranges
=> $$2x=3y$$
=> $$\frac{x}{y}=\frac{3}{2}$$
Let $$x=3$$ and $$y=2$$
=> Fraction of rotten fruits = $$\frac{2x+3y}{3x+4y}$$
= $$\frac{2(3)+3(2)}{3(3)+4(2)}$$
= $$\frac{12}{17}$$
=> Ans - (A)
A TV set is available for ₹ 19,650 cash payment or for ₹ 3,100 cash down payment and three equal annual instalments. If the interest is charged at the rate of 10% per annum compounded annually, the amount of each instalment is
Solution
Principal amount for EMIs = Rs. (19,650 - 3,100) = Rs. 16,550
Rate of interest = 10% and number of EMIs = 3
Amount when compounded annually = $$P(1+\frac{r}{100})^T$$
Let each installment = Rs. $$x$$
=> $$\frac{x}{(1+\frac{10}{100})^1}+\frac{x}{(1+\frac{10}{100})^2}+\frac{x}{(1+\frac{10}{100})^3}=16550$$
=> $$x[(\frac{10}{11})+(\frac{100}{121})+(\frac{1000}{1331})]=16550$$
=> $$x[\frac{1210+1100+1000}{1331}]=16550$$
=> $$x=16550\times\frac{1331}{3310}$$
=> $$x=Rs.$$ $$6,655$$
=> Ans - (C)
A person bought n articles for ₹ d. He sold two articles at half their cost and the rest at a profit of ₹ 8 on each article. If the overall profit is ₹ 72, there the least possible value of n is
Solution
The person bought the n article, each at Rs. d.
In that, he sold two articles at Rs. $$\ \frac{\ d}{2}$$, which brings in Rs. d for him.
Now, he sold the remaining n-2 articles at Rs. (d+8), which brings in Rs. (n-2)(d+8)
His total profit is Rs.72. This means, (n-2)(d+8)+d-nd = 72, or nd+8n-2d-16-nd = 72.
Hence 8n - 2d = 88, or 4n - d = 44
Now, d has to be greater than zero. Hence, the minimum value of n shall be 12 to make d as 4.
A 3 cm x 3 cm x 3 cm cube has three holes each of 1 cm x 1 cm cross-section running from the centre of each face to the centre of the opposite face. The total surface area (in cm$$^2$$) of the solid so obtained is
.png)
Solution
Dimensions of cube = 3 cm x 3 cm x 3 cm and dimensions of square hole = 1 cm x 1 cm
Outer surface area of 1 face = $$(3\times3)-(1\times1)=8$$ $$cm^2$$
=> Outer surface area of the cube (6 faces) = $$6\times8=48$$ $$cm^2$$
Inner surface area of three tunnels = $$3\times2[(2\times1)+(2\times1)]=24$$ $$cm^2$$
$$\therefore$$ Total surface area of solid = $$48+24=72$$ $$cm^2$$
=> Ans - (C)
If a 6 cm X 6 cm square is placed on a triangle, it can cover up to 60% of the triangle. If the triangle is placed on the square it can cover up to $$\frac{2}{3}$$ of the square. The area (in cm$$^2$$) of the triangle is
Solution
The square will cover the same area of the triangle as much as covered by the triangle on square, and that at this point the amount of triangle covered is the same as the amount of square covered.
Let area of triangle be $$A$$ and area of square = $$6\times6=36$$ $$cm^2$$
According to ques,
=> $$\frac{60}{100} A=\frac{2}{3}\times36$$
=> $$A=\frac{24}{0.6}=40$$ $$cm^2$$
=> Ans - (C)
A circular grass plot 4 m in diameter is cut by a straight path | m wide, one edge of which passes through the centre of the plot. Area of the remaining portion is
Solution

Radius of circle = OC = OB = 2 m and OA = 1 m
Area of path = $$2\times$$[Area of $$\triangle$$ OAB+Area of sector BOC] ----------(i)
In right $$\triangle$$ AOB,
=> $$(AB)^2=(OB)^2-(OA)^2$$
=> $$(AB)^2=4-1=3$$
=> $$(AB)=\sqrt3$$ m ------------(ii)
Also, $$tan(\angle AOB)=\frac{AB}{OA}=\sqrt3$$
=> $$\angle OAB=60^\circ$$
Thus, $$\angle BOC=90^\circ-60^\circ=30^\circ$$ --------------(iii)
Now, in equation (i), area of path = $$2\times[(\frac{1}{2}\times OA \times AB)+(\frac{30^\circ}{360^\circ}\pi r^2)]$$
= $$2\times[(\frac{1}{2}\times1\times\sqrt3)+(\frac{1}{12}\times \pi (2)^2)]$$
= $$2\times[\frac{\sqrt3}{2}+\frac{\pi}{3}]$$
= $$\sqrt3+\frac{2\pi}{3}$$ -----------(iv)
$$\therefore$$ Area of plot = Area of shaded region = Area of circle - Area of path
= $$\pi(2)^2-(\sqrt3+\frac{2\pi}{3})$$
= $$4\pi-\sqrt3-\frac{2\pi}{3}$$
= $$\frac{10\pi}{3}-\sqrt3$$ $$m^2$$
=> Ans - (D)
Three concentric circles have radii (in cm) a, b and c, where a < b < c. If a = 8 and b = 9 and the middle circle bisects the area between the other two circles, then the value of c is
Solution

It is given that $$a=8$$ cm and $$b=9$$ cm. Also, $$A_2=\frac{A_1+A_3}{2}$$ ------------(i)
To find : $$c=?$$
Solution : Area of a circle = $$\pi r^2$$
Using equation (i),
=> $$\pi (b)^2=\frac{\pi (a)^2+\pi(c)^2}{2}$$
=> $$a^2+c^2=2b^2$$
=> $$64+c^2=162$$
=> $$c^2=162-64=98$$
=> $$c=\sqrt{98}=7\sqrt2$$ cm
=> Ans - (A)
A sphere has a diameter of $$500\sqrt{3}$$ cm. A biggest cube is fitted in it. Now a biggest sphere is fitted within this cube. Again a biggest cube is fitted in the smaller sphere. The ratio of the volume of bigger cube to the volume of smaller cube is
Solution
Let us say that the biggest sphere (S1) has a diameter of $$500\sqrt{3}$$, which will be the diagonal of the cube (C1) fitted inside it. Hence, the side of the cube is of 500 cm.
Now, the side of C1 (500 cm) will be the diameter of another sphere (S2) fitted in it.
In S2, a cube (C2) is fitted which shall have a diagonal equal to the diameter of S2.
This means, the side of C2 is $$\ \frac{\ 500}{\sqrt{\ 3}}$$ cm. (as $$a\sqrt{3}$$ = diameter).
Now, the ratio of volume of C1 to volume of C2 will be $$\ \frac{\ \left(500\sqrt{\ 3}\right)^3}{\ \ \ \left(\frac{\ 500}{\sqrt{\ 3}}\right)^3}$$, which is $$3\sqrt{\ 3}:\ 1$$
A rectangular box has dimensions x, y and z units, where x < y < z. If one dimension only is increased by one unit, then the increase in volume is
Solution
Let the dimensions of rectangular box be $$3,4,5$$ units
=> Volume = $$V=3\times4\times5=60$$ cu units
Case 1 : New length = $$4$$ units and breadth and height remains same
=> $$V'=4\times4\times5=80$$ cu units
Case 2 : New breadth = $$5$$ units and length and height remains same
=> $$V'=3\times5\times5=75$$ cu units
Case 3 : New height = $$6$$ units length and breadth remains same
=> $$V'=3\times4\times6=72$$ cu units
Clearly, increase in volume is greatest when $$x$$ is increased.
=> Ans - (A)
Read the following table and answer questions.

Which school has the lowest percentage of students scoring less than 60% marks ?
Solution
The number of students scoring more than 60% marks in school A = $$\frac{55}{100}\times800=440$$
Thus, students scoring exactly 60% marks in school A = $$800-440-320=40$$
Similarly, for other schools :

Clearly, each school but A, has more than half the students scoring less than 60% marks. Thus, school A has the required lowest percentage (400%)
=> Ans - (A)
Number of schools which have the same percentage of students scoring exactly 60% is
Solution
The number of students scoring more than 60% marks in school A = $$\frac{55}{100}\times800=440$$
Thus, students scoring exactly 60% marks in school A = $$800-440-320=40$$
Similarly, for other schools :
Now, in schools A, B and E, there are 5% of students scoring exactly 60% marks.
=> Ans - (C)
Total number of students scoring 60% or more marksis
Solution
The number of students scoring more than 60% marks in school A = $$\frac{55}{100}\times800=440$$
Thus, students scoring exactly 60% marks in school A = $$800-440-320=40$$
Similarly, for other schools :
Total number of students scoring 60% or more marks is = (40+20+35+15) + (440+160+75+35+75)
= 110 + 785 = 895
=> Ans - (D)
The ratio of the total number of students scoring less than 60% marks to that of scoring exactly 60% marks is
Solution
The number of students scoring more than 60% marks in school A = $$\frac{55}{100}\times800=440$$
Thus, students scoring exactly 60% marks in school A = $$800-440-320=40$$
Similarly, for other schools :
Total number of students scoring less than 60% marks = 320+220+300+280+210 = 1330
Total number of students scoring exactly 60% marks = 40+20+35+15 = 110
$$\therefore$$ Required ratio = $$\frac{1330}{110}=133:11$$
=> Ans - (B)

The above graph shows income and expenditure ( ₹ in crores) of a company in the years 2006 to 2011. Read the graph and answer the questions
The total expenditure of which of the following pairs of years was equal to the income in 2011 ?
Solution
Income in 2011 = 425 and expenditure of :
(A) : 2006 and 2007 = 275 + 225 = 500
(B) : 2007 and 2008 = 225 + 200 = 425
(C) : 2006 and 2008 = 275 + 200 = 475
(D) : 2007 and 2010 = 225 + 225 = 450
=> Ans - (B)
In how many of the given years was the income more than the average income of the given years ?
Solution
Total income in the given years = 325+300+250+300+275+425 = 1875
=> Average income = $$\frac{1875}{6}=312.5$$
$$\therefore$$ In two years, 2006 and 2011, income was more than average income.
=> Ans - (B)
What was the approximate percentage increase expenditure from 2010 to 2011 ?
Solution
Expenditure in 2010 = 225 and in 2011 = 325
=> Percentage increase = $$\frac{325-225}{225}\times100=44.4\%$$
=> Ans - (D)
In which year the percentage of expenditure to income, the highest?
Solution
Ratio of expenditure to income :
(A) : 2009 = $$\frac{300}{275}=1.09$$
(B) : 2008 = $$\frac{250}{200}=1.25$$
(C) : 2007 = $$\frac{300}{225}=1.33$$ (max)
(D) : 2006 = $$\frac{325}{275}=1.18$$
=> Ans - (C)
