MAH CET 9th Mar 2024 Slot 1
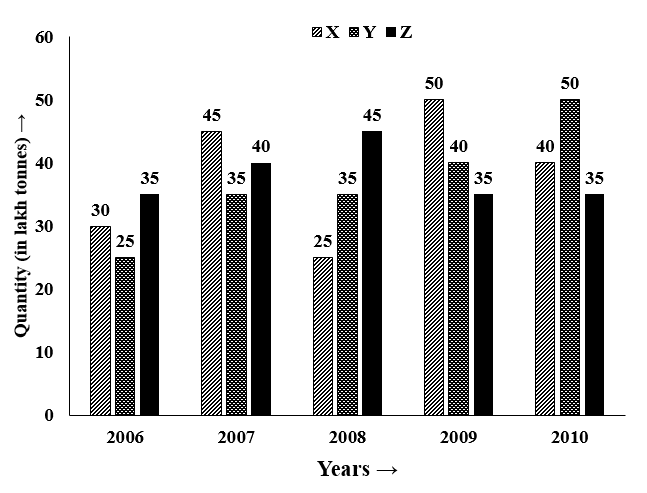
DIRECTIONS for the question:The bar graph given below gives the data of the production of paper (in lakh tonnes) by three different companies X, Y and Z over last 5 years. Study the graph carefully and answer the questions that follow.
Production of paper (in lakh tonnes) by companies X, Y and Z over the years.
MAH CET 9th Mar 2024 Slot 1 - Question 141
What is the percentage increase in the production of Company Y from 2006 to 2009?
MAH CET 9th Mar 2024 Slot 1 - Question 142
For which of the following years, the percentage rise or fall in production from the previous year is the maximum for Company Y?
MAH CET 9th Mar 2024 Slot 1 - Question 143
What is the ratio of the average production of Company X during the period 2008-201O to the average production of Company Y during the same period?
MAH CET 9th Mar 2024 Slot 1 - Question 144
What is the difference between the production of Company Z in 2008 and Company Y in 2006?
MAH CET 9th Mar 2024 Slot 1 - Question 145
The average production for 5 years was maximum for which company?
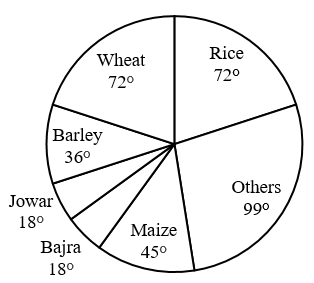
DIRECTIONS for the question: The pie chart shown below gives the distribution of land in a village under various food crops. Study the pie-chart carefully and answer the questions that follow:
Distribution of areas (in acres) under various food crops
MAH CET 9th Mar 2024 Slot 1 - Question 146
If the total area under jowar was 1.5 million acres, then what was the area (in million acres) under rice?
MAH CET 9th Mar 2024 Slot 1 - Question 147
If the total area goes up by 5%, and the area under wheat production goes up by 12%, then what will be the angle for wheat in the new pie-chart?
MAH CET 9th Mar 2024 Slot 1 - Question 148
If the production of wheat is 6 times that of barley, then what is the ratio between the yield per acre of wheat and barley?
MAH CET 9th Mar 2024 Slot 1 - Question 149
If the yield per acre of rice was 50% more than that of barley, then the production of barley is what percent of that of rice?
MAH CET 9th Mar 2024 Slot 1 - Question 150
Which combination of three crops contributes to 50% of the total area under the food crops?