CUET PG 13th March 2025 COPQ 12
The following pie-chart shows the amount collected by a shopkeeper by selling four different food items in degrees. The total amount collected is ₹64,800.
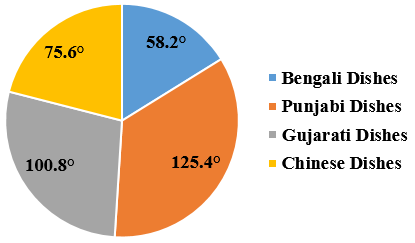
CUET PG 13th March 2025 COPQ 12 - Question 61
The amount collected by selling Chinese dishes is approximately what percentage more than the amount collected by selling Bengali dishes?
The following line graph shows the number of questions asked from different topics of quantitative aptitude in two shifts of CAT exam. Study the following line graph carefully and answer the question that follows.
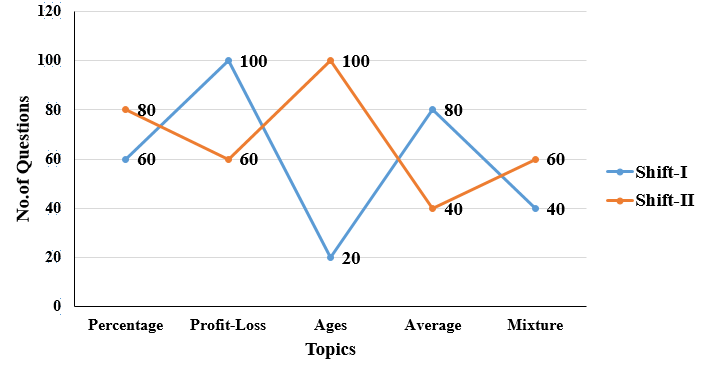
CUET PG 13th March 2025 COPQ 12 - Question 62
The number of questions asked in shift I from the topic Profit-Loss is what percent more than the number of questions asked in shift II from the topic Average?
CUET PG 13th March 2025 COPQ 12 - Question 63
What is the ratio of number of questions asked from the topics Profit-Loss and Percentage taken together in shift I to those asked from the topics Ages and Average taken together in shift II?
Study the following bar-graph carefully and answer the following question. The bar-graph shows the number of pens (in thousand) sold by three shopkeepers X, Y and Z in 5 different years.
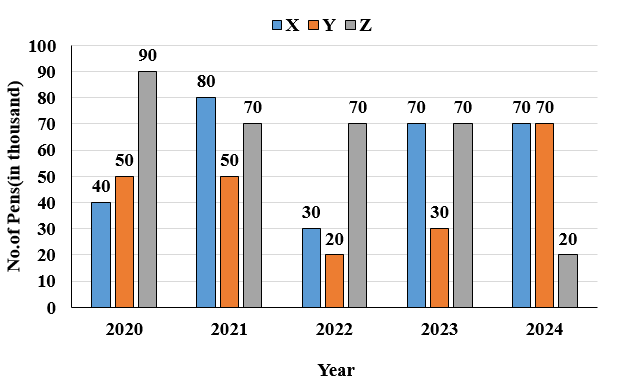
CUET PG 13th March 2025 COPQ 12 - Question 64
The total number of pens sold by shopkeeper X in years 2020 and 2022 taken together is what percentage less than the total number of pens sold by shopkeeper Z in years 2021 and 2024 taken together? (correct to two decimal places)
CUET PG 13th March 2025 COPQ 12 - Question 65
The number of pens sold by shopkeeper Y in the year 2020 is 25% more than the number of pens sold by him in the year 2019 and the number of pens sold by shopkeeper Z in the year 2019 is 20% less than those sold by him in the year 2020. Find the total number of pens sold by the shopkeepers Y and Z in the year 2019.
The following table shows the total number of people who were stuck in traffic jam while going to their office on working days of a week due to construction of a flyover. Table also shows the ratio of male to female among them. Study the table carefully and answer the following question.
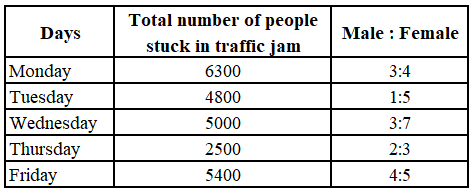
CUET PG 13th March 2025 COPQ 12 - Question 66
Of the people stuck in traffic jam, if 30% males on Tuesday and 40% males on Wednesday reached their office on regular time of the office, then how many males got late on Tuesday and Wednesday taken together?
CUET PG 13th March 2025 COPQ 12 - Question 67
Find the average number of females who were stuck in traffic on working days.
The following bar graph shows the production of Iron in a country (in lakh tonnes) in different years.
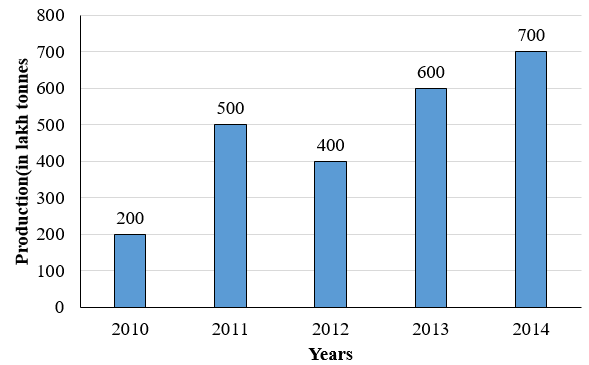
The pie chart shows the production of Iron (in lakh tonnes) by five different companies A, B, C, D and E in 2013. These companies are the only ones to produce iron in all the given years.
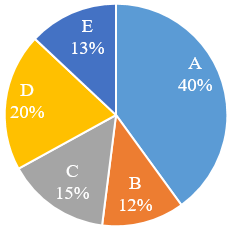
CUET PG 13th March 2025 COPQ 12 - Question 68
Company D produced 75% more iron in 2014 than produced by it in 2013. What percent of iron produced in 2014 was prod uced by company D?
CUET PG 13th March 2025 COPQ 12 - Question 69
The production of iron by company A in 2013 is what percent of the total iron produced by all the companies during the given years?
For the following questions answer them individually
CUET PG 13th March 2025 COPQ 12 - Question 70
In light of the statements I and II choose the most appropriate option.
If a group comprises of five persons A, B, C, D and E, then how many persons are taller than E?
Statement (I) A is taller than B and B is shorter than A and E only.
Statement (II) C is shorter than A and A is shorter than E.
