Instructions
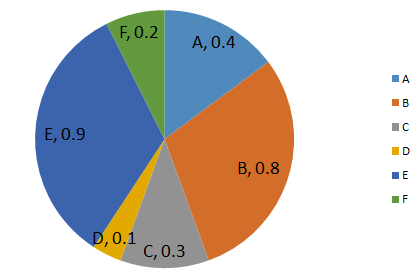
The pie chart shows the annual car production (in millions) of six countries (A, B, C. D, E, F). Study the diagram and answer the following questions.
Solution
Cars produced by country E (in millions) = 0.9
Cars produced by country B (in millions) = 0.8
=> Required % = $$\frac{0.9-0.8}{0.8} \times 100$$
= $$\frac{100}{8}=12.5\%$$
=> Ans - (B)
Get AI Help
Create a FREE account and get:
- Free SSC Study Material - 18000 Questions
- 230+ SSC previous papers with solutions PDF
- 100+ SSC Online Tests for Free


