Read the following information, graph and table and answer the questions that follow.
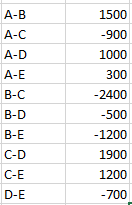
Ellen Inc. is a Mumbai based company which sells five products branded as A, B, C, D and E in India. Anita looks after entire sales of North India working from regional office in Delhi. She was preparing for annual review meeting scheduled next day in Mumbai. She was attempting to analyse sales in North India for the seven year period from 2009 to 2015. She first calculated average sales in rupees of all the five brands and constructed a table exhibiting the difference between average sales of each pair of brands as shown in the following table:

Average Sales of Product A minus Average Sales of Product B
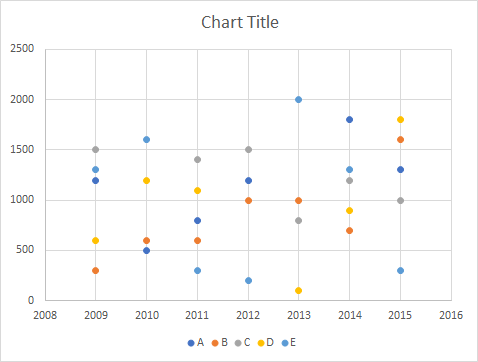
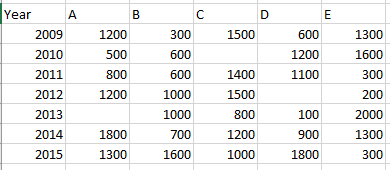
After taking a print out of the above table, she attempted to look at the trend of sales and plotted a graph in MS Excel. Later she took a print out of the graph and left for a meeting. While on her way she figured out that due to some printer cartridge problem sales of Product A in 2013, Product C in 2010, and Product D in 2012 were not visible in the graph as reproduced below. Anita had to make some quick calculations to arrive at the information outlined in the following question.
If Year on Year (YoY) Growth is
{Current Year Sales − Previous Year Sales }/ Previous Year Sales
then the YoY growth of combined sales of all products has suffered maximum decline in which year?
Solution
Let's tabulate the chart ,
Since difference in average sales is given , Difference in sales can be found by multiplying it by 7
Let the sales of A in 2013 be 'a', C in 2010 be 'c', D in 2012 be 'd' .
Total sales of A = (6800+a*1000
B = 5800
C = (7400+c)
D = (5700+d)
E = 7000
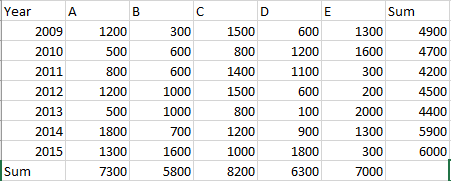
On evaluating we get value of a = 500,c=800,d= 600 crores
On finding the unknown values , we get the below table
Let's evaluate the options one by one,
Option A: YoY growth of combined sales of all products in 2010 = 4700-4900/4900 = -0.0408
Option B: YoY growth of combined sales of all products in 2011 = 4200-4700/4700 = -0.1064
Option C: YoY growth of combined sales of all products in 2013 = 4400-4500/4500 = -0.0222
Option D: YoY growth of combined sales of all products in 2015 = 6000-5900/5900 = 0.0169
Among the above values, it is clear that the YoY growth of combined sales of all products in 2011 had a maximum decline.
Hence B is the correct answer.
Get AI Help
Create a FREE account and get:
- All Quant Formulas and shortcuts PDF
- 170+ previous papers with solutions PDF
- Top 5000+ MBA exam Solved Questions for Free

IIFT Quant Questions | IIFT Quantitative Ability
IIFT DILR Questions | LRDI Questions For IIFT
IIFT Verbal Ability Questions | VARC Questions For IIFT
Free IIFT DILR Questions
Book Free CAT Mentorship
Get personalized CAT strategy from a 99%iler
500+ students mentored
OTP Verification
Enter the 6-digit code sent to your phone
Booking Summary
Enter OTP
Didn't receive the OTP?


