
Join Our JEE Preparation Group
Prep with like-minded aspirants; Get access to free daily tests and study material.
Sign in
Please select an account to continue using cracku.in
↓ →
Join Our JEE Preparation Group
Prep with like-minded aspirants; Get access to free daily tests and study material.
A thermodynamic cycle xyzx is shown on a V-T diagram.
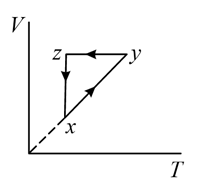
The P-V diagram that best describes this cycle is: (Diagrams are schematic and not to scale)
For process $$x \to y$$: $$V \propto T \implies P = \text{constant (Isobaric)}$$
$$\text{Volume increases, so it's a horizontal line pointing right.}$$
For process $$y \to z$$: $$V = \text{constant (Isochoric)}$$
$$\text{Temperature decreases } \implies P \text{ decreases, so it's a vertical line pointing down.}$$
For process $$z \to x$$: $$T = \text{constant (Isothermal)}$$
$$\text{Volume decreases } \implies P \propto \frac{1}{V} \text{ increases, so it's a hyperbolic curve rising up.}$$
Was this solution helpful?
Create a FREE account and get:
_1.webp)

Educational materials for JEE preparation

Ask our AI anything

AI can make mistakes. Please verify important information.
AI can make mistakes. Please verify important information.
