Sign in
Please select an account to continue using cracku.in
↓ →
Join Our JEE Preparation Group
Prep with like-minded aspirants; Get access to free daily tests and study material.
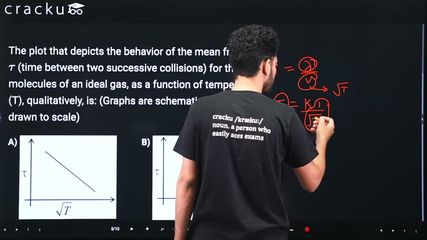
The plot that depicts the behavior of the mean free time $$\tau$$ (time between two successive collisions) for the molecules of an ideal gas, as a function of temperature (T), qualitatively, is: (Graphs are schematic and not drawn to scale)
Minimum Required Theory
$$\lambda = \frac{1}{\sqrt{2}\pi d^2 n}$$
$$v_{avg} = \sqrt{\frac{8RT}{\pi M}} \implies v_{avg} \propto \sqrt{T}$$
$$\tau = \frac{\lambda}{v_{avg}}$$
Step-by-Step Solution
Step 1: Express $$\tau$$ as a function of Temperature ($$T$$)
Since the mean free path $$\lambda$$ remains independent of temperature for a fixed sample of gas, substitute the temperature dependence of $$v_{avg}$$ into the mean free time equation:
$$\tau \propto \frac{1}{\sqrt{T}}$$
Step 2: Analyze the behavior of the curve
Step 3: Identify the shape of the graph
The relation $$\tau \propto \frac{1}{\sqrt{T}}$$ produces a smoothly decreasing, non-linear asymptotic curve.
Unlike a standard rectangular hyperbola ($$y \propto \frac{1}{x}$$), this curve drops steeply at first and gradually flattens out along the temperature axis (X-axis) as $$T$$ increases.
The Correct Graph
The correct schematic plot features:
Click on the Email ☝️ to Watch the Video Solution
Create a FREE account and get:


Educational materials for JEE preparation

Ask our AI anything

AI can make mistakes. Please verify important information.
AI can make mistakes. Please verify important information.
