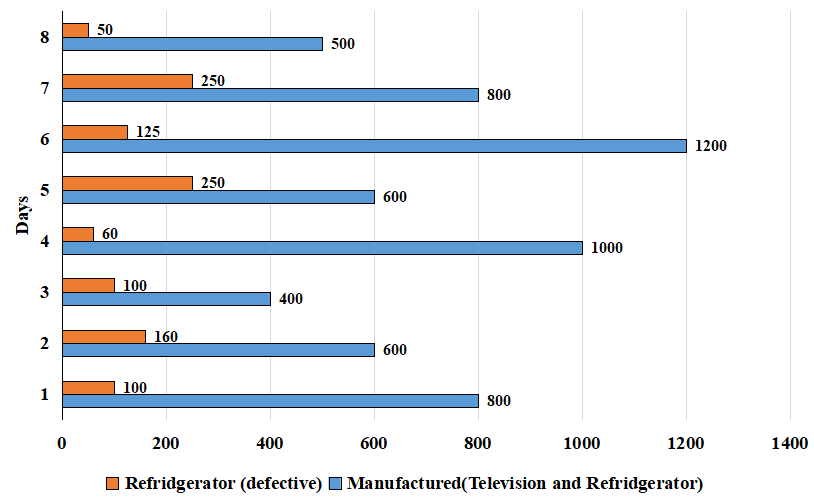
The following graph provides data about the refrigerators and television sets manufactured by XYZ company in 8 days - day1 to day8. However, on each day after quality check (QC) some products were found to be defective. The attached bar chart provides data about aggregate number of refrigerators and televisions manufactured by the company and the number of refrigerators found defective after QC on each day of the given eight days.
All the televisions and refrigerators which cleared the QC were packed for selling.
The bar chart given below provides information about the fraction of the number of televisions found defective to number of televisions which cleared the QC.

On how many of the given 8 days the number of refrigerators which cleared the quality check can be zero?
Solution
The second chart provides information about the fraction of defective televisions found to the number of televisions that cleared the QC. On day 1, this ratio is 3:4, i.e. let the number of televisions found detective be '3a'. The number of televisions which cleared the QC is 4a, and the total number of televisions is 7a. Similarly, calculating for all the days, we will get the below data.
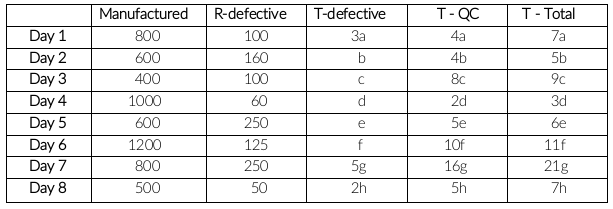
If the number of refrigerators which cleared the quality check is zero, then the total number of refrigerators is equal to the total number of defective refrigerators.
Televisions = Total manufactured - refrigerators
Day 1: 800 - 100 = 700 is multiple of 7a
Day 2: 600 - 160 = 440 is multiple of 5c
Similarly, calculating for the remaining days, you will get that it is only possible on day 1 and day 2.
The answer is option B.
Get AI Help
Create a FREE account and get:
- All Quant Formulas and shortcuts PDF
- 170+ previous papers with solutions PDF
- Top 5000+ MBA exam Solved Questions for Free

IIFT Quant Questions | IIFT Quantitative Ability
IIFT DILR Questions | LRDI Questions For IIFT
IIFT Verbal Ability Questions | VARC Questions For IIFT
Free IIFT Quant Questions
Book Free CAT Mentorship
Get personalized CAT strategy from a 99%iler
500+ students mentored
OTP Verification
Enter the 6-digit code sent to your phone
Booking Summary
Enter OTP
Didn't receive the OTP?


