Question 68
The given bar graph shows the biscuit exports of India over a period of five years. Study the graph and answer the
question that follow.
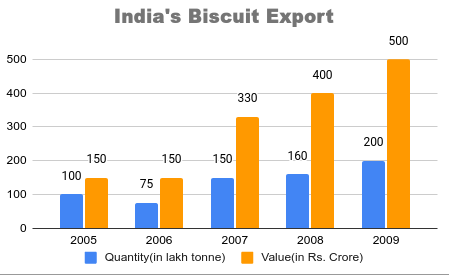
What was the percentage drop in the export quantity from 2005 to 2006?
Solution
From the bar graph,
Export quantity of India in 2005 = 100
Export quantity of India in 2006 = 75
$$\therefore\ $$Required percentage drop = $$\frac{100-75}{100}\times100=$$ 25%
Hence, the correct answer is Option D
Get AI Help
Create a FREE account and get:
- Free SSC Study Material - 18000 Questions
- 230+ SSC previous papers with solutions PDF
- 100+ SSC Online Tests for Free


