Sign in
Please select an account to continue using cracku.in
↓ →
A large store has only three departments, Clothing, Produce, and Electronics. The following figure shows the percentages of revenue and cost from the three departments for the years 2016, 2017 and 2018. The dotted lines depict percentage levels. So for example, in 2016, 50% of store's revenue came from its Electronics department while 40% of its costs were incurred in the Produce department
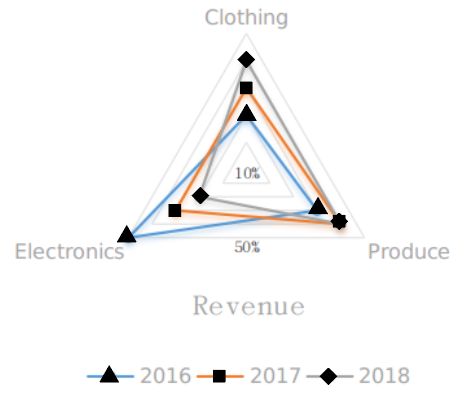
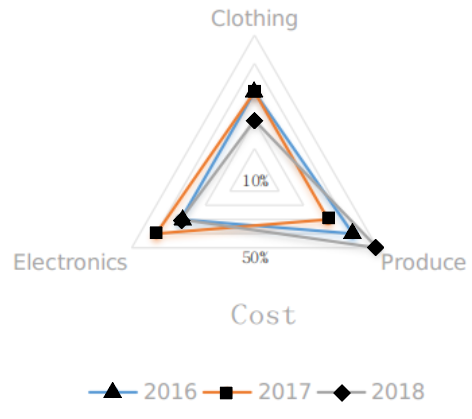
In this setup, Profit is computed as (Revenue - Cost) and Percentage Profit as Profit/Cost × 100%.
It is known that
1. The percentage profit for the store in 2016 was 100%.
2. The store’s revenue doubled from 2016 to 2017, and its cost doubled from 2016 to 2018.
3. There was no profit from the Electronics department in 2017.
4. In 2018, the revenue from the Clothing department was the same as the cost incurred in the Produce department.
What was the ratio of revenue generated from the Produce department in 2017 to that in 2018?

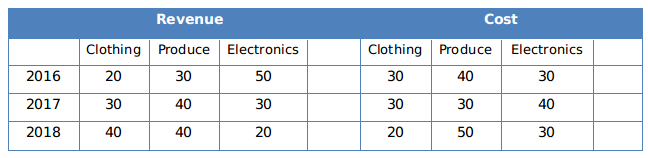
We can make the following table from the web chart given in the question:
If we consider the total cost in the year
2016 as 100, then according to Statement 1, the total revenue in 2016 must be 200.
The store’s revenue doubled from 2016 to 2017, thus the total revenue in the year 2017 = 400.
We can find the revenue for the individual department in the year 2017, from the table.
There was no profit from the Electronics department in 2017, thus, we can find the total cost in 2017= 300
Considering the statement 4, we can find the total revenue in 2018 and tabulate the following table.
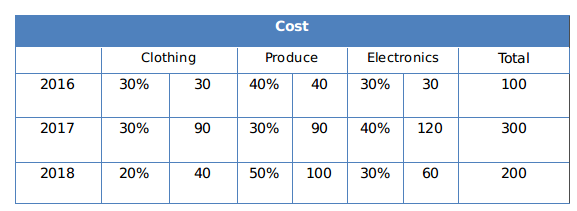
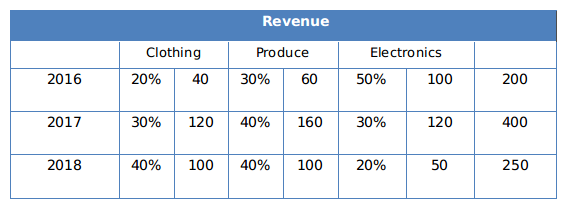
The ratio of revenue generated from the Produce department in 2017 to that in 2018 = 160:100= 8:5

Click on the Email ☝️ to Watch the Video Solution
Create a FREE account and get:
Book Free CAT Mentorship
Get personalized CAT strategy from a 99%iler
500+ students mentored
OTP Verification
Enter the 6-digit code sent to your phone
Booking Summary
Enter OTP
Didn't receive the OTP?

Educational materials for CAT preparation

Ask our AI anything

AI can make mistakes. Please verify important information.
AI can make mistakes. Please verify important information.


