Instructions
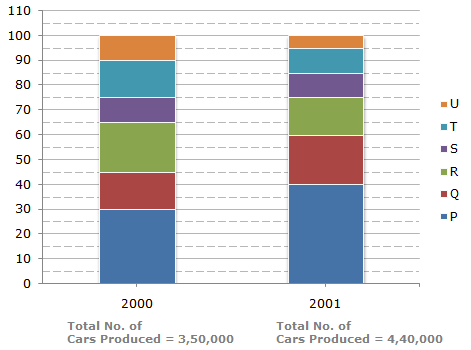
The bar graph given below shows the percentage distribution of the total production of a car manufacturing company into various models over two years.
Percentage of Six different types of Cars manufactured by a Company over Two Years
Question 6
In how many of the given years, was the production of Type P vehicles of the company more than the average production of this type vehicles in the given years?
Solution
average of Type p production = $$ \frac{total production}{no of years} $$ = $$ \frac{100+125+200+225+275+275}{6} $$ =$$ \frac{1200}{6} $$ = 200
years when production of type p is greater than average
2012 = 225
2013 = 275
2014 = 275
hence 3 years
Get AI Help
Create a FREE account and get:
- Free SSC Study Material - 18000 Questions
- 230+ SSC previous papers with solutions PDF
- 100+ SSC Online Tests for Free


