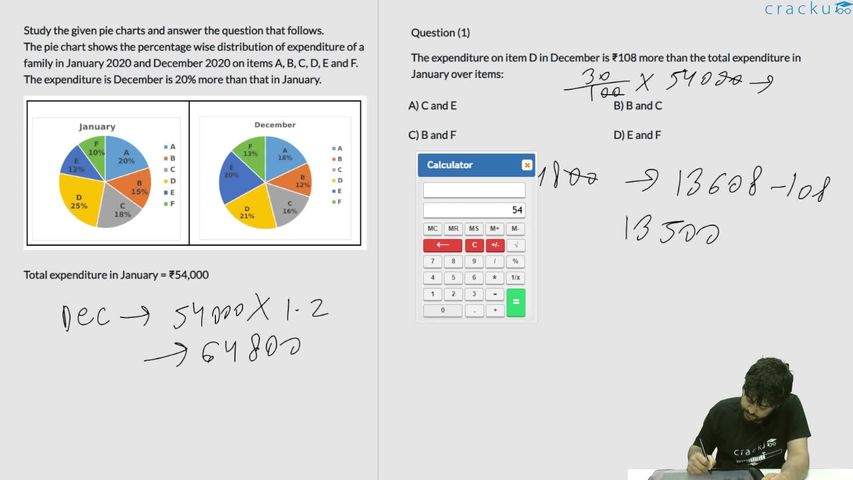
Study the given pie charts and answer the question that follows.
The pie chart shows the percentage wise distribution of expenditure of a family in January 2020 and December 2020 on items A, B, C, D, E and F.
The expenditure is December is 20% more than that in January.

Total expenditure in January = ₹54,000
On which item was there 4% decrease/increase in expenditure in December as
compared to that in January?
Solution
Total Expenditure for January = 54000.
December's expenditure is 20% more than January's i.e. 1.2*54000 = 64800.
Now, we calculate month wise distribution of expenditures on the given items.
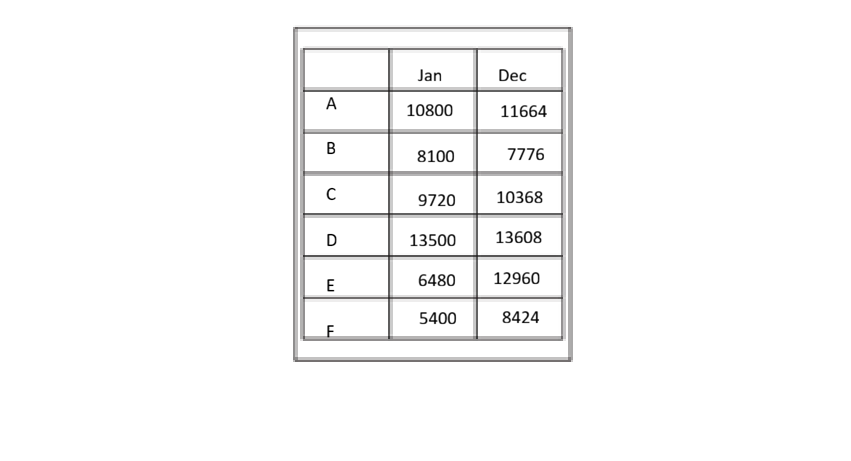
The item on which there is 4% decrease in December as compared to January is B.
Get AI Help
Video Solution
Click on the Email ☝️ to Watch the Video Solution

SRCC Quant Questions | SRCC Quantitative Ability
SRCC DILR Questions | LRDI Questions For SRCC
SRCC Verbal Ability Questions | VARC Questions For SRCC
Free SRCC DILR Questions
Book Free CAT Mentorship
Get personalized CAT strategy from a 99%iler
500+ students mentored
OTP Verification
Enter the 6-digit code sent to your phone
Booking Summary
Enter OTP
Didn't receive the OTP?


