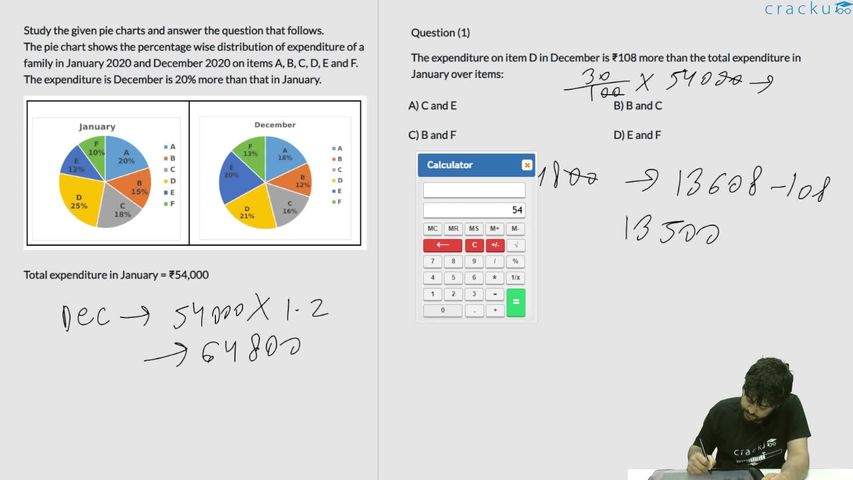
Study the given pie charts and answer the question that follows.
The pie chart shows the percentage wise distribution of expenditure of a family in January 2020 and December 2020 on items A, B, C, D, E and F.
The expenditure is December is 20% more than that in January.

Total expenditure in January = ₹54,000
In January, if the income of the family is 20% more than the total expenditure, and the income in December is 15% more than the total expenditure in the same month, then by what per cent are the savings in January more than that in December (nearest to an integer)?
Solution
It is given that total expenditure in January = ₹54,000
And, the expenditure is December is 20% more than that in January = 20% of 54000 + 54000 = ₹ 64800
Expenditure on items A,B,C,D,E and F in January
A = 20% of 54000 = 10800
B = 15% of 54000 = 8100
C = 18% of 54000 = 9720
D = 25% of 54000 = 13500
E = 12% of 54000 = 6480
F = 10% of 54000 = 5400
Similarly, Expenditure on items A,B,C,D,E and F In December.
A = 18% of 64800 = 11664
B = 12% of 64800 = 7776
C = 16% of 64800 = 10368
D = 21% of 64800 = 13608
E = 20% of 64800 = 12960
F = 13% of 64800 = 8424
It is given that in January the income of the family is 20% more than the total expenditure.
Thus, income in January = 1.2*54000 = 64800
Savings in January = 64800 - 54000 = 10800
It is also given that in December the income of the family is 15% more than the expenditure.
Thus, the income in December = 1.15*64800 = 74520
Savings in December = 74520 - 64800 = 9720
The savings in January are more than that in December by = 10800 - 9720 = 1080
=> [(1080)/9720]*100 = 11.11%
Approx 11% (Option B is the correct answer)
Get AI Help
Video Solution
Click on the Email ☝️ to Watch the Video Solution

SRCC Quant Questions | SRCC Quantitative Ability
SRCC DILR Questions | LRDI Questions For SRCC
SRCC Verbal Ability Questions | VARC Questions For SRCC
Free SRCC DILR Questions
Book Free CAT Mentorship
Get personalized CAT strategy from a 99%iler
500+ students mentored
OTP Verification
Enter the 6-digit code sent to your phone
Booking Summary
Enter OTP
Didn't receive the OTP?


