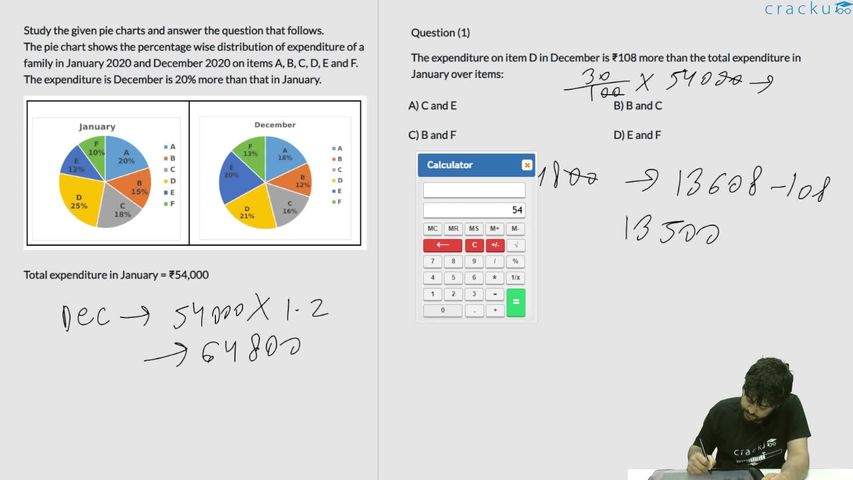
Study the given pie charts and answer the question that follows.
The pie chart shows the percentage wise distribution of expenditure of a family in January 2020 and December 2020 on items A, B, C, D, E and F.
The expenditure is December is 20% more than that in January.

Total expenditure in January = ₹54,000
The average expenditure on items A, C and D together in January is what per cent less than the expenditure on item E in December?
Solution
It is given that total expenditure in January = ₹54,000
And, the expenditure is December is 20% more than that in January = 20% of 54000 + 54000 = ₹ 64800
Expenditure on items A,B,C,D,E and F in January
A = 20% of 54000 = 10800
B = 15% of 54000 = 8100
C = 18% of 54000 = 9720
D = 25% of 54000 = 13500
E = 12% of 54000 = 6480
F = 10% of 54000 = 5400
Similarly, Expenditure on items A,B,C,D,E and F In December.
A = 18% of 64800 = 11664
B = 12% of 64800 = 7776
C = 16% of 64800 = 10368
D = 21% of 64800 = 13608
E = 20% of 64800 = 12960
F = 13% of 64800 = 8424
The average expenditure on items A, C and D together in January is what per cent less than the expenditure on item E in December?
The average expenditure on items A, C and D together in January is = (10800+9720+13500)/3 = 11340
Tthe expenditure on item E in December = 12960
It is less by [(12960- 11340)/12960]*100 = 12.5%
Option D is the correct answer.
Get AI Help
Video Solution
Click on the Email ☝️ to Watch the Video Solution

SRCC Quant Questions | SRCC Quantitative Ability
SRCC DILR Questions | LRDI Questions For SRCC
SRCC Verbal Ability Questions | VARC Questions For SRCC
Free SRCC DILR Questions
Book Free CAT Mentorship
Get personalized CAT strategy from a 99%iler
500+ students mentored
OTP Verification
Enter the 6-digit code sent to your phone
Booking Summary
Enter OTP
Didn't receive the OTP?


