Study the graph and answer the given questions:
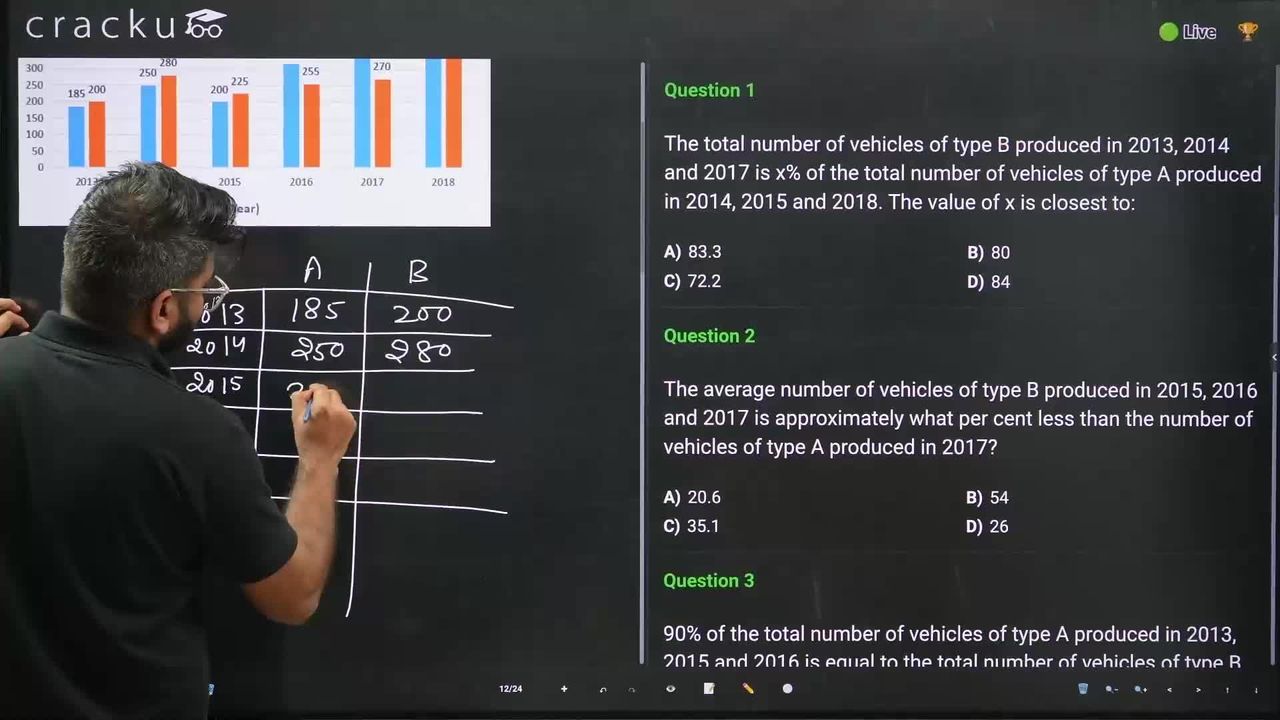
Production (in thousands) of two types of vehicles A and B, by a company during 2013 to 2018

In 2019, if the production of vehicles of type A increased by the same per cent as in 2016 over its previous year, then what was the number (in thousands) of vehicles of type A produced in 2019?
Solution
The number of cars produced by the company are as follows:
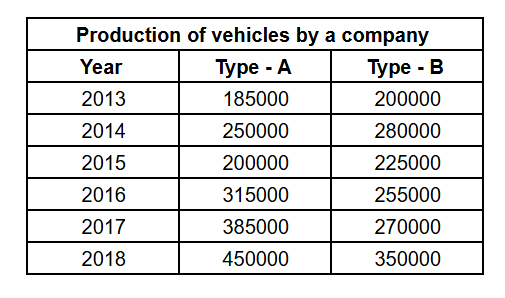
Number of Type A vehicles produced in 2015 = 200000
Number of Type A vehicles produced in 2016 = 315000
Percentage increase = $$\ \dfrac{\left(315000-200000\right)}{200000}\times100=\ \dfrac{115}{2}\%=57.5\%$$
Number of Type A vehicles produced in 2018 = 450000
Number of Type A vehicles produced in 2019 = $$450000\times\left(1+57.5\%\right)=450000\times1.575=708750$$
Total number of Type A vehicles produced in 2019 (in thousands) = 708.75
$$\therefore\ $$ The required answer is A.
Get AI Help
Video Solution
Click on the Email ☝️ to Watch the Video Solution

SRCC Quant Questions | SRCC Quantitative Ability
SRCC DILR Questions | LRDI Questions For SRCC
SRCC Verbal Ability Questions | VARC Questions For SRCC
Free SRCC DILR Questions
Book Free CAT Mentorship
Get personalized CAT strategy from a 99%iler
500+ students mentored
OTP Verification
Enter the 6-digit code sent to your phone
Booking Summary
Enter OTP
Didn't receive the OTP?


