Study the graph and answer the given questions:
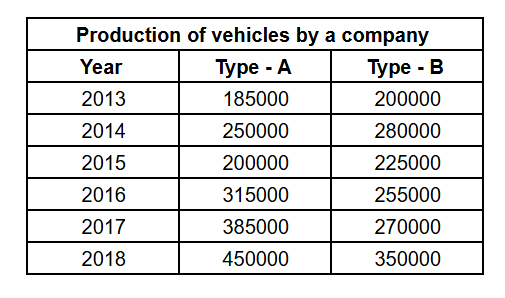
Production (in thousands) of two types of vehicles A and B, by a company during 2013 to 2018

The ratio of the total number of vehicles of type A produced in 2016 and 2017 to the total number of vehicles of type B produced in 2014 and 2018, is:
Solution
The number of cars produced by the company are as follows:

Total number of Type A vehicles produced in 2016 and 2017 = 315000 + 385000 = 700000
Total number of Type B vehicles produced in 2014 and 2018 = 280000 + 350000 = 630000
Required ratio = $$\ \dfrac{700000}{630000}=\ \dfrac{10}{9}$$
Hence, the total number of Type A vehicles produced in 2016 and 2017 is in the ratio of 10:9 with the total number of Type B vehicles produced in 2014 and 2018.
$$\therefore\ $$ The required answer is D.
Video Solution

Click on the Email ☝️ to Watch the Video Solution
