Sign in
Please select an account to continue using cracku.in
↓ →
Based on the following information.
The following graphs give annual data of Assets, Sales (as percentage of Assets) and Spending on Corporate Social Responsibility (CSR) (as percentage of Sales), of a company for the period 2004 - 2009.

Of the years indicated below, in which year was the ratio of CSR/ Assets the maximum?
Total value of assets in the year 2004 = 100 crore
Total value of sales in the year 2004 = 0.60*100 = 60 crore
CSR spending in the year 2004 = $${5/3}{100}\times 100$$ = 1 crore.
Similarly, we can calculate for the remaining years. Tabulating the same data, (All the values are in crores)
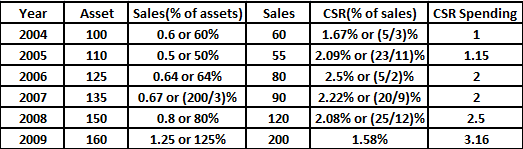
CSR/ Assets ratio for the year 2004 = $$\dfrac{1}{100}$$ = 0.01
CSR/ Assets ratio for the year 2005 = $$\dfrac{1.15}{110}$$ = 0.01045
CSR/ Assets ratio for the year 2006 = $$\dfrac{2}{125}$$ = 0.016
CSR/ Assets ratio for the year 2007 = $$\dfrac{2}{135}$$ = 0.0148
CSR/ Assets ratio for the year 2008 = $$\dfrac{2.5}{150}$$ = 0.0166
We can see that CSR/Asset ratio is maximum for the year 2008. Hence, option E is the correct answer.

Click on the Email ☝️ to Watch the Video Solution
Book Free CAT Mentorship
Get personalized CAT strategy from a 99%iler
500+ students mentored
OTP Verification
Enter the 6-digit code sent to your phone
Booking Summary
Enter OTP
Didn't receive the OTP?

Educational materials for CAT preparation

Ask our AI anything

AI can make mistakes. Please verify important information.
AI can make mistakes. Please verify important information.

