Instructions
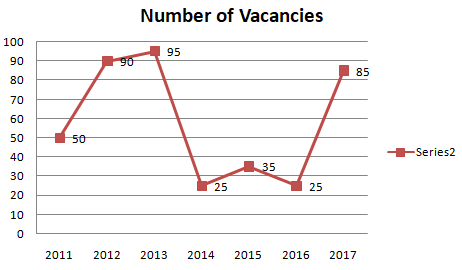
The line graph shows the number of vacancies for management trainees in a certain company. Study the diagram and answer the following questions.
Year
Solution
Number of vacancies in 2011 = 50
Number of vacancies in 2015 = 35
=> Required % = $$\frac{(50-35)}{50}\times100$$
= $$15\times2=30\%$$
=> Ans - (A)
Get AI Help
Create a FREE account and get:
- Free SSC Study Material - 18000 Questions
- 230+ SSC previous papers with solutions PDF
- 100+ SSC Online Tests for Free


