Instructions
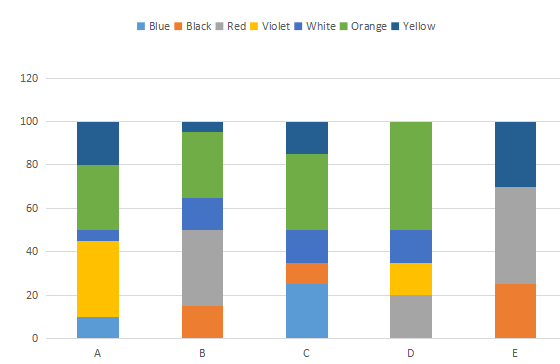
In the following questions, the following Bar Diagram shows the percentage of 7 coloured balls sold in 5 shops A, B, C, D and E. All the five shops sold an equal number of balls. Study the graph and answer all the questions.
Question 149
The difference between the sum of percentages of violet balls sold to the sum of percentages of blue balls sold is
Solution
Since all the shops sold equal number of balls and we are asked to find the ratio, we can directly use the percentages involved.
Total percentage of violet balls = 35+0+0+15+0 = 50
Total percentage of blue balls = 10+0+15+0+0 = 35
Difference in percentage = 15%
Option B is the right answer.
Get AI Help
Create a FREE account and get:
- Free SSC Study Material - 18000 Questions
- 230+ SSC previous papers with solutions PDF
- 100+ SSC Online Tests for Free


