Instructions
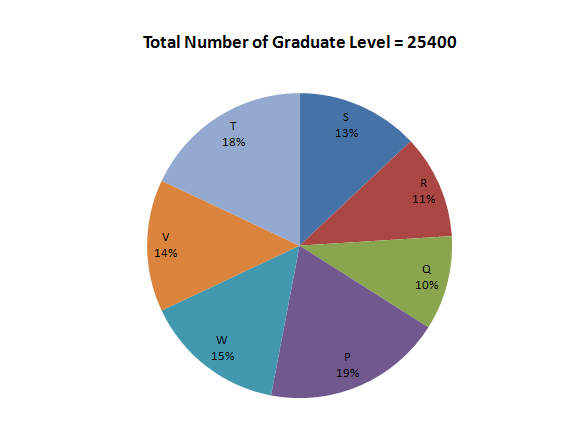
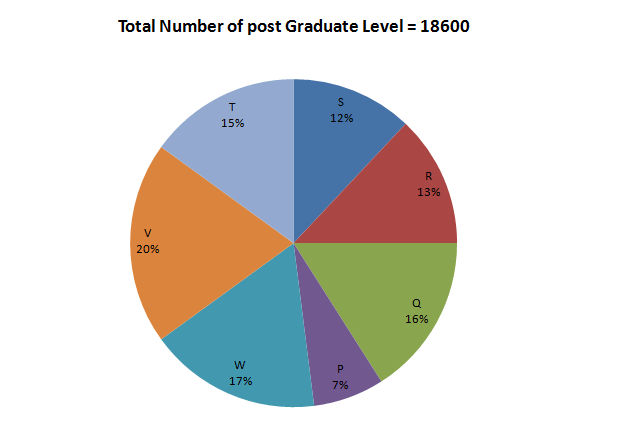
Directions: The following pie-charts show the distribution of students of graduate and post-graduate levels in seven different institutes namely P, Q, R, S, T, V, and W.
Question 106
Approximately how much money belonging to the investment portfolio was invested in State-issued bonds?
Create a FREE account and get:
- All Quant Formulas and Shortcuts PDF
- 100+ previous papers with solutions PDF
- Top 5000+ MBA exam Solved Questions for Free

MAT Quant Questions | MAT Quantitative Ability
MAT Number Series QuestionsMAT Linear Equations QuestionsMAT Averages QuestionsMAT Venn Diagrams QuestionsMAT Functions, Graphs and Statistics QuestionsMAT Profit and Loss QuestionsMAT Mensuration QuestionsMAT Miscellaneous QuestionsMAT Inequalities QuestionsMAT Geometry QuestionsMAT Remainders QuestionsMAT Quadratic Equations QuestionsMAT Profit And Loss QuestionsMAT Arithmetic QuestionsMAT Time And Work QuestionsMAT Time Speed Distance QuestionsMAT Time, Speed and Distance QuestionsMAT Number Systems QuestionsMAT Percentages QuestionsMAT Coordinate Geometry QuestionsMAT Data Sufficiency QuestionsMAT Logarithms, Surds and Indices QuestionsMAT Probability, Combinatorics QuestionsMAT Simple Interest Compound Interest QuestionsMAT Algebra QuestionsMAT Logarithms QuestionsMAT Progressions and Series QuestionsMAT Averages, Ratio and Proportion QuestionsMAT Averages Mixtures Alligations Questions
MAT DILR Questions | LRDI Questions For MAT
MAT Data Interpretation Basics QuestionsMAT Scheduling QuestionsMAT Miscellaneous LR QuestionsMAT Special Charts QuestionsMAT Maxima-Minima QuestionsMAT Coins and Weights QuestionsMAT Routes And Networks QuestionsMAT DI Miscellaneous QuestionsMAT Table based DI Sets QuestionsMAT DI with connected data sets QuestionsMAT Venn Diagrams QuestionsMAT Games and Tournaments QuestionsMAT Charts QuestionsMAT Truth Lie Concept QuestionsMAT Data Interpretation QuestionsMAT Selection With Condition QuestionsMAT Data change over a period QuestionsMAT Quant Based LR QuestionsMAT Quant Based DI QuestionsMAT Puzzles QuestionsMAT 2D & 3D LR QuestionsMAT Arrangement Questions
MAT Verbal Ability Questions | VARC Questions For MAT
Free MAT Quant Questions
MAT ArithmeticMAT Time And WorkMAT Linear EquationsMAT MensurationMAT Functions, Graphs and StatisticsMAT Profit And LossMAT Number SystemsMAT Probability, CombinatoricsMAT Venn DiagramsMAT AlgebraMAT AveragesMAT Averages Mixtures AlligationsMAT Coordinate GeometryMAT Profit and LossMAT RemaindersMAT MiscellaneousMAT Averages, Ratio and ProportionMAT LogarithmsMAT InequalitiesMAT Logarithms, Surds and IndicesMAT GeometryMAT Number SeriesMAT PercentagesMAT Quadratic EquationsMAT Progressions and SeriesMAT Time, Speed and DistanceMAT Simple Interest Compound InterestMAT Data SufficiencyMAT Time Speed Distance
Book Free CAT Mentorship
Get personalized CAT strategy from a 99%iler
500+ students mentored
OTP Verification
Enter the 6-digit code sent to your phone
Booking Summary
Session:Free CAT Mentorship
Phone:
Date:
Time:
Enter OTP
Didn't receive the OTP?


