The table given below represents the number of cars sold by four dealers P, Q, R and S in six months of a given year. Based on the given data, answer the question.
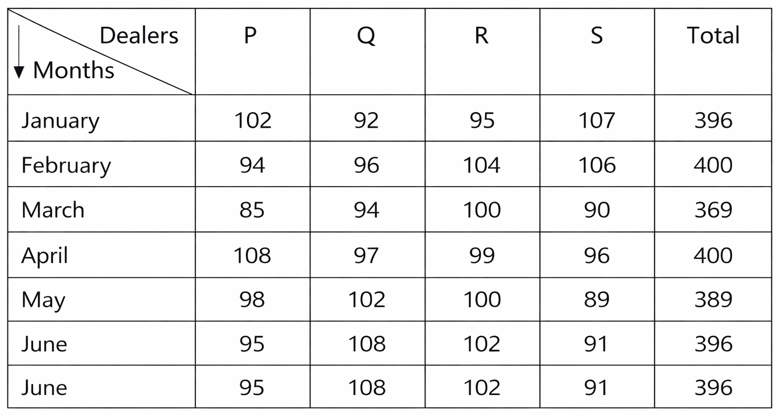
What is the ratio of the total number of cars sold by dealer P in February, April and May to the total number of cars sold by dealer S in March, May and June?
Solution
Number of cars sold by P in February, April and May = 94 + 108 + 98 = 300.
Number of cars sold by S in March, May and June = 90 + 89 + 91 = 270.
The required ratio = 300 : 270 = 10:9 i.e. Option D.
Get AI Help
Create a FREE account and get:
- All Quant Formulas and shortcuts PDF
- 40+ previous papers with detau solutions PDF
- Top 500 MBA exam Solved Questions for Free

CMAT Quant Questions | CMAT Quantitative Ability
CMAT DILR Questions | LRDI Questions For CMAT
CMAT Verbal Ability Questions | VARC Questions For CMAT
Free CMAT DILR Questions
Book Free CAT Mentorship
Get personalized CAT strategy from a 99%iler
500+ students mentored
OTP Verification
Enter the 6-digit code sent to your phone
Booking Summary
Enter OTP
Didn't receive the OTP?


