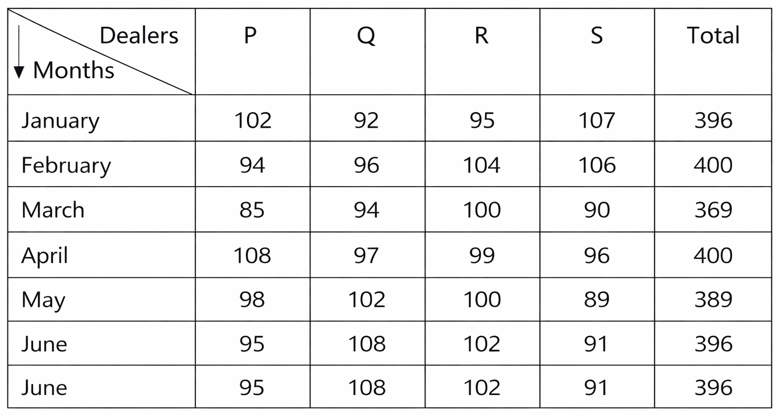
The table given below represents the number of cars sold by four dealers P, Q, R and S in six months of a given year. Based on the given data, answer the question.
Sign in
Please select an account to continue using cracku.in
↓ →
The table given below represents the number of cars sold by four dealers P, Q, R and S in six months of a given year. Based on the given data, answer the question.
What is the ratio of the total number of cars sold by dealer P in February, April and May to the total number of cars sold by dealer S in March, May and June?
Number of cars sold by P in February, April and May = 94 + 108 + 98 = 300.
Number of cars sold by S in March, May and June = 90 + 89 + 91 = 270.
The required ratio = 300 : 270 = 10:9 i.e. Option D.
The total number of cars sold by dealer P during February to June is what
percent(%) more than the total cars sold by all the dealers in June?
Total number of cars sold by Dealer P from Feb to June = 94 + 85 + 108 + 98 + 95 = 480.
Total cars sold by all the dealers in June = 396.
The required percentage = $$\frac{480-396}{396}\times\ 100\ \approx\ \ 21.2\%$$.
The total number of cars sold by dealer Q in Apri l, May and June is what
percent of the total number of cars sold by all dealers in February and April ?
The total number of cars sold by dealer Q in April, May and June = 97 + 102 + 108 = 307.
the total number of cars sold by all dealers in February and April = 400 + 400 = 800.
The required percentage = $$\frac{307}{800}\times\ 100\ =\ 38\frac{3}{8}\%$$ i.e. Option D.

Educational materials for CAT preparation