Read the information given below and answer the 3 associated questions.
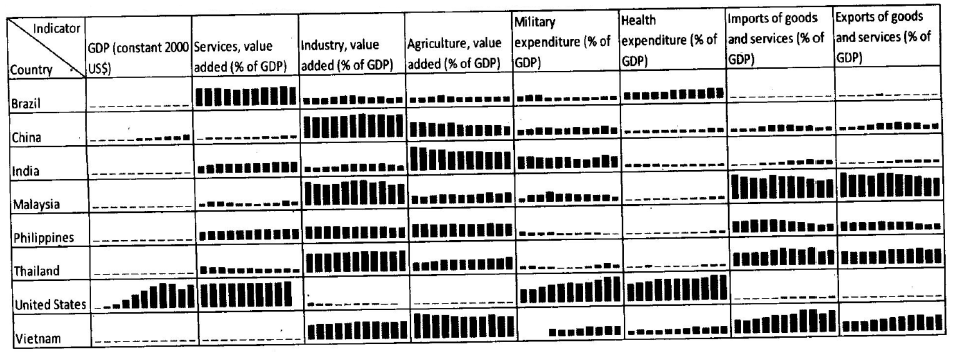
The following graph depicts sector-wise percentage contributions to the gross domestic product (GDP) of nine nations, labelled “Nation A”, “Nation B” and so on. It is known that these nations are Brazil, China, France, Germany, India, Japan, Russia, the UK and the USA, but not necessarily in the same order.

The following, however, are known:
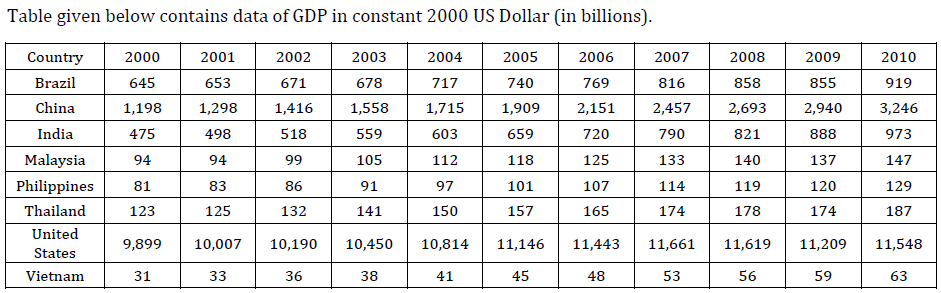
i) The GDPs of the nine nations (in US $ trillion) are:

ii) China has the highest agriculture sector GDP, valued at US $1 trillion, followed respectively by the USA and India
iii) In terms of percentage contribution to the respective nations’ GDPs by their service sectors, the UK and France are respectively the first and the second
iv) Nation A, Nation B and Nation G have the same GDP
v) The GDP of India’s industry sector is lower than the GDP of Russia’s industry sector. However,it is larger than that of Brazil's industry sector