If you go through the options, you will find that only option B supports the given conditions.
Let the ratio of investments in gold, US and EU bonds be 40%, 40% and 20%, respectively.
Thus, the investment amounts are 320000, 320000 and 160000, respectively.
For returns in August 2010:
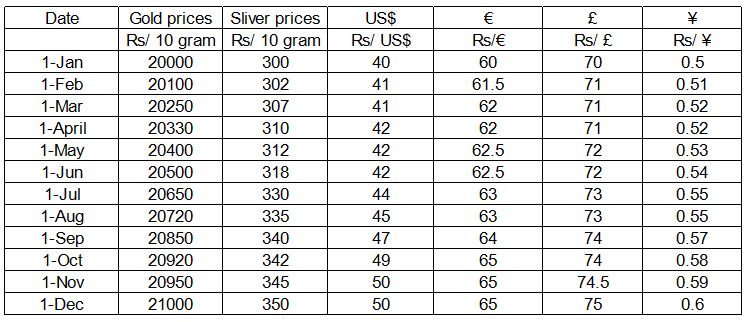
Gold: (20720/20000) *320000 = 331520
US bonds: (45/40)*320000 + (320000 * 8 * 10)/(12 * 100) = 381333
EU bonds: (63/60)*160000 + (160000 * 8 * 20)/(12 * 100) = 189333
Thus, total returns in August = 902186
Thus, percentage return = 90218600/800000 = 13 ( approx.)
Hence, it satisfies the condition for August.
For returns in September 2010:
Gold: (20850/20000) *320000 = 333600
US bonds: (47/40)*320000 + (320000 * 9 * 10)/(12 * 100) = 400000
EU bonds: (64/60)*160000 + (160000 * 9 * 20)/(12 * 100) = 194666
Thus, total returns in August = 928266
Thus, percentage return = 92826600/800000 = 16.25 ( approx.)
Hence, it satisfies the condition for September, too.
Hence, option B is the answer.