The following sentence has been split into four segments. Identify the segment which contains a grammatical error.
Until I was / still a little weak, / I decided to walk home / from the metro station.
SSC CHSL 16th April 2021 Shift-1
For the following questions answer them individually
Select the most appropriate option to fill in the blank.
People have overcome poverty, drug addiction, abuse, divorce, mental illness, and virtually every ______ known to man.
Select the correct passive form of the given sentence.
You can see vast valleys sloping into the distance.
Select the most appropriate option to substitute the underlined segment in the given sentence. If there is no need to substitute it, select ‘No substitution’.
No other place in India gets much rainfall as Mawsynram.
Select the option that will improve the underlined segment in the given sentence. In case no improvement is needed, select 'No improvement'
It is wise to insure one’s home on fire.
Select the most appropriate ANTONYM of the given word.
PUNGENT
Fill in the blank with the most appropriate option.
The craze for taking selfies has only increased our ______ with our own image.
In the given sentence, identify the segment which contains the grammatical error.
The government has announced a gradual reboot of air travel who was halted two months ago due to lockdown.
Select the word which means the same as the group of words given.
An imaginary, perfect state or place
Select the most appropriate meaning of the given idiom.
A bolt from the blue
Select the INCORRECTLY spelt word.
Examine the four jumbled sentences. Out of the given options, pick the one that gives their correct order.
A. That abandoned house is the childhood home of the director Achal Misra, who recreates it in this semi-autobiographical film.
B. It is spread over three decades.
C. ‘Gamak Ghar’ is a unique movie telling the story of a home.
D. These are from 1998 to 2019, wherein the film observes the house age as it is gradually abandoned.
Select the most appropriate synonym of the given word.
RESPLENDENT
Select the most appropriate meaning of the given idiom.
Cost an arm and a leg
Select the most appropriate ANTONYM of the given word.
INORDINATE
Select the option which means the same as the group of words given.
So small or unimportant as to be not worth considering
Select the most appropriate synonym of the given word.
BULL-HEADED
Select the correct indirect form of the given sentence.
“I am going to walk to the market to check which shops are open,” said Anant.
Select the INCORRECTLY spelt word.
Given below are four jumbled sentences. Out of the given options, pick the one that gives their correct order.
A. To kill a whale, hunters used spears called harpoons.
B. Whale hunting is not easy.
C. These harpoons had very long and strong lines tied to them.
D. It was extremely difficult and risky before modern methods and machines began to be used.
In the following passage some words have been deleted. Fill in the blanks with the help of the alternatives given. Select the most appropriate option for each blank.
Comprehension:
Many hundreds of years ago, a Brahmin lived in a town in Northern India. He spent many years (1)______ the ancient books and talking to the learned priests (2)______ came to visit the city. After much effort, he (3) ______ the knowledge of a certain spell. He was (4)______ proud of this and guarded his secret (5)______ .
Select the most appropriate option for blank no. 1.
Select the most appropriate option for blank no. 2.
Select the most appropriate option for blank no. 3.
Select the most appropriate option for blank no. 4.
Select the most appropriate option for blank no. 5.
For the following questions answer them individually
Select the correct combination of mathematical signs that can sequentially replace the * signs and balance the given equation.
110 * 728 * 28 * 15 * 413 = 87
In a certain code language, REASON is coded as 51 and BAKE is coded as 47. How will MARRY be coded in that language?
Four words have been given, out of which three are alike in some manner and one is different. Select the word that is different.
Select the figure that will come next in the following series.
Four numbers have been given, out of which three are alike in some manner and one is different. Select the number that is different.
Four letter-clusters have been given, out of which three are alike in some manner and one is different. Select the letter-cluster that is different.
Select the correct mirror image of the given combination when the mirror is placed at 'PQ' as shown.
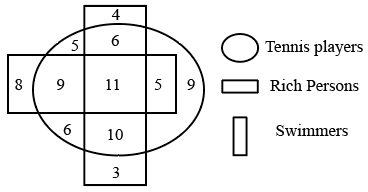
In the given diagram, the shapes indicate the categories of persons. The numbers given in the different segments represent the numberofpersons in that category.
How many tennis players are either swimmers or rich persons but NOT both?
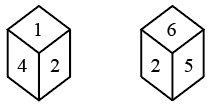
Two different positions of the same dice are shown. Select the number that will be at the top if '1' is at the bottom.
Select the option that is related to the third term in the same way as the second term is related to the first term.
DOCILE : CDEILO : : LABOUR : ?
From the given options choose the one in which the set of numbers do not follow the same Logic/Rule/Relation as the numbers given in below set.
(165, 16, 91)
Rama is the daughter of Radhika, who is the only daughter-in-law of Rekha. Mohan is Rishi’s father and Rekha’s husband. How is Rishi related to Rama?
The sum of the two digits of a two-digit number is 13 and the number obtained by interchanging the two digits is 27 less than the original number. What is the original number?
Select the option in which the given figure is embedded (rotation is NOT allowed).

In a certain code language, EXHALE is written as IFEBBY. How will HINDER be written in that language?
Select the correct option that indicates the arrangement of the given words in a logical and meaningful order.
1. Colour wash
2. Wall
3. Decoration
4. Foundation
5. Roof
6. Floor cementing
Select the combination of letters that when sequentially placed in the blanks of the given letter series will complete the series.
l _ chtlgc _ tlg _ ht _ gc _ tlgch _
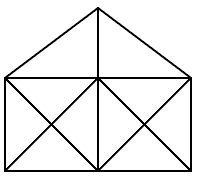
How many triangles are there in the following figure?
Select the number from among the given options that can replace the question mark (?) in the following series.
9, 10, 13, 24, 37, 66, 97, ?
Select the option in which the numbers are related in the same way as are the numbers of the following set.
{6, 9, 18}
Read the given statements and conclusions carefully. Assuming that the information given in the statements is true, even if it appears to be at variance with commonly known facts, decide which of the given conclusions logically follow(s) from the statements.
Statements:
All bulbs are tubes.
Some bulbs are tumblers.
Conclusions:
I. No bulb is a tube.
II. Some tumblers are bulbs.
Select the option in which the numbers share the same relationship as that shared by the given pair of numbers.
9 : 50
Select the option that is related to the third word in the same way as the second word is related to the first word.
Prism : Glass : : Rope : ?
Select the option in which the words share the same relationship as that shared by the given pair of words.
Famine : Drought
The sequence of folding a piece of paper and the manner in which the folded paper has been cutis shown in the following figures. How would this paper look when unfolded?

The average weight of some studentsin a class was 69.5 kg. When 10 students of average weight 68 kg joined the class. and 6 students of average weight 60 kg left the class, it was noted that the average weight of the newgroup of students increased by 2 kg. How many students are there in the class now?
The length of the base of a right-angled triangle is 40 cm and its hypotenuse is 41 cm long. Whatis its area (in cm?) and perimeter (in cm), respectively?
In how manyyears, will ₹5,450 amountto ₹8,175, if invested at simple interest at the rate of 12.5% per annum?
If $$\left(x + \frac{2}{x}\right) = 7$$, then what is the value of $$\left(2x^2 + \frac{8}{x^2}\right)$$?
A bicycle wheel has a radius of 42 cm. It makes 40 revolutions in 25 seconds. Whatis its speed (in km/h, up to one decimalplace)?
P can complete five-eighths of a work in 15 days and Q can complete three-fourths of the same work in 30 days. They worked together for 8 days and then P left. How muchtime will Q working alone, take to complete the remaining work?
The diameter of a wheel is 1.33 m. Whatdistance (in m, to the nearest whole number) will it travel in 380 revolutions?
(Take $$\pi = \frac{22}{7}$$)
If $$x - 3 = \frac{1}{2x}$$, then what is the value of $$\left(x^4 + \frac{1}{16x^4}\right)$$?
Akite is flying at a height of 138 m above the ground.It is attached to a string inclined at $$45^\circ$$ to the horizontal. What is the approximate length (in m) of the string?
Study the line graph and answer the question that follows.
The line graph represents the number of vehicles (in thousands) manufactured by two automobile companies A and B over the years from 2010 to 2015. The X-axis represents the years and the Y-axis represents number of vehicles in thousands.
(The data shown here is only for mathematical exercise. They do not represent the actual figures of the country.)

The average value of the vehicles manufactured by Company A is what per cent of the average value of the vehicles manufactured by Company B during 2010 to 2015?
n = 475AB is a positive integer whose tens and units digits are A and B, respectively. If n is divisible by 5, 8 and 9, then what is (10A + B)?
Study the given bar graph and answer the question that follows.
A tea plantation company produces three varieties of tea—black tea, green tea and herbal tea. The production of three varieties (in million tonnes) over a period of six years from 2014 to 2019, has been shown in the bar graph here. The X-axis represents the years and the Y-axis displays the production of the three varieties in million tonnes.

The average value of the combined production of black tea and herbal tea from 2014 to 2019 is what percent (up to 1 decimal place) of the average value of the production of green tea during the same period?
Asolid metallic right circular cylinder has diameter 32 cm and height 9 cm.It is melted and recast into a solid sphere. What is the radius (in cm)of the sphere?
What is the value of $$\frac{\sin 33^\circ \cos 57^\circ + \sec 62^\circ \sin 28^\circ + \cos 33^\circ \sin 57^\circ + \cosec 62^\circ \cos 28^\circ}{\tan 15^\circ \tan 35^\circ \tan 60^\circ \tan 55^\circ \tan 75^\circ}$$?
Aman sells two articles for 2620 each, oneat a profit of 24% and the other at a loss of 24%. Whatis his loss/profit per cent in the whole transaction?
If $$A = 60^\circ$$, then what is the value of $$(4 \cos^3 A - 3 \cos A)$$?
The expenditure on food is 35%ofthe income ofa particular family. If the income is raised by 30%, then how much percentage(to the nearest whole number)of food expenditure is less than the initial percentage to keep the food expenditure unchanged?
A man cycles from P to Q, a distance of 30 km, in 2 hours 48 minutes. The road from P is a level road for 18 km and then it is uphill to Q. The man's average speed onthe level road is 15 km/h. What is his average uphill speed (in km/h)?
The perimeter of an isosceles triangle is 91 cm, and its base is $$1\frac{1}{4}$$ times each of its equal sides. What is the length (in cm) of its base?
Solution
Login to view the detailed solution.
The given bar graph shows the production of table fans in a factory during one week. Study the bar graph and answer the question that follows.

The production of fans on Tuesday is what percentage of the total production of fans during the week?
What is a single discount(to the nearest whole number) equivalent to the successive discounts of 10%, 17% and 25%?
Study the given pie-chart and answer the question that follows.
The pie-chart represents the consumption offuel (in million litres) by various modes of transport of a country X in the year 2015. The total consumptionof fuel by various modesof transport of the country is 800 millionlitres.
(The data shown here is only for mathematical exercise. They do not representthe actual figures of the country.)

The fuel consumed by light vehicles is approximately what percentage of the combined consumption of fuel for aviation and waterways?
If 7A = 4B = 14C, then what is A : B : C?
The value of $$\frac{87 + \frac{2}{5} of 115}{25 - \frac{2}{3} \times \left\{45 of 2 \div (19 - 4)\right\}}$$ is:
If $$\left(\frac{x}{y} + 1\right) = 4$$, then what is the value of $$\left(\frac{x^2 + y^2}{y^2}\right)?$$
Fort Saint Louis was a ______ fort that stood in Pondicherry on the eastern coast of India.
______ is the process of allowing particles in suspension in water to settle out of the suspension under the effect of gravity.
Who among the following wrote the book 'Indomitable Spirit'?
Who among the following received the ’ASSOCHAM Enterprise of the Century Award’ in December 2020?
Which of the following cities of Madhya Pradesh were included in the list of UNESCO’s world heritage cities under its urban landscape city programme in December 2020?
Which of the following banks appointed Infosys Finacle to power its digital transformation in November 2020?
The Lucknow Pact of December 1916 was an understanding between the Indian National Congress and the ______.
What is the boiling point of water at sea level?
Which Indian holds the Olympic record as on March 2021 for most goals scored by an individual in an Olympic men’s hockey final?
West Bengal's first oil and gas reserve - the Bengal Basin, dedicated to the nation on 20 December 2020, is the ______ oil and gas producing basin of India.
‘Ong’ and ‘Tel’ are tributaries of the river ______.
Who was the Solicitor General of India as of January 2021?
‘Nuakhai’ is the greatest harvesting festival of Odisha, celebrated one day after of which of the following festivals?
Which form of farming is called ‘slash and burn’ agriculture?
In which of the following states is Kali Tiger Reserve located?
Jog Falls is the most thrilling spectacle in the entire western region of ______.
‘Wings of Fire’ is an autobiography of ______.
In which year was the first ever version of Microsoft Word - Word 1.0 launched?
JPEG is a commonly used method of lossy compression for digital images. What is the full form of JPEG?
As of January 2021, how many states have the upper house called State Legislative Council (Vidhan Parishad)?
‘Sakewa’ is a religious festival celebrated in the state of ______.
As per ’Basel III: A global regulatory framework for more resilient banks and banking systems’ released in December 2010, banks will be required to hold a capital conservation buffer of ______ of risk weighted assets (RWAs) in the form of common equity to withst and future periods of stress.
Which two Indians became the first pair to reach the finals of all Grand Slams in a year in the Open era, winning French Open and Wimbledon as top seeds?
In December 2020, Kyle Coetzer was honoured with the ICC Associate Player of the Decade award. Which of the following countries does he represent?
The Energy and Resources Institute and NDMA has launched a Flood Early Warning System (FEWS) for Guwahati to alert local authorities about flash floods or any heavy rainfall in August, 2020. What is the full form of NDMA?

