Which of the following statements best summarises what the author is trying to do in this passage?
SRCC GBO 2023 Question Paper
Read the given passage and answer the questions that follow.
Though the US prides itself on being a leader in the World community, a recent report shows that it lags far behind other industrialised countries in meeting the needs of its youngest and most vulnerable citizens. The US has a higher infant mortality rate, a higher proportion of low birth weight babies, a smaller proportion of babies immunised against childhood diseases and a much higher rate of adolescent pregnancies. These findings, described as a ‘quiet crisis' requiring immediate and far reaching action, appeared in a report prepared by a task force of educators, doctors, politicians and business people.
According to the report, a fourth of the nation's 12 million infants and toddlers live in poverty. As many as half confront risk factors that could harm their ability to develop intellectually, physically and socially. Child immunisations are too low, more children are born into poverty, more are in substandard care, while their parents work and more are being raised by single parents. When taken together, these and other risk factors can lead to educational and health problems that are much harder and costlier to reverse.
The crisis begins in the womb with unplanned parenthood. Women with unplanned pregnancies are less likely to seek pre-natal care. In the US, 80% of teenage pregnancies and 56% of all pregnancies are unplanned. The problems continue after birth, where unplanned pregnancies and unstable partnerships often go hand in hand. Since 1950, the number of single parent families has nearly tripled. More than 25% of all births today are to unmarried mothers, As the number of single parent families grows and more women enter the work force, infants and toddlers are increasingly in the care of people other than their parents. Most disturbingly, recent statistics show that American parents are increasingly neglecting or abusing their children. In only four years from 1987-1991, the number of children in foster care increased by over 50%. Babies under the age of one are the fastest growing category of children entering foster care. This crisis affects children under the age of three most severely, the report says. Yet, it is this period - from infancy through preschool years - that sets the stage for a child's future.
Solution
Let's take a look at each option individually:
A: The author's main point is not to say that the parents are failing their children. Yes, they might not be taking care of their children and going to work, leaving them in the care of other people and foster homes, but the author does not blame the parents for this. He states those facts and tells us about the impact of these numbers; he does not say that it is the parent's fault for not planning their children's birth or not taking care of them. He simply states the facts and information about the serious condition the US is going through.
B: This is exactly what the author tries to do throughout the passage. He tells us the statistics about the problem in the USA regarding unplanned parenthood, single parents, and an increase in the number of children in healthcare. He is not giving an opinion or blaming any single entity for the condition but simply informing his readers about it.
C: This is again not true, as the author nowhere blames the state for the state of affairs.
D: There has been little to no discussion about the lack of nutrition in the children (infants and toddlers), this is complete;y out of scope of the passage.
Hence, Option B best represents the main point of the author's passage.
Therefore, option B is the correct answer.
Which of the following sets of words does NOT capture the main ideas expressed in the passage?
Solution
The set of words that does NOT capture the main ideas expressed in the passage is Option B) America, progress, education
The passage primarily discusses the issues faced by infants and toddlers in the US, such as high infant mortality rate, low birth weight, low immunisation rates, and high rates of adolescent pregnancies. It also highlights the problems of unplanned parenthood, poverty, and single-parent families.
The terms ‘progress’ and ‘education’ are not central to the issues discussed in the passage.
Hence, option B does not capture the main ideas of the passage.
Which of the following is NOT an instance of the ‘quiet crisis' referred to in the passage?
Solution
Option D is NOT an instance of the ‘quiet crisis’ referred to in the passage.
The passage mentions that women with unplanned pregnancies are less likely to seek pre-natal care.
Therefore, an increase in the number of young mothers seeking pre-natal care would not be part of the ‘quiet crisis’.
The other options A, B and C are all issues highlighted in the passage as part of the crisis.

All of the following statements can be inferred from the passage, EXCEPT:
Solution
The statement that cannot be inferred from the passage is Option D
The passage does not provide any information about the divorce rate among teenage couples or its impact on educators.
While it does discuss the issues of unplanned pregnancies and single parenthood, it does not specifically mention divorce rates among teenagers. Therefore, option D cannot be inferred from the passage. The other options, A,B and C, can be inferred from the information provided in the passage.
Which of the following would NOT be a measure suggested by the task force?
Solution
The measure that would NOT be suggested by the task force, based on the passage, is Option C
The passage does not mention any suggestion about rewarding parents for looking after their children. While it does discuss the issues of poverty, abuse, and healthcare, it does not specifically mention a reward system for parents. Therefore, option C would not be a measure suggested by the task force. The other options, A, B and D, could be inferred as potential measures based on the issues highlighted in the passage.
Read the given passage and answer the question that follows.
We live in a networked world. The internet is built for sharing things at little to no cost. We forward our emails, capture photos on cellphones and tweet opinions, all activities that leave a trail of data that can be collected without our knowledge. Privacy — the right to be free from unwanted intrusion — no longer exists in an absolute sense.
Regulating tech companies could create problems worse than the ones we seek to solve. The biggest companies — led by Facebook, Amazon, Netflix and Google in the United States . . . have all become both hugely profitable and vital to the global economy. The Department of Labor estimates that employment in the computer and information technology sectors in the United States will grow 12 percent from 2016 to 2026, much faster than the average for all occupations. The companies also provide income to millions of non-employees, including Airbnb hosts, Instagram influencers, eBay sellers, and Uber and Lyft drivers. If we constrict their fuel — data — we may hurt not only the quality, cost and speed of their services, but also the drivers of growth for the world’s economy.
Innovation will also suffer. Our culture celebrates entrepreneurship and accepts failure as part of the process. As a result, the United States has been the architect of the new economy. But privacy evangelists have made villains of the very companies the world emulates. Rather than debate how to expand this economic opportunity, they call for fettering it. The evangelists assert that regulating access to data or breaking up big companies will put that data back in our control. But this is naive. We share our photos, emails and other personal data daily. Almost any individual or company, big or small, can collect and misuse it. Size doesn't make a difference.
If safety is the actual goal of protecting privacy, consider this: Large tech companies may be our best line of defense against hackers, state surveillance and terrorists. These companies have the talent and resources to match well-funded and sophisticated adversaries. As the threat of cyberwarfare grows, shouldn't we consider whether it would be prudent to break up companies that are our best allies against foreign and criminal intrusion? . .. Consumers, on the other hand, potentially can have more influence over these companies. When those companies violate the public's trust, the news travels fast — often on the platforms themselves — and people stop visiting the sites, causing them to lose revenue. .. . If we untether ourselves from the old paradigms, we can open our minds to real solutions to expand opportunity and innovation while ensuring our safety. Where privacy is actually the issue, our laws should focus on deterring companies, institutions and individuals from misusing data to cause actual harms, such as slander, harassment, human trafficking, discrimination, fraud and corruption.
The big tech companies are neither heroes nor villains in this narrative. They create jobs and render certain jobs obsolete. . . . Progress is a messy business. Instead of trying to preserve what was, let's realistically debate the world we want.
The author lists all of the following arguments to refute the claims that “privacy evangelists" make about big tech companies EXCEPT:
Solution
The correct answer is option B.
The author does not mention that big tech companies are firmly accountable to strict domestic regulations and laws and can be curtailed if they engage in criminal violation of data. The other options (a, c, d) are all arguments made by the author in the passage.

All of the following have been suggested as ways to tackle the infringement of data privacy EXCEPT:
Solution
The passage does not suggest treating big tech companies as public utilities subject to laws that deter them from misusing data to cause actual harm. So, the correct answer is Option C.
The passage does discuss stricter laws and regulations, collective action by consumers, and regulation of access to data, but it does not mention treating tech companies as public utilities. It rather suggests that these companies are vital to the global economy and innovation and that they can be a line of defence against cyber threats.
It also suggests that laws should focus on deterring the misuse of data to cause actual harm. However, it does not propose treating these companies as public utilities.
The other options are mentioned by the author in the passage.
In the first paragraph, the author:
Solution
The correct answer is Option D.
In the first paragraph, the author notes various reasons for the erosion in privacy today, such as forwarding emails, capturing photos on cellphones, and tweeting opinions, which all leave a trail of data that can be collected without our knowledge. The author states that privacy no longer exists in an absolute sense in our networked world.
The other options are not the main focus of the first paragraph.
The author makes all of the following observations regarding restricting data access EXCEPT:
Solution
The author makes all of the following observations regarding restricting data access except Option C
The passage does not mention or suggest that restricting data access hampers governmental efforts to formulate laws that tackle harmful data misuse.
The other options, A, B and D, are discussed in the passage.

The author cites all of the following benefits from today's big technology companies EXCEPT:
Solution
Option D is the correct answer.
The passage does not mention or suggest that big tech companies are a major contributor to the public exchequer through tax revenue.
Other options are mentioned in the passage.
Option A: The author suggests that big tech companies have a significant impact on global progress and growth. This is due to their role in job creation, economic activity, and innovation.
Option B: The author points out that these companies are a crucial source of innovation, which is vital for our modern economies. They drive technological advancements and create new markets and opportunities.
Option C: The author argues that big tech companies can act as a defence against cyber threats. They have the resources and expertise to counter sophisticated cyber-attacks and surveillance.
For the following questions answer them individually
Given below is a sentence in jumbled order. From the following options, select the one which is grammatically correct as he asked for a raise / notwithstanding / the young man looked / his nervousness / directly in the eyes / his employer.
Solution
The grammatically correct sentence from the given options is Option C.
This sentence correctly uses “notwithstanding” as a preposition meaning “in spite of” or "despite".
It indicates that despite his nervousness, the young man was able to look his employer directly in the eyes while asking for a raise. The other options have incorrect or awkward sentence structures.
Select the most appropriate ANTONYM of the underlined word:
Senior executives with years of experience have valuable advice for junior employees - but their decades-younger colleagues also have lots to teach their higher-ups.
Solution
Valuable means something of value.
Option A: Invaluable means something too important to have a value or something indispensable.
Option B: Priceless, similarly, means something beyond being priced.
OptionD: Wothwhile means something that is worth the effort it takes.
All of these options take a positive aspect on the value of the thing. The antonym of valuable would be something that is not valuable.
Optoin C: Worthless means something which is not worth or have no real use or value.
Therefore, Option C is the correct answer.

Identify the option that would correctly fill in the blanks of the given paragraph.
Our science teacher (a) _________ to return the corrected test papers by noon on Monday. She, I (b) _________ sure, (c) _________ marking them by Monday morning. She (d) _________ us in the 'laboratory by 9 a.m. in the morning but (e) _________ our marks only when she (f) _________.
Solution
Option A is the correct answer:
(a) had promised: This refers to a completed action in the past (promised) relevant to the current situation.
(b) am: This indicates the speaker's current state of belief ("I am sure").
(c) would have finished: This is a hypothetical situation—if she had continued marking through the weekend, she would have finished by Monday morning.
(d) is meeting: This refers to a scheduled meeting happening in the present ("by 9 a.m. in the morning").
(e) would reveal: This refers to a future action that is dependent on another action ("only when she meets").
(f) meets: This refers to her habit or usual action ("when she meets").
Option B: had been promising: This suggests repeated promises in the past, which isn't necessary here.
Option C: will have finished: This suggests the marking will be finished in the future, which contradicts the context of Monday morning.
Option D: has promised: This is grammatically correct but less specific than "had promised," which emphasizes a completed promise.
Therefore, Option A is the correct answer.
The following sentence has been split into four segments. Identify the segment that contains an inappropriately used preposition.
The chameleon can remain very still / on a branch for hours / and it can shoot off its tongue /to a distance of 10 centimetres.
Solution
The answer is Option A. It should be It can shoot out its tongue rather than shoot off.
Shoot off: This phrasal verb typically implies detachment or removal. For example, we might say, “He shot off an email” (meaning he sent an email quickly). However, in the context of the chameleon’s tongue, “shoot off” doesn’t convey the intended action accurately. It suggests detachment rather than extension.
Shoot out: This phrasal verb means rapidly extending or projecting something outward. When we say the chameleon can “shoot out its tongue,” we’re describing the quick, precise movement of its tongue as it catches prey. The emphasis here is on the action of extending the tongue.
Therefore, the correct phrase is “It can shoot out its tongue,” emphasizing the rapid extension of the chameleon’s tongue to catch insects.
Identify the word that best completes the analogy.
STAR : CONSTELLATION :: CAT ___________.
Solution
The relationship between the first pair of words (STAR and CONSTELLATION) must be identified in this analogy. Then, we find a word that shares a similar relationship with CAT.
STAR is a component or part of a CONSTELLATION. A constellation is a group of stars forming a recognizable pattern in the sky.
Now let’s consider the options:
a) CLOWDER: A clowder is a group of cats that matches the relationship between a single cat and a group of cats.
b) TROOP: A troop typically refers to a group of soldiers or scouts. This doesn’t match the relationship between a single cat and a group of cats.
c) PARLIAMENT: A parliament is a group of owls. Again, this doesn’t match the relationship between a single cat and a group of cats.
d) PACK: A pack is a group of wolves.Again, this doesn’t match the relationship between a single cat and a group of cats.
Therefore, Option A is the correct answer.

Select the most appropriate meaning of the given idiom
Give it a whirl
Solution
The idiom “Give it a whirl” means to give something a try which is mentioned in Option D.
Choose the most appropriate phrase that would fill in the blanks and complete the given text Corky's uncle didn't want him to be an artist. He didn't think he had any talent (a) _________ He was always urging him to chuck Art and go into the jute business and start at the bottom and (b) _________ Jute had apparently become a (c) _________ with him. And what Corky said was that, while he didn't know what they did at the bottom of the jute business, instinct told him that it was something too beastly for words. Corky, moreover, believed in his future as an artist. Someday, he said, he was going to (d) _________.
Solution
The correct answer is Option C.
The complete text would be: Corky’s uncle didn’t want him to be an artist. He didn’t think he had any talent in that direction. He was always urging him to chuck Art and go into the jute business and start at the bottom and work his way up. Jute had apparently become a sort of obsession with him. And what Corky said was that, while he didn’t know what they did at the bottom of the jute business, instinct told him that it was something too beastly for words. Corky, moreover, believed in his future as an artist. Someday, he said, he was going to make it big.
The other options are not grammatically correct or don't fit the passage's context.
Among the four words in the options, three are alike in some way and one is different. Find the odd one out
Solution
Delightful: This word conveys a positive emotion or feeling. It is associated with joy, pleasure, and happiness. When something is delightful, it brings a sense of enjoyment or satisfaction.
Misery: In contrast, “Misery” represents a negative state or feeling. It signifies suffering, distress, or extreme unhappiness. When someone is in misery, they are experiencing great discomfort or pain.
Expectation: The word “Expectation” relates to anticipation or hope. It refers to what we anticipate or predict will happen in the future. Expectations can be positive or negative, depending on the context.
Failure: “Failure” signifies lack of success or achievement. It is associated with not meeting desired goals or outcomes. Failure can be disappointing and discouraging.
When comparing these words:
Delightful stands out because it is the only positive emotion among the options.
The other three words—Misery, Expectation, and Failure—all have negative connotations.
Select the most appropriate option to fill in the blank
He ran as fast as he could, with the angry shopkeeper __________.
Solution
The most appropriate option to fill in the blank is:
He ran as fast as he could, with the angry shopkeeper hard on his heels.
So, the answer is Option D. This phrase is used to describe someone closely following or pursuing another. In this context, it means that the shopkeeper was chasing him closely.
Identify the odd one out.
Solution
Looking at the options, we can see that a carrot is a type of vegetable, and an apple is a type of fruit. Tubers are essentially plant parts that are enlarged to form storage containers that plants use to hold nutrients. This allows them to feed their offspring or survive through the winter. Potatoes are a form of stem tuber.
This leaves us with tomato. Tomatoes are used in making salads and are a part of salads, but they are not a type of salad.
Hence, the tomato is the odd one out among the given options.
Therefore, option A is the correct answer.
Among the four words in the options, three are alike in some way and one is different. Find the odd one out
Solution
Let's take a look at the tone and meaning of each option individually:
(A) Adoring: This word has a positive tone and means showing deep love and affection.
(B) Jealous: This word has a negative tone and means feeling or showing envy of someone or their achievements and advantages.
(C) Manic: This word has a somewhat negative tone. It means showing wild, deranged, or excited energy, often in a way that is overwhelming or uncontrollable.
(D) menacing: This word has a negative tone as well. It means suggesting the presence of danger or threat.
"Adoring" is the only word with a positive connotation and, hence, is the odd one out.
Therefore, Option A is the correct answer.
Select the most appropriate option to #ll in the blanks.
If you want to __________ people in a positive way, then your attitude and how you __________ using non-verbal communication is very important
Solution
The most appropriate option to fill in the blanks is Option A.
So, the completed sentence is: “If you want to influence people in a positive way, then your attitude and how you are perceived using non-verbal communication is very important.”
This option best captures the essence of the sentence, which is about positively influencing people through one’s attitude and non-verbal communication. The other options may not fully convey the positive aspect implied in the sentence.
Option B is not the best fit because the word “control” can have a negative connotation, implying manipulation rather than positive influence. The phrase “how you seem” is also less precise than “how you are perceived”.
Option C, while positive, doesn’t quite fit the context. “Inspire” is more about motivating others through one’s actions or words, and “are apparent” suggests a clear, obvious presence, which doesn’t necessarily relate to non-verbal communication.
Option D is not ideal because “impact” is a broader term that can be either positive or negative, and “are seen” is less specific about the perception of others compared to “are perceived”. Therefore, these options are not as suitable as option A for the given sentence.
Select the most appropriate phrase toll in the blanks and complete the given text.
The global village that we live in brings with it (a) _______ possibilities. Travel around the globe has (b) _______ Movement of people from one nation to another has (c) _______ of cultures, language and customs. Lets revel in this (d)_______.
Solution
The most appropriate phrases to fill in the blanks and complete the given text are from option c.
Here’s the completed text:
“The global village that we live in brings with it (a) plentiful possibilities. Travel around the globe has (b) never been so easy. Movement of people from one nation to another has c) led to a mélange of cultures, language and customs. Let’s revel in this (d) newfound potpourri.”
Select the most appropriate option to fill in the blank
I didn't ________ to take the money from my poor nephew.
Solution
The most appropriate option to fill in the blank Option B.
So, the sentence would read: “I didn’t have the heart to take the money from my poor nephew.” This phrase is used to express that someone couldn’t do something because it made them feel guilty or it seemed too cruel.
Options A,C and D doesn't fit into the blank in the given context.
Match the given words with their antonyms.

Solution
Anomaly means something that deviates from what is standard, normal, or expected. The antonym is Conformity, which means compliance with standards, rules, or laws.
Chicanery: This means deception or trickery, especially by using language. The antonym is Honest, which means free of deceit; truthful and sincere.
Eulogy: This is a speech or piece of writing that praises someone or something highly, typically someone who has just died. The antonym is Censure, which means expressing severe disapproval of (someone or something), especially in a formal statement.
So, the correct match is:
a) Anomaly - 2. Conformity
b) Chicanery - 1. Honest
c) Eulogy - 3. Censure
Hence, Option B is the correct answer.
Identify the option that would appropriately complete the final sentence below.
As heuristics and biases are hard-wired into our behaviour, each of us is prone to certain ways of thinking which makes it hard for us as individuals to see all the edges of a crisis and to understand its mutability. We tend to become anchored to one plan or solution,___________.
Solution
Option D is the correct answer. This choice conveys that despite the crisis shifting or changing direction, we remain anchored to a single plan or solution.
The phrase “even as” is a conjunction that indicates a contrast or concession. It is commonly used to introduce a clause that contrasts with the main idea. In this context, “even as” connects the idea of remaining anchored to a single plan or solution with the simultaneous occurrence of the crisis shifting or changing direction.
The following sentence has been split into four segments. Identify the segment that contains a grammatical error.
By the end of next year, / my friend's parents / had been married / for 25 years.
Solution
Option B is the correct answer. 'had been married' is a wrong phrase in the sentence.
The revised version should be:
“By the end of next year, my friend’s parents will have been married for 25 years.”
Identify the odd one out.
Solution
Going through the given options, we can see that Canoe, Helicopter and Submarine are all modes of transport in their respective modes of river, air and sea.
Bicycles are also a mode of transport, but their relationship with wheels is not one of the environment, as it is in the case of the other three. Hence, this is the odd one out.
Therefore, Option C is the correct answer.
Select the most appropriate option to fill in the blank
In this day and age, you are _________ a disadvantage if you are not tech-savvy
Solution
Option D is the correct choice. Saying “you are at a disadvantage” means that not being tech-savvy puts you in an unfavourable position. It’s a common expression to convey this idea.
Let's look at other options.
Option A: This choice doesn’t fit well in the context. Saying “you are in a disadvantage” doesn’t convey the intended meaning. We typically use “at a disadvantage” to express being in an unfavourable position.
Option B: While “with” can be used in other contexts, it doesn’t work here. Saying “you are with a disadvantage” sounds awkward and doesn’t convey the intended meaning.
Option C: Again, this choice doesn’t fit the context. Saying “you are of a disadvantage” doesn’t make sense. We don’t use “of” in this expression.
Therefore, the correct answer is Option D.
Sentence: Being tech-savvy is essential in today’s world, and not being so can indeed put you at a disadvantage.
Match the given words with their synonyms.

Solution
Apropos - Pertinent: Both “Apropos” and “Pertinent” mean being relevant or appropriate in a particular situation. For instance, if someone makes a comment that is directly related to the ongoing discussion, you could say it’s “apropos” or “pertinent.”
Accost - Confront: “Accost” means to approach and address someone boldly or aggressively. Similarly, “confront” involves facing a situation head-on or challenging someone directly.
Appropriation - Allocation: Although not direct synonyms, both terms involve the utilization of resources. “Appropriation” refers to setting aside funds or resources for a specific purpose, while “allocation” involves distributing resources among different areas or needs.
Therefore, the correct answer is Option C.
Read the given passage and answer the question that follow.
So, independent security researchers, commercial security companies and intelligence agencies such as the NSA specialise in trying to find weaknesses that were missed. Some researchers privately notify software makers when they and a vulnerability, but there are also companies that sell them; selling can be lucrative. It is believed that the FBI paid $9,00,000 to a private company to access a locked iPhone. Intelligence agencies and even police departments have been collecting vulnerabilties known as zero-days-. Clearly, the motivation is to protect national interest and public safety, yet it is worth asking what the trade-off is
Which of the following reflects the benefits associated with taking the help of the agencies listed in the passage?
Solution
The benefits associated with taking the help of the agencies listed in the passage include detecting vulnerabilities and ensuring national security. These agencies specialize in finding weaknesses and vulnerabilities, which contributes to safeguarding public safety and national interests.
Therefore, the correct answer is option C.
Let's check other options.
Option A is not accurate. The passage does mention finding weaknesses, but the purpose is not to cause a backlash. Instead, it aims to enhance security.
Option B: While the passage discusses trade-offs, it doesn’t directly associate them with strengthening national security. The primary focus is on detecting vulnerabilities.
Option D: The passage doesn’t specifically mention “national interest” as a primary motivation. It emphasizes security and vulnerability detection.
Five jumbled-up sentences, related to a topic, are given below. Four of them can be put together to form a coherent paragraph. Identify the odd one out
1.The time has already come when a man cannot record a thought without its reaching to all corners of the earth
2. In the political, economic, and ecological fields, we are seeking international solutions.
3.The world has now changed immensely in its knowledge and conceptions of the nature of the universe and man
4.Mankind has come together physically as well as in various fields of life and activity and the interdependence of peoples of the world is recognized widely.
5.The problems these days are global, and the solutions also must be in consonance with it
Solution
We first need to understand what the passage is talking about, and then we can identify the one sentence that does not share the same concept as the other four.
The passage discusses the "inter-dependence" of the world and its people in changing times, and emphasises that, since the problems are now global, the solutions should also be international.
The first sentence appears to be an outlier because it is talking about how the thoughts of a single person will reach all corners of the world. But the passage is neither about thoughts nor about individuals.
Hence, option C is correct.
Parts of the passage below are underlined. Choose the option which reproduces the underlined part making the passage clear, unambiguous, and grammatically correct
Our ego-self is an acquired self, and it is formed from a lifetime of socialization with and exposure to others. The ego-self derives energy through identification with the external world, such as opinions of other people, jobs, appearances or membership in certain groups. While the ego-self is an important part of our personality, and it helps us differentiate ourselves from others with helping us understand our qualities and talents, it is rarely satisfied with what we had
Solution
Option B makes the most grammatical sense and it is the correct answer.
Let's check other options.
Option A: The phrase “and it helps we differentiate ourselves” is grammatically incorrect. It should be “and it helps us differentiate ourselves.”
Option C: The phrase “with helping us understanding” is awkward and incorrect. It should be “by helping us understand.”
Option D: This option changes the focus from “us” to “others.” The original passage discusses how the ego-self helps us differentiate ourselves, not how it helps others understand us.
Select the best option for the sentence given below in order to make it grammatically correct
Reynolds told his aunt he would not mind standing and eat dinner as he is in a hurry to reach the bus station.
Solution
The correct answer is Option A.
Reynolds told his aunt he would not mind standing and eating dinner as he was in a hurry to reach the bus station.
The phrase “standing and eat dinner” needs improvement. When using “mind,” we follow it with a gerund (the base form of the verb + “ing”).
So, we need to change “eat” to “eating.” To maintain a parallel structure, both gerunds should be in the same form. Therefore, we say “standing and eating.”
Although D looks similar to A, the issue with option D lies in the word “hurry.”
In English, we use the phrase “in a hurry” to express that someone is rushing or has limited time. The correct form should be “in a hurry,” not just “in hurry.”
Identify the option that would correctly fill in the blanks of the given paragraph.
(a) ________March, the Poles proposed sending old MiG-29 jets (b) ________Ukraine - a plan that caused much fuss but was then dropped. It was down to Beijing's intervention - part (c) ________ a secret China-US axis that is setting parameters (d) ________the Ukraine war and frying to ensure that Russia's military would ignore any order (e) ________Vladimir Putin to use nukes
Solution
The correct option is indeed (d) In; to; of; for; from.
Here’s the completed paragraph:
“In March, the Poles proposed sending old MiG-29 jets in Ukraine - a plan that caused much fuss but was then dropped. It was down to Beijing’s intervention - part of a secret China-US axis that is setting parameters for the Ukraine war and trying to ensure that Russia’s military would ignore any order from Vladimir Putin to use nukes.
Other options don't make grammatical sense to be filled in the blanks.
Identify the option that could substitute the underlined word in the sentence below, without affecting its contextual relevance.
It took about five seconds after Nancy Pelosi stepped aside for New York Rep. Hakeem Jeffries to coalesce support behind him in a bid to become the new House Democratic leader—he is on track to become the first Black party leader in congressional history.
Solution
The sentence in question is:
“It took about five seconds after Nancy Pelosi stepped aside for New York Rep. Hakeem Jeffries to combine support behind him in a bid to become the new House Democratic leader—he is on track to become the first Black party leader in congressional history.”
The verb “combine” means to unite or merge different elements into a single whole. It is synonymous with “coalesce,” which means coming together or uniting. Therefore, Option D is the correct answer.
Other options like “conjoin,” “collaborate,” and “conjugate” do not fit the context:
Option A: Conjoin means to join together, but it doesn’t capture the sense of merging or uniting support.
Option B: Collaborate implies working together on a project or task, which is not the intended meaning.
Option C: Conjugate refers to verb forms in grammar and is unrelated to the context.
Identify the option that would correctly fill in the blanks of the given paragraph
The night (a) _______ by brief awakenings. Typically, people (b) _______ without realising that they (c) _______ But sometimes we (d) _______ it - pulled entirely awake. Reasons range from the obvious to the medical
Solution
The correct option is B:
The night is punctuated by brief awakenings. Typically, people return to sleep without realizing that they had ever been awake. But sometimes we might at least be aware of it - pulled entirely awake. Reasons range from the obvious to the medical.
All other options don't make grammatical sense in the given blanks.
Five jumbled up sentences, related to a topic, are given below. Four of them can be put together to form a coherent paragraph. Identify the odd one out
1. When you look back to the origins of influencer marketing, it may all seem like recent history.
2. In recent years, influencer marketing has outperformed traditional marketing methods, such as print, broadcast, and direct mail.
3. To their legions of followers, influencers are often seen as capable of relaying brand messaging that's authentic, not overly commercialised, and in real-time
4. Many infuencers are seen as being more attuned to their audience's interests.
5. Influencers are defined as individuals on social media who may or may not be famous, but who have developed a dedicated following and are thus able to inspire and influence others
Solution
The passage discusses how influencer marketing has shown better results than traditional marketing and what makes influencers connect more effectively with customers.
The first sentence, however, abruptly speaks of influencer history, which is not the context of the passage.
Therefore, the first sentence is an outlier.
Read the given passage and answer the question that follow.
I remember years ago the Delhi School of Economics had many great scholars visit the campus. They talked passionately and knowledgeably not just about the subject but about knowledge as a vocation. One of the most memorable of these performances was by Teodor Shanin, the economic historian who also edited Peasants and Peasant Societies. He talked quietly about his love for his subject and confessed, "I have been studying the peasantry when it was out of fashion, I am in it now when it is fashionable, and I will be there long after it has become out of fashion again.”
Which of the following reflects the author's impression of the takeaways from the visit of scholars to University of Delhi?
Solution
The passage: "They talked passionately and knowledgeably not just about the subject but about knowledge as a vocation."
Then, the author mentions Teodor Shanin as an example of some of the good speeches he heard at the Delhi School of Economics, and not because of his passion for peasantry. His main takeaway from the speeches was the passion of the speakers for their subjects.
Option A is completely alien to the passage.
Option B and D focus on the example rather than the passage's main point.
Option C accurately captures author's main takeaway from he speeches he heard.
Therefore, Option C is the correct answer.
Five jumbled up sentences, related to a topic, are given below. Four of them can be put together to form a coherent paragraph. Identify the odd one out
1. If all the firms in an industry were required to install specific pollution-prevention equipment, the government would need to set up a system to monitor compliance by each of the arms and to punish each violator.
2.Second-hand car markets for example are characterised by thousands of small firms, so there is much greater uncertainty about the industry standards that apply to them
3.It is far easier to regulate and administer an industry which has fewer firms operating within it, than to regulate one with several small firms.
4.However, this does not constitute an unequivocal case for large firms, because we have to weigh this against the costs of large monopolising industries.
5.This would give rise to challenges in administration, not to mention the costs, and there are limits to the penalty that can be imposed on a small violating firms.
Solution
Forming pairs can help us identify the odd sentence here.
Sentences one and five will form a pair because they talk about a scenario where the government needs to act, and sentence five talks about the challenges to the same scenario. Hence, these pairs are valid and a part of the paragraph.
Furthermore, sentences three and four can be a likely pair because they compare and contrast the impact of implementation on small and large firms. Therefore, they are also a pair.
The remaining sentence two shall be dropped because the others are forming more accurate pairs withing each other.
Study the given information and answer the questions that follow.
In companies A and B, the total number of employees is 3600. The ratio of the number 0', employees in A to that in B is 5 : 7. Each employee works in only one of the departments P. Q and R of the company. In company A, 60% of the total employees are males and the rest are females, whereas in company B, the ratio of males to females is 4 : 3.
In company A, 30% of the total female employees work in department Q, 20% of the remaining work in department R, and the rest in department P. Out of the total male employees in company A, 40% work in department P, $$\frac{2}{9}$$ of the remaining in department Q, and the remaining in department R.
In company B, one-third of the male employees work in department R. The number of male employees working in department P is 25% more than that working in department R. Out of the female employees in company B. 60% work in department P. The number of female employees in company B working in department Q is 90 more than the number of female employees in R.
What is the difference between the number of female employees working in department R in company B and the number of male employees working in department Q in company A?
Solution
Ratio of Number of employees in A and B = 5:7 and total employees = 3600. This means that the number of employees in A and B = 1500 and 2100 respectively.
Males in A = 60% of 1500 = 900 and Females = 600. Ratio of males to females in B = 4:3 which means that males in B = 1200 and females in B = 900.
For Females in A, 30% work in Q i.e. 180, 20% of the remaining in R i.e. 84 and the remaining in P i.e. 336.
For males in A, 40% work in P i.e. 360, 2/9th of the remaining in Q i.e. 120 and the remaining in R i.e. 420.
For males in B, one third work in R i.e. 400, 1.25*400 i.e. 500 work in P and the remaining work in Q i.e. 300.
For females in B, 60% work in P i.e. 540, 135 work in R and 225 work in Q.
The difference between the number of female employees working in department R in company B and the number of male employees working in department Q in company A = 135 - 120 = 15.
The number of male employees working in department P in company A is what percentage more than the number of female employees working in department Q in company B?
Solution
Ratio of Number of employees in A and B = 5:7 and total employees = 3600. This means that the number of employees in A and B = 1500 and 2100 respectively.
Males in A = 60% of 1500 = 900 and Females = 600. Ratio of males to females in B = 4:3 which means that males in B = 1200 and females in B = 900.
For Females in A, 30% work in Q i.e. 180, 20% of the remaining in R i.e. 84 and the remaining in P i.e. 336.
For males in A, 40% work in P i.e. 360, 2/9th of the remaining in Q i.e. 120 and the remaining in R i.e. 420.
For males in B, one third work in R i.e. 400, 1.25*400 i.e. 500 work in P and the remaining work in Q i.e. 300.
For females in B, 60% work in P i.e. 540, 135 work in R and 225 work in Q.
The required percentage = $$\frac{360-225}{225}\times\ 100\ =\ 60\%$.
The total number of female employees working in departments P and R in company A is what percentage of the total number of male employees working in departments P and Q in company B?
Solution
Ratio of Number of employees in A and B = 5:7 and total employees = 3600. This means that the number of employees in A and B = 1500 and 2100 respectively.
Males in A = 60% of 1500 = 900 and Females = 600. Ratio of males to females in B = 4:3 which means that males in B = 1200 and females in B = 900.
For Females in A, 30% work in Q i.e. 180, 20% of the remaining in R i.e. 84 and the remaining in P i.e. 336.
For males in A, 40% work in P i.e. 360, 2/9th of the remaining in Q i.e. 120 and the remaining in R i.e. 420.
For males in B, one third work in R i.e. 400, 1.25*400 i.e. 500 work in P and the remaining work in Q i.e. 300.
For females in B, 60% work in P i.e. 540, 135 work in R and 225 work in Q.
The required percentage = $$\frac{420}{800}\times\ 100\ =\ 52.5\%$$.
The average number of male employees working in department R in both the companies is $$x$$ and the average number of female employees working in department P in both the companies is y.The value of $$|x — y|$$ lies between:
Solution
Ratio of Number of employees in A and B = 5:7 and total employees = 3600. This means that the number of employees in A and B = 1500 and 2100 respectively.
Males in A = 60% of 1500 = 900 and Females = 600. Ratio of males to females in B = 4:3 which means that males in B = 1200 and females in B = 900.
For Females in A, 30% work in Q i.e. 180, 20% of the remaining in R i.e. 84 and the remaining in P i.e. 336.
For males in A, 40% work in P i.e. 360, 2/9th of the remaining in Q i.e. 120 and the remaining in R i.e. 420.
For males in B, one third work in R i.e. 400, 1.25*400 i.e. 500 work in P and the remaining work in Q i.e. 300.
For females in B, 60% work in P i.e. 540, 135 work in R and 225 work in Q.
Value of X = 400+420 / 2 = 410 and value of Y = 336+540/2 = 438.
So, |X-Y| = 28 i.e. Option D.
The given pie charts show the distribution of students studying different disciplines in an institute, in 2019 and 2021. The total number of students in 2021 is 20% more than that in 2019. Study the charts and answer the questions that follow.

The total number of students studying Computer Science and Commerce in 2019 is 50% more than the number of students in 2021 studying:
Solution
The required figure is given below:
Let the total number of students in 2019 be $$x$$.
Number of Commerce students = $$15\%\ of\ x=225$$ (given)
$$x=1500$$
Number of students in 2021 increased by 20% as compared to 2019.
Total number of students in 2021 = $$1500\times\left(1+20\%\right)=1800$$
In 2019,
Number of students in Computer Science = 21% of 1500 = 315
Number of students in Arts = 10% of 1500 = 150
Number of students in Science = 18% of 1500 = 270
Number of students in Engineering = 20% of 1500 = 300
Number of students in Management = 16% of 1500 = 240
Number of students in Commerce = 225 (given)
In 2021,
Number of students in Computer Science = 18% of 1800 = 324
Number of students in Arts = 12% of 1800 = 216
Number of students in Science = 15% of 1800 = 270
Number of students in Engineering = 25% of 1800 = 450
Number of students in Management = 20% of 1800 = 360
Number of students in Commerce = 10% of 1800 = 180
Total number of students studying Computer Science and Commerce in 2019 = 315 + 225 = 540
Let the number of students studying a particular subject in 2021 = $$x$$
Total number of students studying Computer Science and Commerce in 2019 is 50% more than the number of students studying a particular subject in 2021
Hence, $$x\times\left(1+50\%\right)=540$$
$$x=360$$
The required subject in 2021 is Management.
Hence, total number of students studying Computer Science and Commerce in 2019 is 50% more than the number of students studying Management in 2021.
$$\therefore\ $$ The required answer is D.
The total number of students studying Engineering and Science in 2021 is approximately what percentage more than the total number of students studying Management and Arts in 2019?
Solution
The required figure is given below:
Let the total number of students in 2019 be $$x$$.
Number of Commerce students = $$15\%\ of\ x=225$$ (given)
$$x=1500$$
Number of students in 2021 increased by 20% as compared to 2019.
Total number of students in 2021 = $$1500\times\left(1+20\%\right)=1800$$
In 2019,
Number of students in Computer Science = 21% of 1500 = 315
Number of students in Arts = 10% of 1500 = 150
Number of students in Science = 18% of 1500 = 270
Number of students in Engineering = 20% of 1500 = 300
Number of students in Management = 16% of 1500 = 240
Number of students in Commerce = 225 (given)
In 2021,
Number of students in Computer Science = 18% of 1800 = 324
Number of students in Arts = 12% of 1800 = 216
Number of students in Science = 15% of 1800 = 270
Number of students in Engineering = 25% of 1800 = 450
Number of students in Management = 20% of 1800 = 360
Number of students in Commerce = 10% of 1800 = 180
Total number of students studying Engineering and Science in 2021 = (450 + 270) = 720
Total number of students studying Management and Arts in 2019 = (240+150) = 390
Difference = 720 - 390 = 330
Percentage = $$\ \dfrac{330}{390}\times100=84.61\%$$
Hence, the number of students studying Engineering and Science in 2021 is 84.61% more than the number of students studying Management and Arts in 2019.
$$\therefore\ $$ The required answer is A.
The average number of students studying Engineering, Commerce and Arts in 2019 is what percentage less than the average number of students studying Management, Computer Science and Science in 2021? (Nearest to an integer)
Solution
The required figure is given below:
Let the total number of students in 2019 be $$x$$.
Number of Commerce students = $$15\%\ of\ x=225$$ (given)
$$x=1500$$
Number of students in 2021 increased by 20% as compared to 2019.
Total number of students in 2021 = $$1500\times\left(1+20\%\right)=1800$$
In 2019,
Number of students in Computer Science = 21% of 1500 = 315
Number of students in Arts = 10% of 1500 = 150
Number of students in Science = 18% of 1500 = 270
Number of students in Engineering = 20% of 1500 = 300
Number of students in Management = 16% of 1500 = 240
Number of students in Commerce = 225 (given)
In 2021,
Number of students in Computer Science = 18% of 1800 = 324
Number of students in Arts = 12% of 1800 = 216
Number of students in Science = 15% of 1800 = 270
Number of students in Engineering = 25% of 1800 = 450
Number of students in Management = 20% of 1800 = 360
Number of students in Commerce = 10% of 1800 = 180
Average number of students studying Engineering, Commerce and Arts in 2019 = $$\ \dfrac{300+225+150}{3}=225$$
Average number of students studying Management, Computer Science and Science in 2021 = $$\ \dfrac{360+324+270}{3}=318$$
Difference in the number of students = 318 - 225 = 93
Percentage difference = $$\ \dfrac{93}{318}\times100=29.24\%$$
Hence, the average number of students studying Engineering, Commerce and Arts in 2019 is 29.24% less than the the average number of students studying Management, Computer Science and Science in 2021.
$$\therefore\ $$ The required answer is C.
The ratio of males and females students studying Computer Science in 2019 is 3 : 4 and it is 7 : 5 for the students studying Management in the same year. 30% of the students studying Management in 2021 are females. The number of male students studying Management in 2021 is what percentage less than the total number of female students studying Computer Science and Management in 2019?
Solution
The required figure is given below:
Let the total number of students in 2019 be $$x$$.
Number of Commerce students = $$15\%\ of\ x=225$$ (given)
$$x=1500$$
Number of students in 2021 increased by 20% as compared to 2019.
Total number of students in 2021 = $$1500\times\left(1+20\%\right)=1800$$
In 2019,
Number of students in Computer Science = 21% of 1500 = 315
Number of students in Arts = 10% of 1500 = 150
Number of students in Science = 18% of 1500 = 270
Number of students in Engineering = 20% of 1500 = 300
Number of students in Management = 16% of 1500 = 240
Number of students in Commerce = 225 (given)
In 2021,
Number of students in Computer Science = 18% of 1800 = 324
Number of students in Arts = 12% of 1800 = 216
Number of students in Science = 15% of 1800 = 270
Number of students in Engineering = 25% of 1800 = 450
Number of students in Management = 20% of 1800 = 360
Number of students in Commerce = 10% of 1800 = 180
Let the number of male and female students in Computer Science in 2019 be $$3x$$ and $$4x$$ respectively.
Total number of students in Computer Science in 2019 = $$3x+4x=7x$$
Total number of students in Computer Science in 2019 = 315 (given)
$$7x=315$$
$$x=45$$
Number of male students in Computer Science in 2019 = $$\left(3\times x\right)=\left(3\times45\right)=135$$
Number of female students in Computer Science in 2019 = $$\left(4\times x\right)=\left(4\times45\right)=180$$
Let the number of male and female students in Management in 2019 be $$7x$$ and $$5x$$ respectively.
Total number of students in Management in 2019 = $$7x+5x=12x$$
Total number of students in Management in 2019 = 240 (given)
$$12x=240$$
$$x=20$$
Number of male students in Management in 2019 = $$\left(7\times x\right)=\left(7\times20\right)=140$$
Number of female students in Management in 2019 = $$\left(5\times x\right)=\left(5\times20\right)=100$$
Total number of students in Management in 2021 = 360
Number of female students = 30% of 360 = 108
Number of male students = 360 - 108 = 252
Number of male students in Management in 2021 = 252
Total number of female students in Computer Science and Management in 2019 = (180 + 100) = 280
Difference = 280 - 252 = 28
Percentage = $$\ \dfrac{28}{280}\times100\ =\ 10\%$$
Hence, the number of male students in Management in 2021 is 10% less than the total number of female students in Computer Science and Management is 2019.
$$\therefore\ $$ The required answer is C.
Study the given graph and answer the questions that follow.

$$Percent profit = \frac{Income - Expenditure}{Expenditure} \times 100$$
Profit = Income - Expenditure
In 2017, the expenditure (in ₹ crores) of company A was 250, and in 2019 the income (in ₹ crores) of company B was 350. What was the ratio of the income of company A in 2017 to the expenditure of company B in 2019?
Solution
Using the formula,
Income of company A in 2017 = 362.5 and Expenditures of Company B in 2019 = 250.
The required ratio = 362.5 : 250 = 29:20.
If the income of company B in 2016 was ₹420 crores, then its profit in (in ₹crores) in that year was:
Solution
Profit Percentage of Company B in 2016 = 40%
$$\frac{420\ -\ E}{E}\times\ 100\ =\ 40$$ where E is the expenditure of Company B in 2016.
This gives E = 300 and Profit = Income - E ==> 420 - 300 = 120.
If the expenditure of company B in 2018 is ₹300 crores and the income of company A in 2015 is ₹390 crores, then by what percentage was the profit of company B in 2018 more than that of company A in 2015
Solution
Profit percentage of B in 2018 is 45%,
Using the given formula for profit percentage and the given expenditure, we can find the income of B in 2018
$$\frac{Income-300}{300}=\frac{45}{100}$$
$$Income\ =\ 135+300=435\ crores$$
The profit by B in 2018 is $$435-300=135\ crores$$
Profit percentage of A in 2015 is 30%
Using the given formula for profit percentage and the given income, we can find the expenditure of A in 2015
$$\frac{390-Expenditure}{Expenditure}=\frac{30}{100}$$
$$3900-10Expenditure\ =\ 3Expenditure$$
$$Expenditure=300$$
The profit by A in 2015 is $$390-300=90$$
The ratio of B's profit to A's profit is $$\frac{135}{90}=\frac{3}{2}$$
Which means that B's profit is 150% of A's profit or B's profit is 50% more than A's profit.
Hence, Option B is the correct answer.
In 2020, if the total income of companies A and B was ₹534 crores and their expenditures were in the ratio 1 : 2, then what was the total expenditure (in ₹ crores) of the companies in that year?
Solution
Let the expenditure of A and B in 2020 be X and 2X respectively, where X is a constant.
We can see that the profit percent of A in 2020 is 35%
using the formula given for the profit percentage, we get $$\frac{I_A-X}{X}=0.35$$ {$$I_A$$ is the investment made by A}
= $$100I_A-100X=35X$$
=$$I_A=1.35X$$
We can also see that the profit percent of B in 2020 is 55%
Using the formula given for the profit percentage, we get $$\frac{I_B-2X}{2X}=0.55$$ {$$I_B$$ is the investment made by B}
$$10I_B-20X=11X$$
= $$I_B=3.1X$$
Total investment by A and B is 4.45X, which we know is equal to 534 crores, through this we get the value of X to be 120.
Thus, the total investment is 3X, which is $$3\times\ 120=360$$ crores
Therefore, option D is the correct answer.
Study the following information and answer the question:
In a college, there are 2400 students who are enrolled in any one of the five branches of engineering A, B, C, D and E. The ratio of the number of boys to that of girls is 7:5. 15% of the boys and 22% of the girls are enrolled in A. $$\frac{2}{7}$$ of the number of boys are enrolled in B. A total of 500 boys are enrolled in D and E and the ratio of the number of boys in D and that in E is 2 : 3. The remaining boys are enrolled in C.
26% of the total number of girls are enrolled in D and 120 girls enrolled in B. The number of girls enrolled in C is 100 more than the number of girls in E.
What is the difference between the numbers of boys enrolled in C and the number of girls enrolled in E?
Solution
We know that the ratio of the total number of Boys to Girls ratio is 7:5;
we also know that the total number of students is 2400.
Taking Boys and Girls to be 7x and 5x respectively, we get 12x = 2400, giving us x = 200
And hence, the total number of boys to be 1400 and the total number of girls to be 1000.
Next we're given that 15% of the boys are in section A, $$\frac{15}{100}\times\ 1400=210$$
And 22% of the girls are in section B, $$\frac{22}{100}\times\ 1000=220$$
Next, $$\frac{2}{7}$$ of the boys are in section B, $$\frac{2}{7}\times\ 1400\ =\ 400$$
We are also given that 500 boys are split between D and E in the ratio of 2:3, which would mean that D has 200 boys and E has 300 boys.
And the remaining boys are in Section C; the number of boys remaining are 290.
Next, we are given that 26% of the girls are in section D, that would mean that section d has 260 girls.
We are also given that section B has 120 girls.
The remaining girls must be split between section C and E, of which we know that C has 100 girls more than section E.
Taking the number of girls in section E to be x, we can calulculate these values as we know that 400 girls are yet to be place in any section,
giving us the equation $$2x+100=400$$
or simply $$x=150$$
which means that section E has 150 girls and Section C has 250 girls.
Our final data looks like this:
Section Boys Girls
A 210 220
B 400 120
C 290 250
D 200 260
E 300 150
The difference between the boys enrolled in C and girls enrolled in Section E is
=$$290-150$$
= 140
Hence, Option B is the correct answer.
The total number of girls enrolled in B and E is what percent less than the total number of boys enrolled in A and C?
Solution
We know that the ratio of the total number of Boys to Girls ratio is 7:5;
we also know that the total number of students is 2400.
Taking Boys and Girls to be 7x and 5x respectively, we get 12x = 2400, giving us x = 200
And hence, the total number of boys to be 1400 and the total number of girls to be 1000.
Next we're given that 15% of the boys are in section A, $$\frac{15}{100}\times\ 1400=210$$
And 22% of the girls are in section B, $$\frac{22}{100}\times\ 1000=220$$
Next, $$\frac{2}{7}$$ of the boys are in section B, $$\frac{2}{7}\times\ 1400\ =\ 400$$
We are also given that 500 boys are split between D and E in the ratio of 2:3, which would mean that D has 200 boys and E has 300 boys.
And the remaining boys are in Section C; the number of boys remaining are 290.
Next, we are given that 26% of the girls are in section D, that would mean that section d has 260 girls.
We are also given that section B has 120 girls.
The remaining girls must be split between section C and E, of which we know that C has 100 girls more than section E.
Taking the number of girls in section E to be x, we can calulculate these values as we know that 400 girls are yet to be place in any section,
giving us the equation $$2x+100=400$$
or simply $$x=150$$
which means that section E has 150 girls and Section C has 250 girls.
Our final data looks like this:
Section Boys Girls
A 210 220
B 400 120
C 290 250
D 200 260
E 300 150
Total number of Girls in B & E = $$120+150=270$$
Total number of Boys in A & C = $$210+290=500$$
Ratio of the C&E girls to A&C boys is $$\frac{270}{500}=\ 0.54$$
Which means that there are 46% less girls in C&E than the boys in A&C.
Therefore, Option B is the correct answer.
The total number of boys and girls enrolled in D is what percent of the total number of girls enrolled in A, C and E? (Correct to one decimal point)
Solution
We know that the ratio of the total number of Boys to Girls ratio is 7:5;
we also know that the total number of students is 2400.
Taking Boys and Girls to be 7x and 5x respectively, we get 12x = 2400, giving us x = 200
And hence, the total number of boys to be 1400 and the total number of girls to be 1000.
Next we're given that 15% of the boys are in section A, $$\frac{15}{100}\times\ 1400=210$$
And 22% of the girls are in section B, $$\frac{22}{100}\times\ 1000=220$$
Next, $$\frac{2}{7}$$ of the boys are in section B, $$\frac{2}{7}\times\ 1400\ =\ 400$$
We are also given that 500 boys are split between D and E in the ratio of 2:3, which would mean that D has 200 boys and E has 300 boys.
And the remaining boys are in Section C; the number of boys remaining are 290.
Next, we are given that 26% of the girls are in section D, that would mean that section d has 260 girls.
We are also given that section B has 120 girls.
The remaining girls must be split between section C and E, of which we know that C has 100 girls more than section E.
Taking the number of girls in section E to be x, we can calulculate these values as we know that 400 girls are yet to be place in any section,
giving us the equation $$2x+100=400$$
or simply $$x=150$$
which means that section E has 150 girls and Section C has 250 girls.
Our final data looks like this:
Section Boys Girls
A 210 220
B 400 120
C 290 250
D 200 260
E 300 150
Total number of boys and girls in section D is $$200+260=460$$
Total number of girls in A, C and E is $$220+250+150=620$$
The required percentage would be $$\frac{460}{620}\times\ 100=74.19$$%
Correcting this to one decimal place would give us 74.2%
Therefore, option A is the correct answer.
The difference between the total number of boys enrolled in B and C and the total number of girls enrolled in A and D is x. The total number of boys and girls enrolled in E is y. The x is what percent less than y? (Nearest to an integer)
Solution
We know that the ratio of the total number of Boys to Girls ratio is 7:5;
we also know that the total number of students is 2400.
Taking Boys and Girls to be 7x and 5x respectively, we get 12x = 2400, giving us x = 200
And hence, the total number of boys to be 1400 and the total number of girls to be 1000.
Next we're given that 15% of the boys are in section A, $$\frac{15}{100}\times\ 1400=210$$
And 22% of the girls are in section B, $$\frac{22}{100}\times\ 1000=220$$
Next, $$\frac{2}{7}$$ of the boys are in section B, $$\frac{2}{7}\times\ 1400\ =\ 400$$
We are also given that 500 boys are split between D and E in the ratio of 2:3, which would mean that D has 200 boys and E has 300 boys.
And the remaining boys are in Section C; the number of boys remaining are 290.
Next, we are given that 26% of the girls are in section D, that would mean that section d has 260 girls.
We are also given that section B has 120 girls.
The remaining girls must be split between section C and E, of which we know that C has 100 girls more than section E.
Taking the number of girls in section E to be x, we can calulculate these values as we know that 400 girls are yet to be place in any section,
giving us the equation $$2x+100=400$$
or simply $$x=150$$
which means that section E has 150 girls and Section C has 250 girls.
Our final data looks like this:
Section Boys Girls
A 210 220
B 400 120
C 290 250
D 200 260
E 300 150
Total number of boys in B&C = $$400+290=690$$
Total number of girls in A&D = $$220+260=480$$
The difference is x=$$690-480=210$$
Total number of boys and girls in E, y=$$300+150=450$$
The difference between x and y is $$450-210=240$$
This is $$\frac{240}{450}\times\ 100\ =\ 53.33\ \%\ $$ of y.
Rounding it to the nearest integer gives us that x is 53% smaller than y.
Therefore, Option D would be the correct answer.
The given table shows the production of foodgrains A, B and C and their export (as a percentage of production) over five years from 2015 to 2019, Study the table and answer the questions that follow.
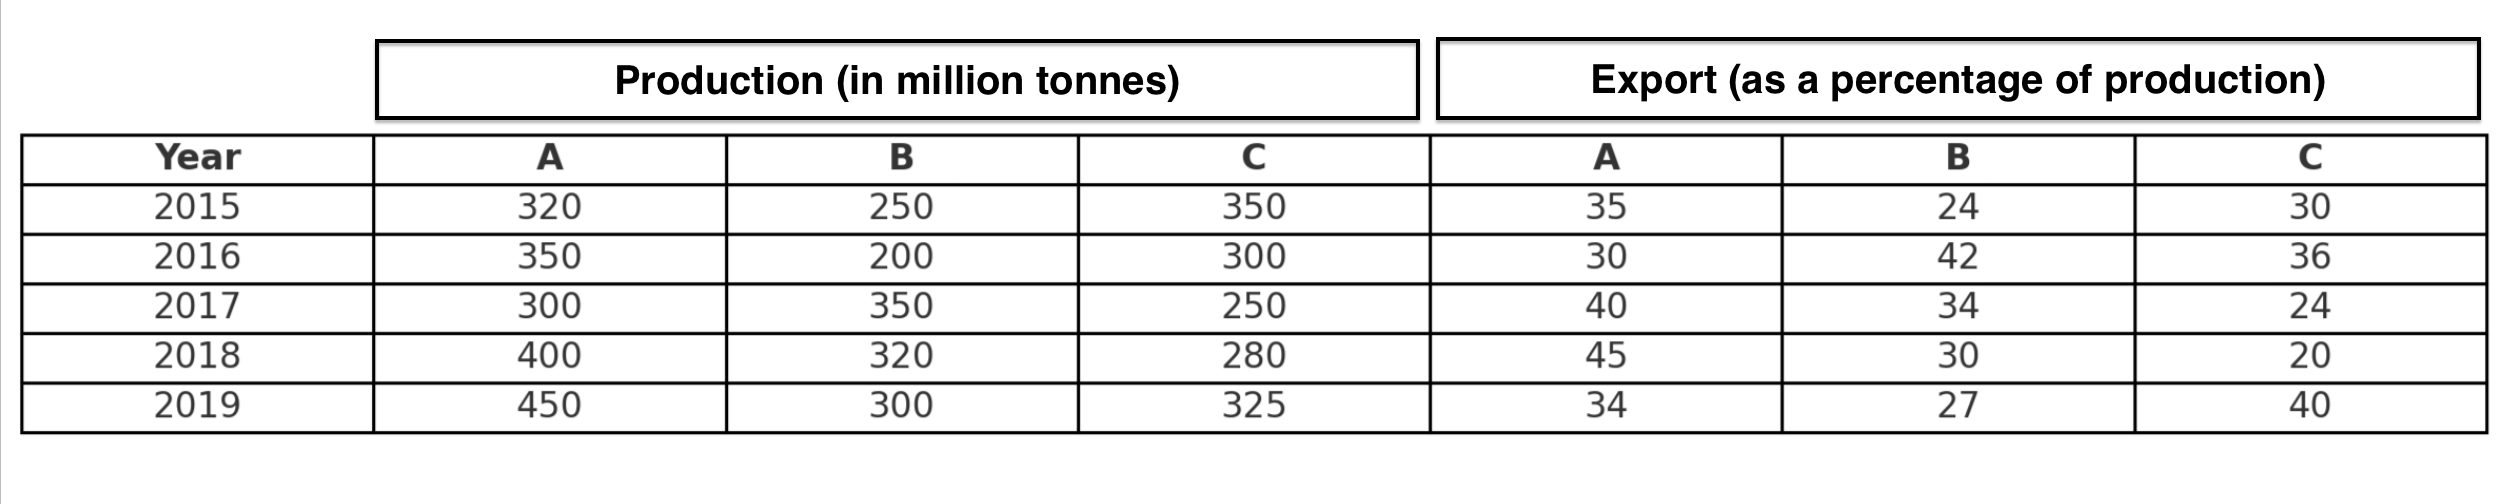
Production = Domestic Consumption + Export
What is the ratio of the total export of foodgrain A in 2015, 2016 and 2019 to the total export of foodgrain B in 2016 to 2019?
Solution
Export of A in 2015, 2016, 2019 are
$$320\times\ 0.35=112$$
$$350\times\ 0.30=105$$
$$450\times\ 0.34=153$$
Total : 370
Export of B from 2016 to 2019:
$$200\times\ 0.42=84$$
$$350\times\ 0.34=119$$
$$320\times\ 0.30=96$$
$$300\times\ 0.27=81$$
Total : 308
Their ratio = $$\frac{370}{380}=37:38$$
Hence, Option A is the correct answer.
The average production of foodgrain B in 2016, 2017 and 2018 is approximately what percentage of the total domestic consumption of foodgrain C in 2015 and 2019?
Solution
B's average production in 2016, 2017 and 2018 is $$\frac{200+350+320}{3}=\frac{870}{3}=290$$
C's Domestic produce in 2015 and 2019 = $$350\times\ \frac{70}{100}(=245)$$ and $$325\times\ \frac{60}{100}(=195)$$
=$$440$$
The required percentage is $$\frac{290}{440}\times\ 100=65.9\%$$
The closest approximation go this would be 66% and hence, option c.
The total export of foodgrain A in 2017 and 2018 is what percentage Less than the total domestic consumption of foodgrain B in 2017 and 2019?
Solution
A's export in 2017 = $$300\times\ \frac{40}{100}=120$$
A's export in 2018 = $$400\times\ \frac{45}{100}=180$$
A's total export in 2017 + 2018 = 300
B's domestic production in 2017 = $$350\times\ \frac{66}{100}=231$$
B's domestic production in 2019 = $$300\times\ \frac{73}{100}=219$$
B's total domestic produce in 2017 + 2019 = 450
A's export is 150 million tonnes less than the B's domestic produce.
The percentage required = $$\frac{150}{450}\times\ 100=33.33\%$$
Therefore, option C is the correct answer.
In 2020, the production of foodgrain A increased over 2019 by the same percentage as in 2019 over 2018, and the production of foodgrain C in 2020 increased by 35% over 2019. If the export of both foodgrains was 40% of their respective production in 2020, then what was the total domestic consumption (in million tonnes) of these two foodgrains in that year?
Solution
The percentage increase in the production of foodgrain A in 2019 over 2018 will be $$\dfrac{450-400}{400}\times 100 = \dfrac{100}{8}\%$$
Therefore, the production of foodgrain A in 2020 over 2019 will be $$450\times \left(1+\dfrac{100}{800}\right)= 506.25$$
And the total Exports will be $$506.25\times \dfrac{40}{100} = 202.5$$
And the Domestic consumption will be $$506.25-202.5=303.75$$
The production of foodgrain C in 2020 will be $$325\times \left(1+\dfrac{35}{100}\right)= 438.75$$
And the total Exports will be $$438.75\times \dfrac{40}{100} = 175.5$$
And the Domestic consumption will be $$438.75-175.5= 263.25$$
Therefore, the total Domestic consumption for A and C in 2020 will be $$263.25+303.75 = 567$$
The given charts show the distribution of IT employees who were enrolled for Certification exam and the employees (out of those enrolled) who passed the Certification exam from different centres. Study the charts and answer the questions that follow.

What percentage of the employees passed the Certification Exam from centres E, F and G out of the total number of employees enrolled from the same centre?
Solution
Out of the total Employees enrolled, E, F and G had total share of 8+12+16 = 36%
So the total number of employess enrolled from these three were, $$0.36\times\ 23550$$
Of all the employees who passed the exam, E, F, and G had a total share of 9+15+12 = 36%
So the total number of employees who passed from these three were, $$0.36\times\ 3700$$
Therefore the percentage of employees who passed from E, F and G were $$\frac{0.36\times\ 3700}{0.36\times\ 233550}\times\ 100=15.711\%$$
Find the difference between the number of employees enrolled from centres E and C together and the number of employees who passed from centres D and A together.
Solution
Number of employees who enrolled from E and C were, 8+10= 18% of 23550
Which is equal to 4,239
Number of employees who passed from D and A were, 16 + 18 = 34% of 3700
Which is equal to 1,258
The difference would be 4239-1258 = 2981
Therefore, Option A would be the correct answer.
Which of the following centres has the highest percentage of the employees passed to the employees enrolled?
Solution
Since the values are given as percentages of the same numbers and we only have to find the highest and not the exact values, we can find the ratio between all of the options and see which is the highest value.
C: 13% of passed/ 10% of enrolled
F: 15% of passed/ 12% of enrolled
B: 17% of passed/ 16% of enrolled
E: 9% of passed/ 8% of enrolled
we can take passed/enrolled as constant K since they are same in all of the calculations, this would give us
C: 1.3 K
F: 1.25 K
B: 1.0625 K
E: 1.125 K
As we can see, C has the highest percentage of employees passed to enrolled ratio.
What is the ratio of the number of employees enrolled from centres A and E together to the number of employees passed from centres A and G together?
Solution
The number of employees enrolled from A and E together are : 22+8 = 30% of 23550
The number of employees passed from A and G together are: 18+12 = 30% of 3700
The required ratio is $$\frac{23550}{3700}=\frac{471}{74}$$
Therefore, Option D is the correct answer.
The given graphs and chart show the products list prices and net prices of ABC Pt Ltd, from 2013 to 2020. Study the information and answer the questions that follow.

For the period 2013-2020 if x is the numerical value of percentage increase/decrease in the average value of the products list price in the fist four years as compared to the average value of the products list price in the last four years and y is the numerical value of percentage increase/decrease in the average value of the products net price in the 15 four years as compared to the average value of the products net price in the last four years, Calculate the value of $$\sqrt{3x+19y}$$.
Solution
Average list price of the first four years: $$\frac{3+6+8+7}{4}=6$$
Average list price of the last four years: $$\frac{5+9+8+10}{4}=8$$
Increase = 2
percentage increase : $$\frac{2}{6}\times\ 100=\frac{100}{3}$$ {x}
Average net price of the first four years: $$\frac{2000+5000+7000+5000}{4}=\frac{19000}{4}$$
Average net price of the last four years: $$\frac{3000+6000+5000+8000}{4}=\frac{22000}{4}$$
Increase = $$\frac{3000}{4}$$
Percentage increase: $$\frac{3000}{4}\times\ \frac{4}{19000}\times\ 100=\frac{300}{19}$$ {y}
Putting these values in the given term we get:
$$\sqrt{\left(\ 3\times\ \frac{100}{3}\right)+\left(19\times\ \frac{300}{19}\right)}$$
$$\sqrt{\ 400}=20$$
Therefore, Option A is the correct answer.
If the ratio of sum of products net prices in 2015, 2016 and 2017 to products list price in 2017 is $$\left(5+\frac{1}{p}+\frac{1}{p^{2}}\right) \frac{75}{131} : 1$$ then calculate the value of P.
Solution
The question had an error in the original question paper, where the ratio $$\left(5+\frac{1}{p}+\frac{1}{p^{2}}\right) \frac{75}{131} : 1$$ was given as $$5\left(5+\frac{1}{p}+\frac{1}{p^{2}}\right) \frac{75}{131} : 1$$.
The sum of the product's net prices in 2015, 2016 and 2017 is $$7000+5000+3000=15000$$ million
The products list price in year 2017 is 5 billion, which is equivalent to 5000 million.
The ratio of the sum of net prices to the list price would be 15000:5000 = 3:1
Equating this with the ratio we are given, we get
$$\left(5+\frac{1}{p}+\frac{1}{p^2}\right)\ \frac{75}{131}:1\ =\ 3:1$$
$$\frac{\left(5p^2+p+1\right)}{p^2}\times\ \frac{75}{131}=3$$
131 is a prime number and in order to cancel it out from the denominator, we would require 131 in the numerator as well.
At this point, we can try putting in the options to see if we can get 131 in the numberator.
putting p=5, we get $$\left(5(5)^2+(5)+1\right)$$ as 131
Using 5 as the value of p, we get:
$$\ \frac{131}{25}\times\ \frac{75}{131}=3$$
Therefore, Option C is the correct answer.
Which of the following statements are true based on the data in the graphs and chart?
A) The list price of routers in 2020 exceeded the total products' list prices in 2013
B) The net price for the year in which the net price was the greatest was more than the list price for the year in which the list price was the lowest.
C) If in 2020, the list price of routers had been 10% less, and the list price of switches had been 10% greater, the list price of routers would have been less than the list price of switches.
Solution
(A) In 2020, The list price was 8000 Million or 8 Billion, which is more than the total list price in 2013.
Therefore, statement A is correct.
(B) The highest net price was in year 2020 of 8000 Million or 8 Billion while the lowest list price was in year 2013 of 3 Billion.
Therefore, statement B is correct.
(C) Let's take the total market to be of 100 price units. 25 price units were from routers and 15 price units were from switches. After decreasing the router's price by 10% is comes down to 22.5 units and increasing the switches prices by 10% it come sup to 16.5%
The routers are still higher than the switches, therefore, statement C is incorrect.
If x is the average (arithmetic mean) of the product's net prices of ABC Pvt Ltd for the period 2013-2020, then calculate the difference between the average (arithmetic mean) of the products' net price greater than x and the average of the products' net price less than x for the period 2013-2020?
Solution
The average product net price would be: $$\frac{2000+5000+7000+5000+3000+6000+5000+8000}{8}=5125$$
The average of product prices less than this average price:
$$\frac{2000+5000+5000+3000+5000}{5}=4000$$
The average product price greater than this average price would be:
$$\frac{7000+6000+8000}{3}=7000$$
The difference between these two averages would be 7000 - 4000 = 3000 million dollars.
Hence, Option C is the correct answer.
The given graph shows the performance of the students of schools A, B, C, D, E and F in a Board Examination. Study the graph and answer the questions that follow.

In which of the following pairs of schools is the percentage of students who passed without distinction to those who appeared the same?
Solution
After reading the chart, we can get the data:
School Total Passed Distinction Without distinction
A 800 640 300 340
B 1050 840 350 490
C 1200 920 450 470
D 750 600 260 340
E 900 750 330 420
F 1500 1000 450 550
Finding the percentage of students who passed without distinction to the total number of students who appeared we get:
A = $$\frac{340}{800}\times\ 100=42.5\%$$
B = $$\frac{490}{1050}\times\ 100=46.67\%$$
C = $$\frac{470}{1200}\times\ 100=39.1667\%$$
D = $$\frac{340}{750}\times\ 100=45.33\%$$
E = $$\frac{420}{900}\times\ 100=46.667\%$$
F = $$\frac{550}{1500}\times\ 100=36.67\%$$
We can see that B and E have the same percentage which aligns with option B.
Therefore, Option B will be the correct answer.
In which of the following schools is the number students who passed with distinction as a percentage of those students who failed the least?
Solution
For this part, we will also have to calculate the number of students who failed in each school.
adding that to our previous data table we get:
School Total Passed Distinction Without distinction Failed
A 800 640 300 340 160
B 1050 840 350 490 210
C 1200 920 450 470 280
D 750 600 260 340 150
E 900 750 330 420 150
F 1500 1000 450 550 500
Calculating the students who passed with distinction as a percentage of students who failed for the given options we see,
Option A: $$\frac{470}{280}\times\ 100\approx\ 170\%$$
Option B: $$\frac{420}{150}\times\ 100\approx\ 280\%$$
Option C: $$\frac{490}{210}\times\ 100\approx\ 230\%$$
Option D: $$\frac{550}{500}\times\ 100\approx\ 110\%$$
We can see that Option D or School F has the least percentage in this category.
Therefore, Option D is the correct answer.
The average number of students (per school) who failed in schools A, B C and E is approximately what percentage less than the number of students who passed without distinction in school D?
Solution
School Total Passed Distinction Without distinction Failed
A 800 640 300 340 160
B 1050 840 350 490 210
C 1200 920 450 470 280
D 750 600 260 340 150
E 900 750 330 420 150
F 1500 1000 450 550 500
Using our collected data, we can easily calculate the average number of students who failed in A, B, C and E to be $$(160+210+280+150)/4=800/4=200$$
The number of students who passed without distinction is 340.
Ratio of these two values is $$\frac{200}{340}=0.588$$
Which means that the average number of students who failed in A, B, C and E is 41.176% smaller than the number of students who passed without distinction in D.
This is approximately 41%.
Therefore, Option A is the correct answer.
The ratio of boys and girls who passed from school B is 3 : 4 and it is 11 : 12 for the students who passed from school C. The total number of students who passed with distinction from schools D, E and F is what percentage more than the total number of boys who passed from school B and C?
Solution
School Total Passed Distinction Without distinction Failed
A 800 640 300 340 160
B 1050 840 350 490 210
C 1200 920 450 470 280
D 750 600 260 340 150
E 900 750 330 420 150
F 1500 1000 450 550 500
We are given that the 840 students who passed in B, the boy to girl ratio is 3:4, which gives us 360 boys and 480 girls in B.
Similarly, we are given that of the 920 students who passed in C, the boy to girl ratio is 11:12, which gives us 440 boys and 480 girls in C.
And now we can calculate the total number of boys who passed from B and C, 800 boys.
Next. the total number of students who passed with distinction from D, E and F are $$260+330+450=1040$$
the ratio of these students to the boys from B&C is $$\frac{1040}{800}=1.3$$
Which tells us that there are 30% more students who passed with distinction from D,E and F when compared to the number of boys from B&C.
Therefore, Option B is the correct answer.
The given table shows the number of seats reserved in different classes in a train on six days of a week. The number of seats available in each class is given in brackets. Study the table and answer the questions that follow.

If the data related to vacant seats for AC II Tier on the given six days is represented by a pie chart, then what is the difference (in degrees) between the central angles of the sectors representing vacant seats in these classes on Thursday and Monday?
Solution
Upon calculating the number of vacant seats on every day of the week, we get the data.

The total number of seats vacant throughout the week would be 630.
In making a pie chart, these 630 seats would encompass 360 degrees. So the number of degrees per seat would be $$\frac{360}{630}$$
Monday will have $$\frac{360}{630}\times\ 105\ =\ 60$$ degrees
Thursday will have $$\frac{360}{630}\times\ 140\ =\ 80$$ degrees
The difference between the angles covered by Monday and Thursday will be 20 degrees.
Hence, Option D is the correct answer.
The total vacant seats in all the given five classes on Wednesday is what percentage less than the total vacant seats in $$2^{nd}$$ Class Non-AC on Monday, Tuesday and Friday? (Correct to one decimal place)
Solution
Calculating the 2nd class non-Ac vacant seat data and Wednesday's vacant seat data, we get

Calculating the 2nd Non-AC vacant seats on Monday, Tuesday and Friday, we get, $$210+180+150=540$$
Vacant seats on Wednesday are, $$60+120+140+125+35=480$$
The percentage can be calculated as,
$$Percentage\ =\ \dfrac{\left(540\ -\ 480\right)}{540}\ \times\ 100\ =\ \dfrac{60}{540}\ \times\ 100\ =\ \dfrac{100}{9}\ =\ 11.1\%$$
Therefore, option A is correct.
The total vacant seats in AC $$1^{st}$$ Class on all the given six days is what percentage of the average number of reserved seats in 2 Class Non-AC on Wednesday and Saturday?
Solution
Calculating the vacant seats in AC Tier I class, gives us the data

Average number of reserved seats in 2nd Class Non-Ac on Wednesday and Saturday is $$\frac{\left(840+760\right)}{2}=800$$
Total number of vacant seats in AC I tier are $$50+30+35+25+20+12=172$$
The required percentage is $$\frac{172}{800}\times\ 100=21.5\%$$
Therefore, Option A is the correct answer.
The difference between the total vacant seats in all the five classes on Thursday and the total vacant seats in AC III Tier on all the given six days is approximately what percentage of the total reserved seats in the Non-AC Classes on Thursday and Saturday?
Solution
Calculating vacant seats on Thursday and AC III gives us the data,

Total Vacant seats on Thursday are: $$100+40+80+140+25=385$$
Total vacant seats in AC III are: $$160+90+140+80+150+120=740$$
The difference between them; $$740-385=355$$
Total reserved seats in Non-Ac on Thursday and Saturday are; $$800+360+760+320=2240$$
The required percentage is $$\frac{355}{2240}\times\ 100\approx\ 15.8\%$$
Therefore, Option B is the correct answer.
foodgrains exported, from 2016 to 2020. Study the graph and answer the questions that follow.


In which year was the total export (in million tonnes) of wheat and rice between 200 and 225?
Solution
Checking the Export for all of the options we see:
Option A: 2017
Wheat Export - 40% of 180 = 72
Rice Export - 28% of 200 = 56
Total Export - 128
Option B: 2019
Wheat Export - 35% of 320 = 112
Rice Export - 48% of 300 = 144
Total Export - 256
Option C: 2020
Wheat Export - 30% of 360 = 108
Rice Export - 40% of 280 = 112
Total Export - 220
Option D: 2018
Wheat Export - 45% of 240 = 108
Rice Export - 32% of 250 = 80
Total Export - 188
As we can see, only option C satisfies our condition.
Therefore, Option C is the correct answer.
The total domestic consumption of rice in 2017 and 2019 was what percentage more than the total exports of wheat in 2016, 2017 and 2020? (Correct to one decimal place)
Solution
Total Domestic consumption of Rice in 2017: 72% of 200 = 144
Total Domestic consumption of Rice in 2019: 52% of 300 = 156
Adding them up we get, 300 million tonnes.
Exports of wheat in 2016, 2017 and 2020 are
$$\left(32\%\ of\ 250\right)+\left(40\%\ of\ 180\right)+\left(30\%\ of\ 360\right)$$
= $$80+72+108$$
= $$260\ $$ million tonnes
Calculating the domestic rice consumption to the wheat export we get, $$\frac{300}{260}=\ 1.1538$$
Which means the domestic consumption is 15.38% higher.
Rounding it to one decimal place gives us, 15.4%
Hence, option C is the correct answer.
The domestic consumption of rice in 2019 was what percentage of the average production of wheat (per year) in 2017, 2018 and 2020?
Solution
Domestic consumption of rice in 2019: $$0.52\times\ 300\ =\ 156$$ million tonnes.
Average production of wheat in 2017, 2018 and 2020 is:
$$\frac{\left(180+240+360\right)}{3}=\ \frac{780}{3}=260$$ million tonnes.
Domestic consumption of rice in 2019 as a percentage of average production of wheat in 2017, 2018 and 2020 is $$\frac{156}{260}=0.6$$;
Which is equivalent to 60%
Therefore, Option D is the correct answer.
In 2021, the production of wheat increased over 2020 by the same percentage as in 2020 over 2019, and the export of wheat was 40%. The production of rice in 2021 increased by 20% and its export was the same as in 2020.What was the difference (in million tonnes) between the domestic consumption of wheat and rice in 2021?
Solution
Increase of Wheat production from 2019 to 2020: $$\frac{36-32}{32}\times\ 100=12.5\%$$
Wheat production in 2021: $$360\times\ 1.125$$ = 405
The domestic consumption would be $$60\%\ of\ 405$$
Rice production in 2021: $$280\times\ \frac{6}{5}=336$$
Domestic consumption would be $$60\%\ of\ 336$$
The difference between them would be :
= $$60\%\ of\ 405$$ - $$60\%\ of\ 336$$
=$$\frac{3}{5}\times\ \left(405-336\right)=\frac{3}{5}\times\ 69=\frac{207}{5}=41.4$$
Therefore, Option A is the correct answer.
For the following questions answer them individually
Two students X and Y are best friends. They sit randomly in a row of 9 seats with 7 other friends to watch a movie. What is the probability that the friends sit together?
Solution
Taking X and Y as one pair, we can have 8 people on 8 seats. These 8 elements can be seated in 8! ways and X and Y can be seated in 2! ways. Therefore, the total number of ways X and Y can be seated together are 2!8!
Total number of ways 9 people can be seated is 9!
The probability that X and Y will be seated together is $$\frac{2!8!}{9!}=2\times\ \frac{8!}{9\times\ 8!}=\frac{2}{9}$$
Therefore, Option C is the correct answer.
Suppose the equations $$3x^{2} — 7x + k = 0$$ and $$—7x^{2} + kx + 3 = 0$$ have a common root, then the value of $$k$$ is:
Solution
The simplest way to solve this question would be through the options.
Option A: $$3x^{2} — 7x + k = 0$$ and $$—7x^{2} + kx + 3 = 0$$ on putting k= 3 becomes,
$$3x^{2} — 7x + 3 = 0$$ and $$—7x^{2} + 3x + 3 = 0$$
Where we can not calculate the roots by factorisation.
Option B: $$3x^{2} — 7x + k = 0$$ and $$—7x^{2} + kx + 3 = 0$$ on putting k= 6 becomes,
$$3x^{2} — 7x + 6 = 0$$ and $$—7x^{2} + 6x + 3 = 0$$
Where again,we can not calculate the roots by factorisation.
Option C: $$3x^{2} — 7x + k = 0$$ and $$—7x^{2} + kx + 3 = 0$$ on putting k= 4 becomes,
$$3x^{2} — 7x + 4 = 0$$ and $$—7x^{2} + 4x + 3 = 0$$
Where the first equation has roots 1 and 4/3 and the second equation has roots 1 and 3/7
Option D: $$3x^{2} — 7x + k = 0$$ and $$—7x^{2} + kx + 3 = 0$$ on putting k = 2 becomes,
$$3x^{2} — 7x + 2 = 0$$ and $$—7x^{2} + 2x + 3 = 0$$
Where the first equation has roots 2 and 1/3 but for the second equation, we can not calculate the roots by factorisation.
We can see that option C gives us one common root, hence, that would be our answer.
$$8^{}- 5^{17} \times 2^{20}$$ is divided by - 9 then what is the remainder?
Solution
We can find the remainder on dividing by 9 and then find the negative remainder in order to find the reminder we would have gotten on dividing by -9.
$$\left[\frac{8-5^{17}\times\ 2^{20}}{9}\right]_R$$
$$\left[\frac{8}{9}\right]_R-\left[\frac{5^{17}\times\ 2^{17}\times\ 2^3}{9}\right]_R$$
$$-1-\left[\frac{10^{17}}{9}\right]_R\times\ \left[\frac{8}{9}\right]_R$$
$$-1-1^{17}\times\ \left(-1\right)$$
$$-1+1\ =\ 0$$
Upon reversing the sign to calculate the remainder on dividing it by -9, we get 0 again.
Hence, the remainder is 0.
Let the quotient be f(x) when $$5x^{4} —3x^{3} + 2x^{2} — 1$$ is divided by $$x^{2} + 4$$, the remainder be g(x) when $$2x^{3} — x + 1$$ with $$x^{2} + x + 1$$. The remainder when f(x) is divisible by g(x)
Solution
When $$5x^4-3x^3+2x^2-1\ $$ is divided by $$x^2+4$$, the quotient is $$5x^2-3x-18$$ and the remainder is $$12x+71$$
Here we are asked to take the quotient as f(x);
f(x) = $$5x^2-3x-18$$
When $$2x^3-x+1$$ is divided by $$x^2+x+1$$ the quotient is $$2x-2$$ and the remainder is $$-x+3$$
Here we are asked to take the remainder as g(x);
g(x) = $$-x+3$$
We are to find the remainder when f(x) is divided by g(x)
Upon dividing we would get the quotient as -5x-12 and the remainder is 18.
Hence, Option B is thee correct answer.
Read the given statements and select the most appropriate option
Statement-I: If the sum of remainders obtained when 3864335 divisible by 382 and 300 is twice the remainder when a least four-digit number is divisible by 32, then that number is 1021
Statement-II: 45!-1 is a prime number.
Solution
Statement 1:
Remainder of 3864335 when divided by 300 is a short calculation and gives us the remainder as 35.
Remainder of 3864335 when divided by 382 is lengthy but after dividing the remainder would be 23.
Sum of these remainders is 58, this is twice of the remainder we get on dividing the unknown number by 32;
This remainder would be 29
We now have to check the remainder when 1021 is divided by 32,
1024 is $$32^2$$, so $$\left[\frac{1024}{32}\right]_R=-3=\ 29$$
And hence, we can confirm that statement 1 is correct.
Statement 2: According to Wilson's theorem,
$$\left[\frac{\left(p-2\right)!}{p}\right]_R=1$$ where P is a prime number.
Taking P =47 we get, $$\left[\frac{45!}{47}\right]_R=1$$ and subtracting 1 from this would mean that 45!-1 is divisible by 47.
Therefore, Statement II is incorrect.
SUPPOSE $$M_{(base-n)}$$ Means m is a number in base-n system. It for $$a > b, a_{(base-10)} + b_{(base-10)} = 20_{(base-3)}$$ and $$a^{2}_{(base-10)} + b^{2}_{(base-10)} = 202_{(base-3)}$$, then what are $$a_{(base-3)}$$ and $$b_{(base-3)}$$?
Solution
We need to first convert $$20_{\left(base-3\right)}$$ and $$202_{\left(base-3\right)}$$ into decimal system so as to get the values of a and b in the decimal system.
20 in 10 base system would be : $$\left(2\times\ 3^1\right)+\left(0\times\ 3^0\right)$$ = 6
202 in 10 base system would be : $$\left(2\times\ 3^2\right)+\left(0\times\ 3^1\right)+\left(2\times\ 3^0\right)=20$$
so a+b = 6 and $$a^2+b^2=20$$
From this we get, ab = 8
Trying out different values we can get the values of a and b to be 4 and 2
converting these from decimal to 3 base system we get 2 as 2 only and 4 as $$\left(1\times\ 3^1\right)+\left(1\times\ 3^0\right)$$ = $$11_{\left(base-3\right)}$$
Therefore, Option A is the correct answer.
From his house, David walks 70 steps forward to the East then without reversing his back, he walks 30 steps backward. Then he reverses his back and walks 20 steps forward. What is the distance (in feet) between his final position and his house if one step measures 2 feet?
Solution
David faces east and walks 70 steps in the east direction.
After this, without turning his back, David walks 30 steps in reverse direction. Landing him 40 steps east of the starting point, facing eastwards.
After this he reverses his back, and is now facing west towards his starting point. He then walk 20 steps in the direction he is facing i.e, 20 steps towards the starting point. Making his final position 20 steps east of the starting point.
1 step measures 2 feet, so 20 steps would measure 40 meters.
Therefore, David is 40 meters east of the starting point.
Hence, Option C is the correct answer.
A cubic room, with lateral surface area 2304 $$m^{2}$$ is to be divided into 4 m wide small rooms, by inserting plywood sheets in the room. To minimise the expenditure on purchase of these sheets, how many such sheets will be required to construct maximum number of such small rooms, if the length and the height of the small rooms remains same as that of the cubic room?
Solution
Lateral surface area of a cube is $$4a^2$$, where a is the side length.
We are given that the lateral surface area is 2304, solving this for a, we get
$$a^2=576$$
$$a=24$$
Now we need to divide this cubic room which is of 24 m side length, in small 4m wide rooms which have the same length and height.
For this we will be placing plywood parallel to the height of the room and a distance of 4 meters.
The room will be divided in 6 small rooms of 4 meter width and for this we would require 5 plywood sheets.
The number of segments is 1 + the number of cuts made.
{Since, the length of the room is close is the the width section we want to divide the room in, we can count the number of plywood sheets we would need by drawing a rough sketch. But it is recommended to know such common logical reasoning solutions.}
Therefore, the correct answer would be Option D.
If $$x^{2} — 4y^{2} — x + \lambda y — 2 = 0$$ is to represent a pair of straight lines, then the product of the possible values of $$\lambda$$ is
Solution
Suppose we have two lines $$a_1x+b_1y+c_1=0$$ and $$a_2x+b_2y+c_2=0$$
The equation of pair of these two equations would be obtained by multiplying these two equations,
Giving us, $$a_1a_2x^2+b_1b_2y^2+x\left(a_1c_2+a_2c_1\right)+y\left(b_1c_2+b_2c_1\right)+xy\left(a_1b_2+a_2b_1\right)+c_1c_2=0$$
Comparing this with the equation we have, we can start finding the values,
$$a_1=a_2=1$$
From coefficient of x, we get $$c_1+c_2=-1$$
From the constant in the equation we get, $$c_1c_2=-2$$
The value of $$c_{1\ }and\ c_2$$ in some order must be -2 and 1
From coefficient of xy, we get $$b_2=-b_1$$
And through coefficient of $$y^2$$, we get that $$b_{1\ }or\ b_2=\pm\ 2$$
Since the coefficients of x are equal in both the equations, b becomes the only differentiating point.
The equations will therefore now be,
$$x+2y+c_1=0$$ and $$x-2y+c_2=0$$
Where we can have two case:
Case 1: $$c_1=-2\ \&\ c_2=1$$
The required value would be : -6
Case 2: $$c_2=-2\ \&\ c_1=1$$
The required value would be : 6
The product of possible values therefore is -36
Suppose xy are positive integers such that xy = 2835. If the HCF of x and y is 9, then what are the possible values of 2x +y ?
Solution
Upon finding the prime factors of 2835, we get $$7\times\ 5\times\ 3^4$$
Since we know that the HCF of x and y is 9, the $$3^4$$ must be split equally between x and y.
Now the possible pair values of x and y are (315, 9) or (45,63) {This we get by distributing the remaining 5 and 7 between x and y}
of these pairs, we cannot we cannot find the exact values of x and y.
So we will have to find the possible combinations for 2x+y and find those values.
x=9 and y=315 gives us 333
x=63 and y=45 gives us 171
x=45 and y=63 gives us 153
x=315 and y=9 gives us 639
We can see that of all of these values, 333 and 153 are in the option C.
Hence, Option C is the correct answer.
A man purchased 20 dozens of pencils at the rate of Rs. 240 per dozen. Two-thirds of the pencils were sold at the rate of Rs. 25 each and the rest of the pencils sold at Rs. 22 each. What is the average percentage of profit?
Solution
The total number of pencils bought is $$20\times\ 12=240$$ and the price of each pencil is $$\frac{240}{12}=20$$ rs.
Therefore, the total money invested is 4,800
Now, 2/3 rd of the pencils i.e, $$\frac{2}{3}\times240=160\ $$ pencils are sold at rs 25, earning back $$160\times\ 25=4,000$$
The remaining 80 pencils are sold at rs 22, earning back $$80\times\ 22=1,760$$
Giving us a net revenue of Rs 5,760 and a net profit of Rs 960
The profit percentage is $$\frac{960}{4800}\times\ 100=20\%$$
Therefore, Option A is the correct answer.
If x and y are two positive integers such that the highest common divisor of these numbers is two, then how many values can x take if x + y = 99, simultaneously?
Solution
We are given that the highest common divisor of x and y is 2, which means that both of them are even.
Next we are asked, for how many values of x can we have x+y=99
Now, 99 is an odd number, to get an odd number by addition of two numbers, one of those numbers must be odd and the other must be even.
But we know that both x and y are even as they are both divisible by 2.
Therefore, no value of x and y is possible which satisfy both the conditions.
Hence, Option C is the correct answer.
Ajay, Bharat and Chandu can complete a piece of work in 24 days, 30 days, and 32 days, respectively. Ajay and Chandu work on the first day and Bharat completes the same work the next day. If they work in this way, in how many days can they complete the work?
Solution
Let's take the original work to be a multiple of the LCM of 24, 30 and 32; that would be 480x.
Now the efficiencies of Ajay, Bharat and Chandu are 20x, 16x and 15x units/day respectively.
In the process defined in the question, we can add up the efficiencies of Ajay and Chandu, since they always work together, giving us an efficiency of 35x units/day.
The next day, Bharat does 16x units/day.
In two days, these three do a total of 51x units/two-day.
So, in 9 days(18 days), all three can do a work of 51x*9 = 459x units.
Now, the remaining work is 480x-459x = 21x
The efficiencies of Ajay and Chandu, since they always work together, giving us an efficiency of 35x units/day.
They work together and complete the work in 21x/35x = 0.6 days
Option A is $$18\ \frac{21}{35}$$, this 21/35 is nothing but 0.6
So we can conclude that the answer would be Option A, without calculating the exact value.
If $$\dfrac{1}{2+\frac{1}{3+\dfrac{1}{4+\frac{1}{\frac{1}{x}}}}}$$ = $$\frac{68}{157}$$, then the value of $$x^{3} + 3x^{2} - 9x + 5$$.
Solution
Solving the given relation,
$$\frac{157}{68}=2+\frac{1}{3+\frac{1}{4+\frac{1}{x}}}$$
$$\frac{21}{68}=\frac{1}{3+\frac{1}{4+\frac{1}{x}}}$$
$$3+\frac{1}{4+\frac{1}{x}}=\frac{68}{21}$$
$$\frac{1}{4+\frac{1}{x}}=\frac{5}{21}$$
$$\frac{21}{5}=4+\frac{1}{x}$$
$$\frac{1}{5}=\frac{1}{x}$$
Giving the value of x to be 5,
Using this we can find the value of polynomial to be
$$5^3+3\left(5\right)^2-9\left(5\right)+5$$
$$125+75-45+5$$
= 160
Therefore, Option A is the correct answer.
100 people are standing in a row such that the distance between the person standing at the $$n^{th}$$ place and the person standing at the $$(n + 1)^{th}$$ place is exactly (n + 1) metres. What is the distance between the person standing at the $$1^{st}$$ place and the person standing at the $$50^{th}$$ place in the row (in metres)?
Solution
The distance between the 1st position and 2nd position would be 2 meters.
The distance between the 2nd position and 3rd position would be 3 meters.
The distance between the 3rd position and the 4th position would be 4 meters.
we can see a pattern emerging here,
.....
The distance between the 49th position and the 50th position would be 50 meters.
So the total distance between the 1st position and the 50th position would be 2+3+4+......+50
We can easily calculate this as the sum of an AP and it turns out to be $$\frac{49}{2}\left[2\left(2\right)+\left(48\times\ 1\right)\right]$$
Which is equal to 1274
Hence, Option A is the correct answer.
A merchant has 300 pumpkins. The merchant sells two-third of the pumpkins at the marked price, 75% of the remaining pumpkins at 20% reduced price, and finally the remaining pumpkins at 40% off the marked price. If the total sell price of pumpkins is Rs. 2750, then the original selling price of each pumpkin is
Solution
Let's take the original marked price to be MP.
2/3rd of the original 300 pumpkins were sold at the marked price, so the sales from this part is 200 MP.
75% of the remaining 100 pumpkins, which is 75 pumpkins were sold at a 20% discount, the sales from this part would be
$$75\times\ \frac{4}{5}MP\ =\ 60MP$$
The remaining 25 pumpkins are sold at 40% discount, the sales from this part would be $$25\times\ \frac{3}{5}MP=15MP$$.
This gives us a total sales of $$200MP+60MP+15MP=275MP$$
We are given that this is equal to 2750, which gives us the value of MP to be 10.
Thus, Option B is the correct answer.
A die is thrown twice. What is the probability that at least one of the two dice shows the number 4?
Solution
In cases of question asking the probability of an event happening at least one time, it is usually easier to calculating the probability of the event not happening at all and subtracting it from 1.
In this case, we can find the probability of both dices rolling any number but 4, so each dice will have 5 available options.
The probability of this happening on one dice is $$\frac{5}{6}$$ and the probability of this happening on both the dices simultaneously is $$\frac{5}{6}\times\frac{5}{6}=\frac{25}{36}$$
Now subtracting this from 1 gives us the required probability, $$1-\frac{25}{36}=\frac{11}{36}$$
Hence, Option B is the correct answer.
Let $$f(x) = \sin x + \sin 2x + \cos 3x$$. Then the graph of $$g(x) = \sin (x + \pi) + \sin (2x + \pi) + \cos (3x + \pi)$$:
Solution
Although option C might seem like a good choice,we have to remember that the given function is not algebraic is nature.
Upon simplifying g(x) we get,
$$g(x) = \sin (x + \pi) + \sin (2x + \pi) + \cos (3x + \pi)$$
$$g(x) = -\sin (x) - \sin (2x) - \cos (3x)$$
This is because $$\pi\ +x\ $$ lies in the third quadrant, where both sine and cosine functions are negative.
We can get g(x) upon reflection of f(x) along the x-axis, but it is not possible using the operations given in option A, B and C.
Therefore, Option D is the correct answer.
A roly-poly toy is made by joining a hemispherical bottom with a conical top. The diameter and the volume of the hemisphere are the same as the diameter of the base and volume of the cone, respectively. The toy is vertically cut at half of its height. If the diameter of the base sphere was 4 inch, what would the volume (in $$inch^{3}$$) of the upper half of the toy be?
Solution
Volume of the semi-sphere = $$\frac{1}{2}\times\ \frac{4}{3}\pi\ r^3$$
Diameter of the Semi-sphere = 2r
Volume of the Cone = $$\frac{1}{3}\times\ \pi\ r^2h$$
Diameter of the base of the cone = 2r
We are given that the diameter of the sphere is 4 inch.
2r = 4
giving us, r = 2 inches
We are also given that the volume of the cone and volume of the semi-sphere are equal.
using r =2 gives us,
$$\frac{1}{2}\times\ \frac{4}{3}\pi\ r^3$$ = $$\frac{1}{3}\times\ \pi\ r^2h$$
$$\frac{1}{2}\times\ \frac{4}{3}\pi\ 8$$ = $$\frac{1}{3}\times\ \pi\ 4h$$
this gives us h=4
Now we are to find the volume of the upper half of the toy.
The total height of the toy is 2 inches of the semi-sphere + 4 inches of the cone = 6 inches
So the upper half of this toy would be the upper 3 inches of the cone.
We will have to find the radius of base of this section of cone.
Using the tan of the semi-angle of the cone we get, $$\tan\ \theta\ =\frac{perpendicular}{base}=\frac{2}{4}=\frac{required\ base}{3}$$
This gives the required base radius as $$\frac{3}{2}$$ inches.
Finding the volume of this section of the cone, $$\frac{1}{3}\pi\ \left(\frac{3}{2}\right)^23\ =\ \frac{9\pi}{4}$$
Hence, Option D is the correct answer.
One man and one woman can complete a piece of work in 18 days while four men and three women can complete the same work in 5 days. In how many days can two men and three women complete the same work?
Solution
Let the efficiency of a single man and single woman by M units/day and W units/day respectively.
The first statement is : Total work = 18(M + W) {Work = Time x efficiency}
The second statement is: Total work = 5(4M + 3w)
Since, the total work is same in both the equations, we can equate them to get;
$$18M+18W=20M+15W$$
$$3W=2M$$
$$M=\frac{3}{2}W$$
With this relation, we can find the total work in terms of W or M; Using equation 1 to find the total work in terms of W we get,
$$18\left(\frac{3}{2}W\right)+18W=45W$$
Now the time taken by 2 men and 3 women to do this work will be
Time x($$2\left(\frac{3}{2}W\right)+3W\ =\ 45W$$
Time = $$\frac{45}{6}=\frac{15}{2}=7\ \frac{1}{2}$$
Therefore, Option B is the correct answer.
Let a function $$f:\left[-\pi, \pi\right] \rightarrow $$ be expressed as $$f(x) : \sum_{j=1}^k a_{j} \cos(jx) + \sin x + 2 \sin 3x + 4 \sin 8x$$. f(-x) = -f(x), then
Solution
We want the function to be odd i.e, f(-x) = - f(x)
Now we know that sin(-x) = - sin (x) as sine is an odd function
But cos (-x) = cos (x) as cosine is an even function
So if we put the input as -x in our defined function, we get,
= $$\sum_{j=1}^k a_{j} \cos(-jx) + \sin (-x) + 2 \sin (-3x) + 4 \sin (-8x)$$
= $$\sum_{j=1}^k a_{j} \cos(jx) - \sin x - 2 \sin 3x - 4 \sin 8x$$
I we want both of these terms to be equal, we would have to remove the cosine term
Option B does just that, by putting the coefficient of the cosine function as zero for all values of j. And the range given in option B is the same as the range of j in the given function.
This would give us the value of function to be $$\sin (x) + 2 \sin (3x) + 4 \sin (8x)$$, which is an odd function.
So option B is the correct answer.
If h(x) = |x+3| — |x— 3| for all real x, then for how many integer values of x is the inequality |h(x)| < 6 satisfied?
Solution
The question asks us the integer values of x for which, the inequality
$$\left|\left|x+3\left|-\right|x-3\right|\right|<6$$ is satisfied.
We can also interpret the given inequality as,
$$-6<\left|x+3\left|-\right|x-3\right|<6$$
Now we see that there are two key points to take note of, where the modulus shows it's effects. Those are at x=-3 and x=3
We need to check the value of the middle term for the three cases of x<-3, -3<x<3 and 3<x
For x< -3,
We see that the first and second modulus terms will have negative values inside them, and will thus reverse the sign.
We can take a value as an example to see the result. Let's take x= -10
$$\left|-10+3\right|-\left|-10-3\right|$$
$$\left|-7\right|-\left|-13\right|$$
$$7-13\ =\ -6$$
For any negative value of x < -3, the answer will be -6.
This does not satisfy our condition as we need the resulting values bigger than -6.
For x> 3,
We see that both the terms in the modulus will be positive and hence the modulus will not change any signs.
$$\left(x+3\right)-\left(x-3\right)$$
$$x+3-x+3\ =\ 6$$
For any value of x> 3, the answer would be 6.
This again does not satisfy our condition and thus is not valid.
For -3< x< 3,
For this range, the first modulus term will have positive value inside while the second modulus modulus will have a negative value inside.
$$\left(x+3\right)-\left(-\left(x-3\right)\right)$$
$$\left(x+3\right)-\left(-x+3\right)$$
$$\left(x+3\right)+x-3$$
$$2x$$
And since the values of x lies between -3 and 3, the values of 2x lies between -6 and 6.
And thus this range satisfies the inequality.
The integers that lie in this range are -2, -1, 0, 1 and 2.
So a total of 5 integers satisfy this inequality.
If b is the largest natural number that divides $$8^{8}$$ and $$b = a^{3}$$ for some $$a \epsilon N$$, then what s the value of a?
Solution
Since we know that b is a cube, we should try to express b in terms of its prime factors to get a clear idea on how to proceed.
$$b=8^8=\left(2^3\right)^8=2^{3\times\ 8}=2^{24}$$
Now, $$b=a^3=2^{24}$$
$$a=\sqrt[\ 3]{2^{24}}=2^{\frac{24}{3}}=2^8$$
Which is equal to 256
Therefore, Option A is the correct answer.
The ratio of the incomes of P and Q is 16 : 9 and the ratio of their expenditures is 8 : 5.
The saving of P is 220% more than that of Q.R earns 25% less than P and spends 20% more than Q. What is the ratio of P's income to R's savings?
Solution
Let P and Q's income be 16x and 9x respectively, and P and Q's expenditure be 8y and 5y respectively, where x and y are constants.
P's savings = 16x - 8y
Q's savings = 9x - 5y
We are given that P's savings are 220% more or 320% of Q's savings. Using this we get,
$$16x-8y=\frac{32}{10}\left(9y-5x\right)$$
$$160x-80y=288x-160y$$
$$80y=128x$$
$$\frac{y}{x}=\frac{8}{5}$$
we are given that R's earning are 25% less than P's earnings, using this we get R's earnings to be $$\frac{3}{4}\times\ 16x=12x$$
We are also given that R's expenses are 20% more than Q, using this we get R's expenditure to be $$\frac{6}{5}\times\ 5y=6y$$
This gives R's savings to be 12x - 6y, using the relation between y and x, we can convert this in terms of x,
$$12x-6\left(\frac{8}{5}x\right)=12x-\frac{48}{5}x=\frac{12}{5}x$$
The ratio of P's income to R's savings would be $$\frac{16x\times\ 5}{12x}$$
=$$\frac{20}{3}$$
Therefore, Option B is the correct answer.
Let a, b be nonzero real numbers. Choose the correct statement.
Solution
Option A:
$$4a^{2} — 3ab + b^{2} \geq 9$$
= $$4a^{2} — 4ab + b^{2} + ab \geq 9$$
= $$\left(2a\ -\ b\right)^2+ab\ \ge\ 9$$
From this we cannot necessarily say that $$ab\ \ge\ 9$$, because we don't know the value of $$\left(2a-b\right)^2$$
If we look at option D which is very similar,
It says that we have $$ab\ \ge\ 9$$ and we have to prove $$4a^{2} — 3ab + b^{2} \geq 9$$.
From the inequality we derived above, $$\left(2a\ -\ b\right)^2+ab\ \ge\ 9$$,
from the option we know that$$ab\ge\ 9$$ , therefore, this term would absolutely be $$\ge\ 9$$ since the minimum value $$\left(2a-b\right)^2$$ can have is zero and even that satisfies the condition.
Option B is simple calculations, where upon squaring the original statement, we get $$9a^{2} — 12ab + 4b^{2} > 0$$ which is opposite to what are are supposed to check.
Option C is different, Upon taking a common from the given equation, we get:
$$a\left(9a-12b+4b^2\right)=0$$
Since it's given that a and b are non-zero, the second term must be zero.
Solving this for b we would reach an irrational equation where we cannot solve for b anymore and not reach the value of b= 2a/3
That is, we cannot reach the conclusion that b=2a/3 from the initial equation.
Therefore, Option D is the correct answer.
On the number line, what is the distance of any given number from the double of the same number?
Solution
Thinking about this through a number line would make the solution a lot simpler.
We can eliminate option B and C because we are talking about the distance between two numbers, that would be an absolute value and thus never less than zero.
Option A comes close but miss out on the case of zero. The distance between zero and double of zero, which would be zero again is also zero.
That is why Option D would be the correct answer.
It covers all the cases as the distance between a number and double of that number, for negative numbers, positive numbers and zero.
If $$x_{1}, x_{2}$$ are the roots of the equation, $$2x^{2} — 4x + 5 = 0$$, then the equation whose roots are $$x_{1} + \frac{1}{x_{1}}$$ and $$x_{2} + \frac{1}{x_{2}}$$ is:
Solution
After seeing that the initial quadratic equation cannot be easily factorised, we should be looking at the sum and product of the roots,
Sum of the roots: $$x_1+x_2=2$$
Product of roots: $$x_1x_2=\frac{5}{2}$$
Now for the new equation we need, we can again calculate the sum and product of roots.
Sum of roots: $$x_1\ +x_2\ +\frac{1}{x1}+\frac{1}{x2}$$
=$$\left(x_1+x_2\right)+\left(\frac{x_1+x_2}{x_1x_2}\right)$$
=$$\left(x_1+x_2\right)\left(1+\frac{1}{x_1x_2}\right)$$
Putting in the values, we get: $$2\left(1+\frac{2}{5}\right)=\frac{14}{5}$$
Product of roots: $$\left(x_1+\frac{1}{x_1}\right)\left(x_2+\frac{1}{x_2}\right)$$
=$$x_1x_2+\frac{x_1}{x_2}+\frac{x_2}{x_1}+\frac{1}{x_1x_2}$$
=$$x_1x_2+\frac{1}{x_1x_2}+\frac{\left(x_1^2+x_2^2\right)}{x_1x_2}$$
=$$x_1x_2+\frac{1}{x_1x_2}+\frac{\left(x_1+x_2\right)^2-2x_1x_2}{x_1x_2}$$
Putting in the values, we get $$\frac{5}{2}+\frac{2}{5}+\frac{2\left(\left(2\right)^2-\left(2\times\ \frac{5}{2}\right)\right)}{5}$$
=$$\frac{5}{2}+\frac{2}{5}-\frac{2}{5}$$
=$$\frac{5}{2}$$
Checking the options for these conditions of sum and product of roots, we see that only option A satisfies all of our criterion.
Therefore, Option A is the correct answer.
\What is the sum of the following series?
$$2.12 + 1.0012 + 0.000012 + 0.00000012 + 0.0000000012 +....\infty$$
Solution
We can rewrite the series as
$$2+0.12+1+0.0012+0.000012+\ ...$$ and so on
=$$2+1+0.12+0.0012+0.000012+0.00000012+.....$$
=$$3+\frac{12}{100}+\frac{12}{100^2}+\frac{12}{100^3}+\frac{12}{100^4}+.....$$
=$$3+12\left(\frac{1}{100}+\frac{1}{100^2}+\frac{1}{100^3}+.....\right)$$
Using the formula for the sum of an infinite series we get,
$$3+\frac{12\left(\frac{1}{100}\right)}{\left(1-\frac{1}{100}\right)}$$
=$$3+\frac{12}{99}$$
$$\frac{309}{99}=\frac{103}{33}$$
And hence, Option A is the correct answer.
$$\sqrt{10 + 4\sqrt{3 -2\sqrt{2}}} = a + \sqrt{2}b$$, then what is the value of $$\sqrt{a^{3} + b^{3} + 4a^{2}b}$$?
Solution
$$\sqrt{\ 3-2\sqrt{\ 2}}$$ is the same as $$\sqrt{\ 2}-1$$
So we can rewrite the equation as, $$\sqrt{\ 10+4\sqrt{\ \left(\sqrt{\ 2}-1\right)^2}}=\sqrt{\ 10+4\left(\sqrt{\ 2}-1\right)}$$
$$\sqrt{\ 6+4\sqrt{\ 2}}=a+\sqrt{\ 2}b$$
Squaring on both side, we get
$$6+4\sqrt{\ 2}=a^2+2b^2+2\sqrt{\ 2}ab$$
Equating the rational and irrational parts on both side, we get
$$a^2+2b^2=6$$ and
$$2ab\ =\ 4$$
Trying different values, we can reach that a=2 and b=1
Putting these values in the given formula we get,
$$\sqrt{\ a^3+b^3+4a^2b}$$
$$\sqrt{\ 8+1+16}\ $$
=$$\sqrt{\ 25}=5$$
Therefore, option B is the correct answer.
In still water, a boat can cover a distance of 10 km at the speed of 5 km/h in certain time interval and during the same time interval it can cover a distance of 8 km while moving upstream in a river. What is the speed of the river (in km/h)?
Solution
In still water, the boat can cover a distance of 10 km with a speed of 5 km/hr in $$\frac{10}{5}=2$$ hours.
In two hours, the boat travels 8 km upstream.
Therefore, the speed of boat upstream is $$\frac{8}{2}=4$$km/hr.
We know the speed of the boat is 5 km/hr and thus we can find the speed of the stream.
In upstream, effective speed = boat's speed - stream's speed
4 = 5 - stream's speed
Stream's speed = 1 km/hr
Hence, Option C is the correct answer.
Using $$100\pi cm^{3}$$ volume of clay, a hollow cylinder of height 20 cm and thickness 2 cm, has been made. What is the capacity of the cylinder?
Solution
We can take the hollow cylinder to be made of two concentric cylinders, with the inner cylinder carved out of the outer cylinder.
Taking the radius of the outer cylinder to be R, we know that the thickness of the cylinder is 2 cm; therefore, the radius of the inner cylinder will be R-2 cm.
We know that the volume of this hollow cylinder would be $$100\pi\ $$
$$\pi\ R^2h-\pi\ \left(R-2\right)^2h=100\pi\ $$
Putting h=20 and solving the left-hand side, we get
$$4R\ -4=5$$
$$R=\frac{9}{4}$$
The inner radius would be $$\frac{9}{4}-2=\frac{1}{4}$$ cm
The capacity of this hollow cylinder would be $$\pi\ \left(\frac{1}{4}\right)^220=\pi\ \frac{20}{16}=\frac{5\pi}{4}\ cm\ $$
Therefore, Option C is the correct answer.
A builder wishes to fit 8 different types of electrical bulbs in his flats, which are packed by a vendor in some boxes of count 64, 192, 128, 384, 256, 32, 96, 288. The builder ordered in such away that each box contains the same type and the same number of bulbs. The number of minimum boxes required is:
Solution
We should choose a number which is a factor of all of these numbers so that when they are grouped among themselves, there are no leftovers.
The count in the boxes have HCF 32, so we can distribute the bulbs in groups of 32 so that each box has 32 bulbs and each box has only one type of bulb.
The bulb with 64 count would require 2 boxes.
The bulb with 192 count would require 6 boxes.
The bulb with 128 count would require 4 boxes.
The bulb with 384 count would require 12 boxes.
The bulb with 256 count would require 8 boxes.
The bulb with 32 count would require 1 boxes.
The bulb with 96 count would require 3 boxes.
The bulb with 288 count would require 9 boxes.
Adding all of them up, we would get that a total of 45 boxes are required.
Therefore, Option B is the correct answer.
Read the given information carefully and answer the following questions.
Swimming, Skating and Taekwondo are three of the activities in a sports complex. Of the 1500 players in the complex, 15% are not involved in any of the three activities; 290 are involved in only Swimming; and 150 are involved in all the three activities. The number of players involved in only Taekwondo is 80% of the number of players involved in all the three activities; 815 players are involved in Skating; 70 players are involved in only Taekwondo and Skating; and 245 players are involved in only Swimming and Skating.
Number of players involved in all three activities is how much less than the number of players involved in only Swimming?
Solution
This question did not require detailed analysis and making the venn-diagram.
The questions asks the difference between the number of players involved in only swimming and the number of players involved in all three activities.
We are given both of these exact values in the question.
Players involved in only swimming: 290
Number of players involved in all three activities: 150
There are 140 less players doing all three activities than players doing only swimming.
Hence, Option C is the correct answer,
One trained person can train three people in 3 days and those three people individually can train three more people in 3 days. If the process goes on like this and initially there is only one trained person in the company, then how many days will it take to get 1093 trained people in all, given that one person trains only three people?
Solution
The number of newly trained people after the first three day period is 3.
Including the initial member who trained them, the total number of trained people would be 1+3
The number of newly trained people after the second trained people is 9.
Including the number of people who are already trained, we get the total number of trained people to be 1+3+9
We can follow through with this reasoning and see that the total number of trained people make the sum of a GP with the common ratio 3 and the number of terms equal to the number of three day periods required.
We want the total number of trained people to be 1093.
Using the formula for the sum of an GP with n terms we get, $$\frac{a\left(r^n-1\right)}{r-1}=\frac{1\left(3^n-1\right)}{3-1}=1093$$
$$3^n-1=2186$$
$$3^n=2187$$
from here, we can keep checking the value of n and we find that n=7 satisfies the equation.
So there are a total of 7 three day periods required, hence, a total of 21 days required for 1093 people to be trained.
If 10% profit of A is equal to 20% loss of B is equal to 15% loss of C, then what is the ratio of the cost price of A, B and C?
Solution
The profit and loss difference in this question is a misdirection.
The profit on A is equal to the loss on B simply means that the exact values of these are equal. Them being a profit or loss would not make any difference.
we are given,
$$10\%\ of\ A\ =\ 20\%\ of\ B\ =\ 15\%\ of\ C$$
= $$2A\ = 4B = 3C$$
From this we can get, A:B = 2:1 and B:C = 3:4
giving us, A:B:C to be 6:3:4
Option A is the correct answer.
If u and v are the roots of $$ax^{2} + bx + c = 0$$, then what is $$\sqrt{\frac{2\sqrt{ac}-b}{c}}$$?
Solution
Using the sum and product of roots formula, we get $$\frac{c}{a}=uv$$, and hence, $$c=auv$$
And $$-\frac{b}{a}=u+v$$, and hence, $$-b=a\left(u+v\right)$$
Putting values of c and b in the equation we get,
$$\sqrt{\ \frac{2\sqrt{\ ac}-b}{c}}=\sqrt{\ \frac{2\sqrt{\ a\left(auv\right)}+a\left(u+v\right)}{auv}}$$
=$$\sqrt{\ \frac{2\sqrt{\ a^2uv}+a\left(u+v\right)}{uav}}=\sqrt{\ \frac{2\sqrt{\ uv}+\left(u+v\right)}{uv}}$$
=$$\sqrt{\ \frac{\left(\sqrt{\ u}+\sqrt{\ v}\right)^2}{uv}}=\sqrt{\ \frac{\left(\sqrt{\ u}+\sqrt{\ v}\right)^2}{\sqrt{\ uv}^2}}=\sqrt{\ \left(\frac{\sqrt{\ u}+\sqrt{\ v}}{\sqrt{\ uv}}\right)^2}$$
=$$\frac{1}{\sqrt{\ u}}+\frac{1}{\sqrt{\ v}}$$
Therefore, Option A is the correct answer.
The next number in the sequence 2,3, 5,7, 11, 13, 17,31, 37, 71 is:
Solution
This is a series of prime numbers. The prime number next to 71 is 73.
Mr. X finishes 60% of a work in 9 days, and then is joined by Mr. Y and they together finish the next 10% work in 1 day. How long would it take if Y alone is asked to finish the next 5% of the work?
Solution
X can do 60% of the total work in 9 days, this gives us that X can complete the total work in 15 days.
X and Y can together complete 10% of the work in 1 day, this gives us that X and Y can complete the work in 10 days.
We can take the total work to be a multiple of the LCM of these values, let it be 30U.
Now X has an efficiency of 2U units/day.
And X and Y together have an efficiency of 3U units/day.
This gives us that the efficiency of Y to be 1U units/day.
In order for Y to 5% of the total work, that is 3/2 U units of work, Y would require, $$\frac{3}{2\ }=\ 1\ \frac{1}{2}$$ days.
Hence, Option A is the correct answer.
A sum of money at compound interest becomes $$\frac{3}{2}$$times of itself in 2 years. In how many years will it become $$\frac{81}{16}$$ times of itself, interest compounded annually?
Solution
The question had an error in the original questions paper the fraction $$\frac{81}{16}$$ was given as $$\frac{18}{16}$$.
Taking the multiplication factor of this compound interest to be X and the principal amount be P.
We are given that
$$P\left(X\right)^2=\frac{3}{2}P$$
which would give us, $$X=\ \left(\frac{3}{2}\right)^{\frac{1}{2}}$$
Using this for the second condition we had,
we can get
$$P\left(X\right)^N\ =\ \frac{81}{16}P$$
$$\left(\frac{3}{2}\right)^{N\times\ \frac{1}{2}}\ =\ \frac{81}{16}$$
$$\left(\frac{3}{2}\right)^{N\times\ \frac{1}{2}}\ =\ \left(\frac{3}{2}\right)^4$$
Giving us N=8.
Therefore, Option B is the correct answer.
Evaluate $$\sqrt{1600 + 80 \times 50 + 225 + 30 \times 35 + 1225}$$
Solution
We can solve this by simply solving for the value under the root,
$$\sqrt{\ 1600+80\times\ 50+225+30\times\ 35+1225}$$
=$$\sqrt{\ 1600+4000+225+1050+1225}$$
=$$\sqrt{\ 8100}=90$$
Hence, Option B is the correct answer.
Read the given statements and conclusions carefully. Assuming that the information given in the statements is true, even if it appears to be at variance with commonly known facts, decide which of the given conclusions logically follow from the statements.
Statements
1. All birds are flying animals
2. Some snakes are reptiles
3. No flying animal is a snake.
4. All reptiles are carnivores.
Conclusions
I. All reptiles are flying animals is a possibility.
II. No camivore is a bird
III. All flying animals are carnivores is a possibility.
IV. Some camivores are birds.
Solution
.png)
Conclusion 1 does not follow as some reptiles are snakes and no snake is a flying animal.
Conclusion 2 "can be" a possibility.
Conclusion 3 is also a possibility.
Conclusion 4 "can be" a possibility but Conclusion 2 and Conclusion 4 are mutually exclusive and collectively exhaustive which means that exactly one of them has to be the case.
Thus, the correct answer is Option D.
In a certain code 'Best of Luck' is written as 'Jan Feb Mar', 'All The Best' is written as 'May Mar Jun' and 'The Noble Man' is written as 'Jun Jan Dec' then 'Honesty is the Best Policy' will be written as __________.
Solution
It is given that certain code is written as
'Best of Luck' is written as 'Jan Feb Mar'
'All The Best' is written as 'May Mar Jun'
'The Noble Man' is written as 'Jun Jan Dec'
If you observe the first 2 sentences, "Best" is common in both, so the common term in both in code form is Mar
Best = Mar
If you observe the last 2 sentences, "The" is common in both, so the common term in both in code form is Jun
The = Jun
Thus, the code 'Honesty is the Best Policy' will definitely have Mar and Jun (Mar for Best and Jun for The)
Only option C have Mar and Jun.
Select the option that is true regarding the following two statements labelled Assertion (A) and Reason (R)
Assertion (A): Nutritional support of probiotics is prebiotics
Reason (R): Prebiotics is described as indigestible fibre supported growth and multiplication of probiotics.
Solution
The correct option regarding the Assertion (A) and Reason (R) statements is:
Option B: Both Assertion (A) and Reason (R) are true, and Reason (R) is the correct explanation of Assertion (A).
Assertion (A) states that "Nutritional support of probiotics is prebiotics," which means that prebiotics provide the necessary nutrition to support the growth and activity of probiotics. Reason (R) states that "Prebiotics is described as indigestible fiber supporting growth and multiplication of probiotics," which is a correct definition of prebiotics. Furthermore, Reason (R) explains why Assertion (A) is true, as it clarifies that prebiotics, being indigestible fiber, indeed support the growth and multiplication of probiotics. Therefore, both the Assertion and the Reason are true, and the Reason correctly explains the Assertion.
There are four males - Paul, Sam, John, and David and four females -Sita, Gita, Mita and Rita. A team of two males and two females is to be formed such that Paul and John cannot be taken together in ateam. If John is selected, then David must be selected in that team, but not necessarily vice versa. Sita and Paul cannot be taken together in a team. Gita and Mita are always selected together in a team. How many teams can be there that include David?
Solution
From the given information in the question, The 2 males that can be selected with David are
(John, David), (Paul, David) and (David, Sam)
The teams of females possible are
(Gita, Mita) and (Sita, Rita) [Gita and Mita are always selected together in a team]
Now, total possible combinations are 3*2 = 6, but we need to exclude this case [(Paul, David), (Sita, Rita)]
=> Total combinations are 6 - 1 = 5.
Select the option that is true regarding the following two statements labelled Assertion (A) and Reason (R)
Assertion (A): Central dogma of life applies to all living being.
Reason (R): Central dogma of life is direction of flow of genetic information.
Solution
Assertion (A) correctly states that the central dogma of life applies universally to all living beings, which is true. This dogma describes the fundamental process by which genetic information flows from DNA to RNA to protein.
Reason (R) accurately identifies the direction of this flow of genetic information as a key aspect of the central dogma. However, while this directionality is indeed crucial, it does not fully elucidate why the central dogma applies to all living organisms. The central dogma's universality extends beyond its directional flow; it encompasses the fundamental mechanism by which genetic information is expressed across all forms of life.
Therefore, both Assertion (A) and Reason (R) are true, but Reason (R) does not serve as the complete explanation for Assertion (A).
Option A is the correct answer.
Eight persons, designated alphabetically from A to H, are sitting around a square table, with four of them sitting at the corners and the rest four sitting along the sides of the table. All are facing the centre. A is facing B, who is second to the left of C. D is second to the right of E, who is not facing F. G is not a neighbour of A and is not facing either C or D. F is to the immediate left of D.
Who are the persons sitting in clockwise direction from F to H?
Solution
Let us assume the position of A => B is opposite to A and C sits on the side adjacent to A and B.
Now given that F is to the immediate left of D => D is to the immediate left of B (all other possibilities give a contradiction)
=> The final arrangement looks like follows:

=> Required answer is E and A.
Following are the four road maps showing connections of five places. From the connection point of view, if only three maps are similar, then select the map with INCORRECT connection.
Solution
In Option A)

One point is connected with 4 points at max and other 4 points are connected with 3 points.
In Option B) C) and D)


Each point is either connected with 2 or 3 points in the figure. But, no point is added with 4 points.
So, B, C and D are similar.
If p: 2 + 2 = 5, q: The month January has 31 days and r: square of every natural number is a natural number, then which of the following option is true?
Solution
From the given statements, p is false, q is true, and r is true.
=> Option A => p or q is true and true => true is true => correct.
Option B => false or true is true => Wrong.
Option C => true => false is false => Wrong.
Option D => false => true is true => Wrong.
In a queue of 23 persons waiting at a bank counter, there are 9 persons between Rajeev and Heena. Prachi is exactly in the middle of Rajeev and Heena. Tushar is $$3^{rd}$$ from the front and there are five persons between Heena and Tushar. What is Prachi's position from the back?
Solution
We are given that there are 9 people between Rajeev and Heena.
R _ _ _ _ _ _ _ _ _ H
Next, we are given that Prachi is exactly between Rajeev and Heena.
R _ _ _ _ P _ _ _ _ H
We are given that Tushar is 3rd from the start
T 2 1
We are given that there are five people between Rushar and Heena.
Now, Tushar cannot be to the left of Heena because that would mean that the arrangement:
R _ _ _ T P _ _ _ _ H
In which case, he cannot be the third from the start
Therefore, he must be standing to the right of Heena
R _ _ _ _ P _ _ _ _ H _ _ _ _ _ T _ _
Making Heena's position from the start to 9th and Prachi's position to be 14th
Since there are 23 people in the line, Prachi's position from the back would be 23-14+1 = 10th
Therefore, Option C is the correct answer.
$$A \vee B$$ means A is to the right of B.
$$A \wedge B$$ means A is to the South of B.
$$A \phi B$$ means A is facing B.
$$A \sim B$$ means A is to the left of B.
If,
Teena $$\vee$$ Reena,
Veena $$\phi$$ Reena,
Reena $$\wedge$$ Veena,
Meena $$\sim$$ Veena,
Meena $$\phi$$ Teena,
Teena $$\phi$$ North,
Reena $$\phi$$ North,
then which of the following option is true?
Solution
T is to the right of R and R is facing V. Also, R is facing North which means that V is facing South. From these statements, we could get a general idea of their positions:
V
R T
Now, M is to the left of V and M is facing T. This gives:
V M
R T
Option B gives the correct position of M wrt R.
There are eight people seated around a circular table and facing towards the centre. Tom is just adjacent to Sohan and Meena. Yash is to the immediate left of Ram and right of Gita. Gita is seated between Pinki and Yash. Sheela is seated to the immediate right of Ram, opposite Pinki and to the left of Sohan. Which two people are sitting to the right of Meena and to the left of Yash?
Solution
First start with the absolute data:
=> Yash is to the immediate left of Ram and right of Gita and Sheela is seated to the immediate right of Ram, opposite Pinki and to the left of Sohan
and we can use this information "Tom is just adjacent to Sohan and Meena" to make the final arrangement.
=>

Required answer is
Pinki and Gita.
One morning, after walking a few metres eastward from his house, Harish took three successive left tums walking 180 m, 170 m and 300 m in succession. Finally, he turned right and walked 200 m to reach the temple, which is towards the south-west of his house. If the shortest distance between his house and the temple is 150 m, how far did he walk eastward from his house initially?
Solution
_1DoQT9L.png)
Let us assume that Harish started walking towards A and then took 3 left turns and 1 right turn to reach T.
Now, AP = BC = 170 m.
We need to find the value of HP.
We will draw a perpendicular from H on DT. Length of this perpendicular = PD = 120 m and Hypotenuese is HT i.e. 150m.
This gives the length of base i.e. TQ = 90m.
Thus QD = 200 - 90 = 110m.
HP = QD = 110m.
AH i.e. the initial distance covered = HP + PA = 110 + 170 = 280m.
Which of the following means L is the grand daughter-in-law of E?
Solution
Option 1) L is the daughter-in-law of E
Option 2) L is the grand daughter-in-law of E
Option 3) There is no L in the relation.
Option 4) L is grand daughter of E
Four statements are given followed by four conclusions numbered I, II, III and IV. Assuming the statements to be true, even if they seem to be at variance with commonly known facts, decide which of the conclusions logically follow(s) from the statements.
Statements
1) Some Plates are Cups.
2) Some Cups are Bowls.
3) All Bowls are Glasses.
4) Some Bowls are Pans.
Conclusions
I. Some Cups are Pans.
II. Some Pans are Glasses.
III. No Pan is a Plate
IV. No Cup is a Pan.
Solution
Statement i and iv are two opposite statements. So, one of those two has to be true.
We know that all Bowls are Glasses, and some Bowls are Pans. So, some Pans are Glasses.
Statement ii is always true.
Select the option that is true regarding the following two statements labelled Assertion (A) and Reason (R).
Assertion (A): Bad breath odour experienced on a regular basis is a sign that something is wrong with your health.
Reason (R): Stomach acid reflux is associated with bad breath.
Solution
Option D: Both Assertion (A) and Reason (R) are true, and Reason (R) is the correct explanation of Assertion (A).
Assertion (A) states that bad breath odour experienced regularly can indicate an underlying health issue. This is true because chronic bad breath, also known as halitosis, can be a sign of various health problems such as gum disease, dry mouth, or even gastrointestinal issues.
Reason (R) mentions that stomach acid reflux is associated with bad breath, which is also true. Stomach acid reflux, particularly when it reaches the mouth, can lead to an unpleasant odour contributing to bad breath. This occurs because the acid can cause irritation and bacterial growth in the mouth, leading to halitosis.
Therefore, Reason (R) provides a valid explanation for Assertion (A), making both statements true and Reason (R) the correct explanation for Assertion (A).
A statement is given followed by three courses of action. You have to assume everything in the statement to be true and on the basis of the information given in the statement, decide which of the suggested courses of action logically follow for pursuing.
Statement
A girl approaches the police for passport verification and the police demands a bribe.
Courses of action:
I. The girl should immediately complain to the vigilance officer.
II. The girl should refuse to give the police a bribe.
III. The girl should offer the bribe to the police.
Solution
Let's consider the statement:
The girl wants her passport to be verified, and the police officer is asking for a bribe to do so.
Let's look at the options:
(1) Complaining to another officer present is a logical and ethical way to proceed in the situation, as the new officer would get the corrupt officer under criticism and also make sure your verification process goes through.
(2) refusing to bribe in order to get the verification process done is a logical and ethical decision. Unless there is something wrong with the documentation, the process should go through smoothly, and the police officer would have no reason to stop your verification.
(3) Agreeing to give the bribe not only makes the girl indulge in corruption but also brings her verified passport under scrutiny if the knowledge of her bribery ever goes out.
Hence, only 1 and 2 are logical and ethically correct decisions.
Therefore, Option B is the correct answer.
Select the number that can 11 the blank in the following number series.
5, 7, 6, 10, 7, 15, 8, ___, 9, 31, 10, 42
Solution
The series contains two series according to separate patterns for odd and even terms:
- Odd terms: 5, 6, 7, 8, 9,... This appears to be a simple increment by 1 series.
- Even terms: 7, 10, 15,..., 31 The difference between consecutive terms seems to be increasing by 3, 5, 7, 9,...
So, let's continue this pattern:
- Odd terms: 5, 6, 7, 8, 9,...
- Even terms: 7, 10, 15, 22, 31,...
So, the next even term is 22. Therefore, the missing number is 22.
Option C is correct answer.
Two same-sized clocks one in London, another in India show 7:00 am and 12:30 pm, respectively, at a given point of time. What will be the ratio of their minor sector areas, at that time?
A statement is followed by four assumptions numbered I to IV. Consider the given statement and decide which of the given assumptions is/are implicit in the statement.
Statement:
Levying a uniformly low fee structure across all types of engineering institutes would lower down investment in hiring experienced faculty and enabling high student outcomes, the two key areas that define quality education
Assumptions:
I.Asking good quality engineering institutes to adjust their fee structure at par with institutes providing low quality education is compromising with quality
II.The quality of education and placement would suffer if engineering institutes do not spend more in their tie up with industries.
III.A major consideration in ensuring student's higher learning outcomes is to hire quality teachers with comparatively more remuneration.
IV.Not having a uniform fee structure across all engineering institutes is a violation of the universal rights of accessing quality education by all.
A question is followed by three statements labelled as I, II and III. Identify which of the following statements is/are sufficient to answer the question.
Question: What will be the value of UW?
Statement:
I) U - 5V = 6
II) $$U^2 + 25 W^2 = 100 + 10UW$$
III) $$81V^2 - 225 = 18VW - W^2$$
Solution
I => U - 5V = 6
II => $$\left(U-5W\right)^2=10^2$$
III => $$\left(9V-W\right)^2=15^2$$
We have 3 unknowns U, V, and W and 3 equations => we need all 3 to find the individual values of U and W to find the value of UW.
=> All 3 statements are necessary.
Following is a roadmap connecting seven buildings.
To start the journey to visit all the seven buildings, Ramesh must keep in mind that one building can be visited only once, during the whole journey. The journey will be completed if Ramesh visits all the buildings. Ramesh can start bis journey from any of the seven buildings. To complete his journey according to given conditions. how many buildings at there from where he should NOT start his journey?

If the $$1^{ st}$$ Century starts with the day 'Monday' then the probability of starting $$5^{th}$$ century with the day 'Monday' is ________________?
Solution
After 400 years, the calendar repeats itself. So, the 5th century starts on Monday. Hence the probability is 1.
There are two companies A and B.
1.Seema and David work in a same company but not with Radha. Kirti and Rohan are always with David
2. Radha and Sunil never work together. Sunil likes to work with Rohan
3 Kavita and Radha are good friend and join the same company. Yogendra and Trisha work with Kavita and they work in company B.
Who among the following work in company A?
Solution
From I, the grouping are
(Seema, David, Kirti, Rohan) and (Radha)
From II
(Seema, David, Kirti, Rohan, Sunil) and (Radha)
From III
A => (Seema, David, Kirti, Rohan, Sunil) and B => (Radha, Kavita, Yogendra, Trisha)
=> (Seema, David, Kirti, Rohan, Sunil) work in A.
If Ram is standing facing North and is watering the plants through a pipe shower in front of him, and the wind is blowing from East to West, then in what direction will the water from the pipe shower flow?
Solution
The initial direction of water is towards north.

Because of wind the direction changes to North west.
Select the number that can fill the blank in the following number series.
16, 96, 105, 525, 533, ____________, 2139
Solution
The given series can be written as: 16, 16*6 = 96, 16*6+9 = 105, 105*5 = 525, 105*5+8 = 533, 533*4 = 2132, 2132+7 = 2139
Hence, the correct option is C
Consider the given statement and decide which of the suggested courses of action logically follow(s) for pursuing
Statement
With several demands, including their salary increase, the members of the bus drivers’ association did not join their duty and went on a protest march on the highway, blocking the traffic movement.
Courses of Action:
I. The police should clear the highway as soon as possible, even if it amounts to firing teargas shells to disperse the crowd.
II. The police should calm down the crowd assuring them that they would soon be called to the discussion table with the appropriate managing authority.
III. The administration should make alternative arrangements for passengers' travel and wait for the protest movement to die down in course of time.
Solution
Let's take a look at each course of action individually:
(1) Using force to remove the protestors might backfire, as the protestors might get even more support from the public against the authorities. And in case of harm to the protesters, the matter could spiral from simple traffic congestion to a nationwide issue real quick. Hence, this option should be avoided.
(2) This would be the right course of action, as agreeing to discuss and negotiate with the association would fulfil their goal of getting attention and getting the authorities to agree to their demands, or at least consider them seriously.
(3) Ignoring the demands of the bus driver's association members would not make them angry and force them to take harsher actions to get the attention they demand. This can spiral out of hand, causing huge damage to property or life, which the authorities would definitely want to avoid at all costs. Hence, this course of action should be avoided.
Hence, Only (2) is a valid course of action.
Therefore, Option B is the correct answer.
School A has Principal - P1, Vice-Principal - VP1 and 3 Male Teachers - M1, M2 and M3. School B has Principal - P2, Vice-Principal - VP2 and 2 Female Teachers - F1and F2. An interschool competition is being held between School A and School B. For this, three judgement teams are to be formed such that [1] to make the judgement fair, at least one person from each school must be in each judgement team, [2] at least one of P1, P2, VP1 and VP2 must be selected in each judgement team. If VP2 and F2 are in one of the teams, which of the following could be in the other team?
Solution
School A: P1, VP1, M1, M2,M3
School B: P2, VP2, F1, F2
Option A: P2, F1, M2
If P2, and F1 are both in the second team, no member of school B would be left to participate in the third team. Hence, this team is not possible.
Option B: M2, F1, M1
This does not satisfy the second condition of each team having at least one of, P1, P2, VP1, VP2
Option C: M2, P2, M3
This option satisfies both the conditions.
Option D: P2, F1, VP1
If P2 and F1 are both in the same team, this option too would not leave any member of school B to participate in the third team. Hence, this team is not possible.
Therefore, Option C is the correct answer.
While looking for a singer for his party, Mr. Mehta met three girls named Teena, Shobha and Kavita who always gave two replies to any questions in which one is true and the other is false. Among all the three girls one is the truth teller, one is a liar, and one is an alternator. Mr. Mehta gets confused listening to them. Now, it is your task to find out who among the three girls is the singer and get rid of the confusion for Mr. Mehta.
Kavita
I am the singer.
Shobha is a liar.
Shobha
I am the singer.
Teena is not a singer.
Teena
Shobha is the singer.
Kavita tells a lie.
Solution
Let's take Kavita to be the truth-teller.
That would make Kavita the singer and Shobha the liar.
Shobha being the liar says Teena is not a singer, meaning Teena would actually be a singer. Therefore, this scenario fails.
This make Teena an alternator,
If Teena's first statement is false, that must mean that the second statement is true, which says that Kavita tells a lie, but our assumption was that Kavita is the truth teller.
Therefore, this scenario fails.
Let's take Kavita to be the Liar.
That would give us that Kavita is not the singer and Shobha is not a liar.
Now, let's take Shobha to be the truth-teller.
This gives that, Shobha is the singer and Teena is not a singer.
Now, Teena must be the alternator, The first statement is true, so that must make the second statement false, that Kavita tells a lie.
Kavita is a liar and tells two lies. This satisfies our conditions.
We can try the other scenario's as well.
Taking Kavita to be the liar, and Teena to be the truth-teller.
Making the first statement true and second false, but that breaks down as we know Kavita tells two lies and not one.
Furthermore, once we found out that Shobha can be the singer, we need not check for other case as we do not have to find all the cases possible and Shobha is in a single option, and we can mark that as our answer.
Therefore, Option D is the correct answer.
Select the number from among the given options that can replace the question mark (?) in the following series.
13, 20, 33, 52, ?, 118, 161
Solution
Looking at the difference between the give numbers, we see that
20-13 = 7
33-20 = 13
52-33 = 19
and towards the end,
161-118 = 43
One noticeable thing is that all of these are prime numbers.
Writing down the prime number,
2, 3, 5, 7, 11, 13, 17, 19, 23, 29, 31, 37, 41, 43, and so on.
We see that the prime numbers in the difference are prime numbers in an alternating sequence, leaving one prime number in between
The two numbers which should be included in this sequence are:
7, 11, 13, 17, 19, 23, 29, 31, 37, 41, 43
29 and 37
Adding 29 to 52, we get 81.
Adding 37 to 81, we get 118.
This fits prefectly into our series, therfore the missing number is 81.
In a certain code,
'$$A + B$$' means 'A is the father of B',
'$$A \times B$$'means A is the mother of B',
'$$A \$ B$$'' means 'B is the brother of A',
'$$A \% B$$' means 'B is the sister of A',
and 'A # B'means B is the son of A'.
Which of the following statement is correct?
Solution
Statement 1:
K is sister of J, J is the son of their parent H and H is brother of G.
This is not necessarily true because we do not know the gender of G, so G could be the parental uncle or parental aunt.
Statement 2:
V is the son of T, T is the brother of S, and S is the sister of R. This makes T, S and R siblings.
Therefore, the statement that V is the nephew of R is correct.
Statement 3:
P is the son of N, N is the brother of M, L is the mother of M.
This would make P and L generations apart.
Therefore, this statement is incorrect.
Statement 4:
E is the mother of F, E is the sister of D, C is the father of D.
C would be father of E as well, and thus grandparent of F, but we cannot say that F is the grandson of C because we don not know the gender of F.
Therefore, Option B is the correct answer.
In a family, there are three children, named Monu, Nonu and Sonu. One of them is 8 years old, the second one is 10 years old and the third one is 12 years old. Two statements from each child are collected and it is found that both the statements given by the 8-year-old child are true and both the statements given by the 10-year-old child are false. Whereas, out of the two statements given by the 12-year-old child, the first one is true and the second is false.
Following are the statements given by all the three children
Monu: Sonu is 12 years old, and I am 8 years old.
Sonu: Monu is 10 years old and Nonu is 12 years old.
Nonu: Sonu is 8 years old, and I am 10 years old .
Whatare the ages of Monu and Sonu, respectively?
Solution
Taking Monu to be the truth teller,
Sonu is the 12 year old and Monu is the 8 year old.
Sonu's first statement must be truth, but it says that Monu is 10 year old.
Therefore, this scenario is not possible.
Taking Sonu to be the truth-teller.
This makes, Monu to be the 10 year old and nonu to be the 12 year old.
Monu's both statement must be lies.
Sonu is 8 year old, Monu is 10 year old.
Nonu's first statement must be true and second msut be a lie,
Sonu is 8 year old, Nonu is 12 year old.
Taking Nonu to be the truth teller.
This contradicts on the very first statement of Nonu, as he says that Sonu is the 8 year old.
So Sonu must be the truth-teller.
In all the case, the one in which Sonu was the truth-teller and 8 year old, satisfied all the conditions.
Therefore, the ages of Monu and Sonu are, 10, 8 respectively.
In the following Venn diagram, the rectangle represents cars, the circle represents bikes, the triangle represents planes. and the square represents helicopters

Select the option that represents the sum of the number of cars that are bikes as well as planes and number of helicopter that are bikes but neither cars nor planes.
Solution
The number of cars that are bikes as well as planes would be the area of intersection of the rectangle, circle and the triangle, which would be 73.
The number of helicopters that are bikes as well but not cars or planes would be the intersection of the square and circle only, not including the triangle or the rectangle; that would be 12.
The sum of these two values would be $$73+12=85$$
Some people sitting in a row. Madhu is sitting at $$15^{th}$$ position from left to right in the row. Mahima is sitting at $$17^{th}$$ position from right to left in the row. Ravi is sitting exactly in the middle of Mahima and Madhu, and his position is 24 from the right to left. How many people are there in the row?
Solution
Ravi is sitting at 24th position from the right, and Mahima is sitting at 17th position from the right.
There are 6 people sitting between Ravi and Mahima.
Ravi is sitting exactly between Mahima and Madhu, this means that Madhu must be 6 seats away from Ravi, or on the 31st seat from the right.
Now, this 31st seat from the right is 15th seat from the left, meaning that there are 14 people left of Madhu, making the total number of seats to be 31+ 14 = 45
Therefore, option C is the correct answer.
A dealer packed 290 pens into six boxes of different colors - yellow, blue, black, green, red, and pink. There are as many pens in the blue and yellow boxes combined as there are in the pink box. There are one and a half times pens in the pink box as there are in the yellow box. There are twice as many pens in the black box as there are in the yellow box. There are twice as many pens in the red box as there are in the green box and there are as many pens in the red box as there are in the pink box. How many pens are there in the green box?
Solution
We are given that Blue + Yellow = Pink pens
Pink = $$\frac{3}{2}\times\ $$ Yellow pens
Black = $$2\times\ $$Yellow pens
Red = $$2\times\ $$ Green pens
Red = Pink pens
From this, we can get, Red=Pink = $$2\times\ $$Green= $$\frac{3}{2}\times\ $$ Yellow
Giving, $$\frac{Green}{Yellow}=\frac{3}{4}$$, where we can take Green pens to be 3x and Yellow pens to be 4x(x is a constant).
From this, we can find the remaining pens in terms of x.
Green: 3x
Yellow: 4x
Red: 6x
Pink: 6x
Blue: 2x (Blue + Yellow = Pink)
Black: 8x
On adding all of them up we get 29x pens, we know that the total number of pens are 290, giving us the value of x to be 10.
Therefore the number of green pens in the box are $$3\times\ 10$$ = 30
Tony is taller than Sam. Harry is not taller than Tony. Danny is taller than Tony. Sam is shorter than John. At least one person is shorter than Sam and at least two people are taller than John. Who is the tallest person?
Solution
In terms of height, Tony > Sam.
Tony $$\ge\ $$Harry
Danny>Tony
John>Sam
At least one person is shorter than Sam, and at least two people are taller than John.
In order to find the tallest person, we can easily see that John cannot be the tallest (he has at least two people taller than him), Sam is shorter than Tony, Danny is taller than Tony and Harry. making everyone have someone taller than them except Danny.
Therefore, Danny would be the tallest of all of these.
There are coins of three different colours with one single digit number (any number from 0 to 9) printed on each side of all the coins. The numbers printed on coins of one colour cannot be repeated on coins of any other colour.
I.There are three red coins and for each red coin the difference between the numbers printed on two sides is 1 and all red coins have identical pairs of numbers.
II. There are three blue coins. The single digit numbers on six sides of these three coins are six consecutive numbers such that the sum of the two numbers on every blue coin is the same and is equal to 11.
III. There are three green coins. All three of them have the number 0 printed on one of the sides and same odd digit number on the other side.
If all nine coins are arranged such that all odd numbers are seen on the top, then what is the sum of these numbers seen on the top of nine coins?
Solution
The biggest clues we have for are for the blue coins, they are 6 consecutive numbers and the numbers on each coin add up to give 11.
The possible pairs are (9,2),(8,3),(7,4),(6,5), of these four pairs we cannot take (9,2) because then we cannot have 6 consecutive numbers. The only way is to have the green coins as (3,8), (4,7) and (5,6) giving us the 6 consecutive numbers from 0 to 9.
The next important clue is for the green coins, we know that one of the number is 0 and the other number is odd. we only have 1, 2 and 9 remaining.
For the red coins, the difference between the numbers is 1 i.e, the numbers are consecutive. Out of the three remaining number the only way it is possible is if the red coins have 1 and 2 on them. So the red coins will be (1,2),(1,2) and (1,2)
Leaving only 9 for the green coins, leading the green coins to be (0,9),(0,9) and (0,9).
Now all coins are arranged with the odd sides up, so the sum of these odd sides will be {Blue coins}$$3+7+5$$ + {Red Coins}$$1+1+1$$+ {Green Coins}$$9+9+9$$ giving the net sum to be 45.
Therefore, Option B is the correct answer.
Consider the given statement and decide which of the given assumptions is/are implicit in the statement.
Statement
Experts remark that the goal of education is to give a big push to a nation's potential in research when it is imparted in native languages enabling the country to take full advantage of its citizen's intellectual capabilities
Assumptions:
I. Education imparted in a language other than native languages can limit the intellectual progress of achild.
II. Educationists accord greater primacy to native languages as the medium of teaching to embolden the intellectual and analytical thinking of children
III. Education imparted in native languages will check youths from moving out of the country so that the situation of ‘brain drain will turn into a position of ‘brain gain'.
Solution
The key points of the statements are:
(1) Eductiaons's goal is to push the potential of research
(2) Imparting education in the native language will allow them to use their full intellectual capabilities.
Let's look at the assumptions:
(1) If this were not true, then it would have made sense to argue for imparting education in the native language. Only if teaching in a foreign language can limit the intellectual progress of a child would imparting knowledge in the native language make any difference. Hence, this assumption is implicit.
(2) This assumption is also implicit. If the experts did not believe so, there would have been no point or need to argue for imparting teaching in the native language. Hence, this assumption, too, is implicit.
(3) Although education's goal is to increase the nation's potential in research, and this would not be achieved if the talented youth moved out of the nation, this is not the reason why the experts suggest the native language. We can check this via negation; if teaching in the native language would not check the population going out, would it still be a better idea to teach in the native language?
The answer would be yes, as that would still improve the potential of the candidates to stay inside the country and achieve the goal.
Hence, this is not an implicit assumption.
Hence, only 1 and 2 are implicit assumptions.
Therefore, Option A is the correct answer.
Study the given passage and answer the questions that follow.
With a large arable land area and temperate climate, our country is endowed by nature for agricultural production. As against the world average of only 11%,our arable land area is 51% of the total land area, which can produce two crops a year, even if half of the standard rainfall is received. More than 38 million hectares of land, though cultivable, has been left uncultivated and classified as ‘cultivable wasteland. This accounts for more than the total cultivated land area of our neighbouring four countries taken together. Not only is our rainwater being wasted, but the good top soils are also being eroded and ground water is being depleted. We have not yet given due planning focus to preserve our most valuable natural assets, land and water, which are responsible for agricultural production and consequently, the incidence of poverty. Furthermore, lower increase in prices of farm outputs Compared to those of farm inputs have led to poor profits, poor capital formation and stagnation in the farm sector. It is the people of any country including, of course, those who work in agriculture production, who make or mar its future, not just the politician, industrialists and technicians. Though the latter always play an important role for a country's development, the majority of its people should not be left wallowing in poverty as nothing much can be achieved for improving their status without improving production in agricultural sector and fixing higher minimum support prices for farm outputs, at least commensurate with increases in price with farm inputs.
While quite a number of our natural resources and intervention initiatives are important, which should be our first action step to achieve economic prosperity?
Solution
Option A: The passage states that more than enough farmable land is required. No mention of water, land pollution, or scarcity has been made. These measures do not address any of the issues in the passage.
Option B: This is what the author asks us to do near the end of the passage. The author says that it's not simply the responsibility of politicians, industrialists, and technicians to help out but of the entire nation, and we should be doing that as a priority. Therefore, this would be the correct answer.
Option C: Similar to option A, water and land pollution are alien to the discussion in the passage.
Option D: Although this might help the farmers increase the productivity of their work, it is not an issue mentioned by the author. It is the poor policy framework of our nation that needs to be corrected in order to improve the farmer's conditions and not the methods used by the farmers themself.
Therefore, Option B is the correct answer.
Which of the following statements is true?
Solution
Let's take a look at each option individually.
Option A: In the passage, we are given a comparison of the world's and country's average. There might be other countries in the world with more than 51% farmable land compared to their total land.
Hence, Option A cannot be said to be true.
Option B: The lines, "the majority of its people should not be left wallowing in poverty as nothing much can be achieved for improving their status without improving production in the agricultural sector and fixing higher minimum support prices for farm outputs" clearly state that achieving higher agricultural productivity is a necessity in reducing poverty. Hence, this statement can said to be true.
Option C: The lines,"can produce two crops a year, even if half of the standard rainfall is received." is used to say that even with half the standard rain, the land can give at least two crops a year. This is a lower boundary of the number of crops produced, while the option presents this number as an upper boundary. Hence, this options too, is not true.
Option D: Although the author asks us to help the farmers, not rely on politicians and technicians. Nowhere in the passage is it stated or hinted at that the farmers are more important for a countrie's development as compared to the politicians and technicians. Such a comparison is never made. Hence, this, too, cannot be said to be true.
Therefore, Option B is the correct answer.
For any country's development, which of the following segments of people should we choose, on a priority basis, for empowering them through a robust policy formulation?
Solution
The passage discusses the wasted potential of the country's agricultural land and then shifts its focus towards the lower outputs of farms that have led to poor profit, poor capital formation, and stagnation in the farm sector. The author then says that it's not simply the responsibility of politicians, industrialists, and technicians to help out but of the entire nation. We should not be letting the majority of its people wallow in poverty.
The people being talked here are the people who work in the farm sector, i.e. the farmers.
The author is asking us to help the farmers of our nation who are struggling in our nation.
Hence, for this question, the author wants us to help out the farmers on a priority basis.
Therefore, option A is the correct answer.
