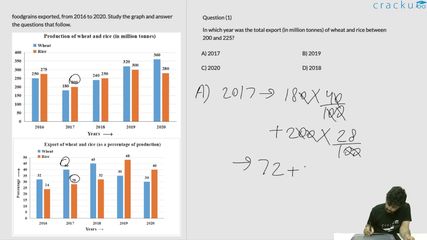
foodgrains exported, from 2016 to 2020. Study the graph and answer the questions that follow.


In which year was the total export (in million tonnes) of wheat and rice between 200 and 225?
Solution
Checking the Export for all of the options we see:
Option A: 2017
Wheat Export - 40% of 180 = 72
Rice Export - 28% of 200 = 56
Total Export - 128
Option B: 2019
Wheat Export - 35% of 320 = 112
Rice Export - 48% of 300 = 144
Total Export - 256
Option C: 2020
Wheat Export - 30% of 360 = 108
Rice Export - 40% of 280 = 112
Total Export - 220
Option D: 2018
Wheat Export - 45% of 240 = 108
Rice Export - 32% of 250 = 80
Total Export - 188
As we can see, only option C satisfies our condition.
Therefore, Option C is the correct answer.
Get AI Help
Video Solution
Click on the Email ☝️ to Watch the Video Solution

SRCC Quant Questions | SRCC Quantitative Ability
SRCC DILR Questions | LRDI Questions For SRCC
SRCC Verbal Ability Questions | VARC Questions For SRCC
Free SRCC Quant Questions
Book Free CAT Mentorship
Get personalized CAT strategy from a 99%iler
500+ students mentored
OTP Verification
Enter the 6-digit code sent to your phone
Booking Summary
Enter OTP
Didn't receive the OTP?


