MAH CET 10th Mar 2024 Slot 3
For the following questions answer them individually
MAH CET 10th Mar 2024 Slot 3 - Question 141
DIRECTION for the question: Solve the following question and mark the best possible option.
Anna left for city A from city B at 5.20 a.m. She travelled at the speed of 80 km/hr for 2 hours 15 minutes. After that the speed was reduced to 60 km/hr. If the distance between two cities is 350 kms, at what time did Anna reach city A?
MAH CET 10th Mar 2024 Slot 3 - Question 142
DIRECTION for the question:
A cricketer whose bowling average is 12.4 runs per wicket takes 5 wickets for 26 runs and thereby decreases his average by 0.4. The number of wickets taken by him till the last match was:
MAH CET 10th Mar 2024 Slot 3 - Question 143
DIRECTION for the question: Solve the following question and mark the best possible option.
A car covers 420 km with a constant speed. If its speed were 10 km/h more it would have taken one hour less to cover the distance. Find the speed of the car.
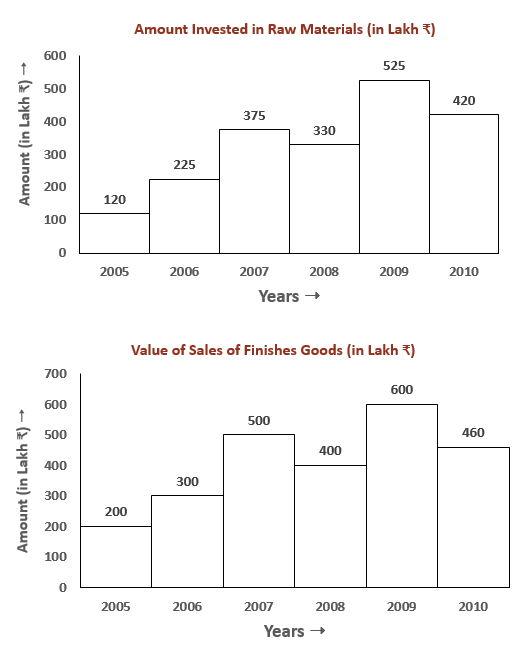
DIRECTION for the question: In the following bar graphs given below, one shows the amount (in lakh Rs.) invested by a company in purchasing raw materials over the years and the other shows the value (in lakh Rs.) of finished goods sold by the company over the years. Study the bar graphs and answer the questions based on them
MAH CET 10th Mar 2024 Slot 3 - Question 144
In which year, there is maximum percentage increase in the amount invested in raw materials as compared to the previous year?
MAH CET 10th Mar 2024 Slot 3 - Question 145
What was the difference between the average amount invested in raw materials during the given period and the average value of sales of finished goods during this period?
MAH CET 10th Mar 2024 Slot 3 - Question 146
In which year, the percentage change (compared to previous year) in the investment on raw materials is the same as that in the value of sales of finished goods?
MAH CET 10th Mar 2024 Slot 3 - Question 147
The value of sales of finished goods in 2009 was approximately what percent of the average amount invested in raw materials in the years 2007, 2008 and 2009?
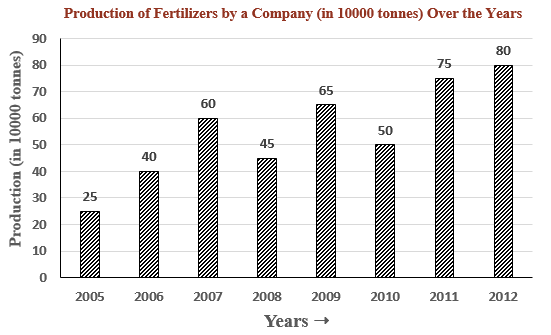
DIRECTION for the question: Study the following bar graph answer the questions given below:
MAH CET 10th Mar 2024 Slot 3 - Question 148
What was the percentage decline in the production of fertilizers from 2007 to 2008?
MAH CET 10th Mar 2024 Slot 3 - Question 149
The average production of 2006 and 2007 was exactly equal to the average production of which of the following pairs of years?
MAH CET 10th Mar 2024 Slot 3 - Question 150
In how many of the given years was the production of fertilizers more than the average production of the given years?