Maruti-Suzuki Company manufactures the Ciaz cars at its Manesar facility. The company employs labour and capital/machine as inputs in a 2 : 1 ratio of their quantities. The cost of one unit of labour (think it as wage per hour) is 500 rupees and the cost of one unit of capital (machine running cost per hour) is 1500 rupees. The total labour and capital cost for the monthly production is 5 crore rupees. Due to economic slowdown, the company has decided to reduce monthly production to half. Meanwhile, the labour cost has decreased by 20% and the capital cost has gone up by 20%. Find the total capital and labour cost the company would now incur for the monthly production.
IIFT 2020 Question Paper
For the following questions answer them individually
Solution
Let the labour employed by the company be 2$$x$$ and the capital be $$x$$.
Thus, the total cost of running production for an hour = $$500\times2x+1500\times x=2500x$$
Total cost for running the production for a month = $$5$$ Crores = $$5\times 10^7$$
Total number of hours the production is done = $$x=\frac{5\times 10^7}{2500}=20000$$
Since the production is cut in half, the total hours = $$0.5\times = 20000=10000$$
Labour costs decreased by 20% and the capital cost increased by 20%.
Thus, the total cost per hour = $$500\times 2x\times 0.8 + 1500\times x\times 1.2=2600x$$
Since $$x=10000$$, the total cost = $$2600\times 100000=2.6$$Crores.
Hence, the answer is option B.
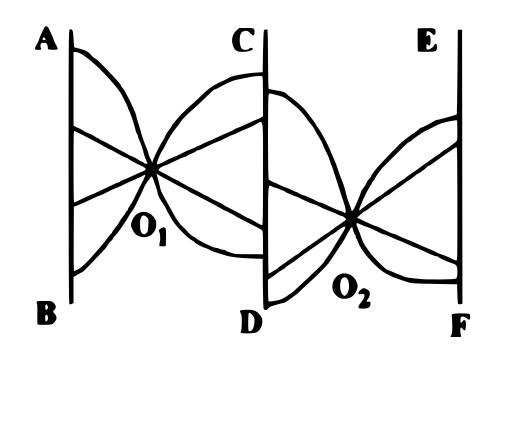
Refer to the figure given below. AB, CD and EF are three parallel paths. A person starts from AB to reach EF by moving in four steps - moving from AB to $$O_1$$ in step 1, from $$O_1$$ to CD in step 2, from CD to $$O_2$$ in step 3 and from $$O_2$$ to EF in step 4. If he takes a curved path in one step, he cannot take a curved path in the next step. In how many ways the person can reach EF from AB ?
Solution
The total number of possible ways from AB to EF = $$4\times 4\times 4\times 4=256$$
If a curved path is taken in a step, then the next step cannot be a curved path.
Let C denotes a curved path and S denotes a straight path.
Thus, the invalid paths are as follows: CCCC, CCCS, CCSC, CSCC, SCCC, CCSS, SCCS, SSCC. Thus, a total of 8 paths.
Total number of arrangements for these 8 paths = $$8\times 2\times 2\times 2\times 2=128$$
Thus, the total number of valid paths = $$256-128=128$$
Hence, the answer is option A.
The product of the roots of the equation $$\sqrt[3]{11+2x}+\sqrt[3]{11-2x}=2$$ is approximately equal to:
Solution
Cubing the given equation, we have :
$$\left(a+b\right)^3=\ a^3+\ b^3+3\cdot a\cdot b\left(a+b\right)$$
$$11+2x+11-2x+3\cdot\left(11+2x\right)^{\frac{1}{3}}\left(11-2x\right)^{\frac{1}{3}}\left(a+b\right)$$
Given a+b = 2.
Hence :
22 + $$3\cdot\left(11+2x\right)^{\frac{1}{3}}\left(11-2x\right)^{\frac{1}{3}}\left(2\right)$$
= 22 + 6*($$\left(121-4x^2\right)^{\frac{1}{3}}$$) = 8
Cubing this we get: $$121-4x^2=-\frac{343}{27}$$
$$4x^2=\ 121+\frac{343}{27}=\ \frac{3610}{27}$$
$$x^2\ =\ 33.42$$
One root would be $$ +\sqrt{33.42}$$ and the other would be $$-\sqrt{33.42}$$.
The product of the roots would be approximately -33.
Sumit stays in Noida in a joint family comprising of his parents, uncle, aunt, an elder sister and a
cousin two years younger than him. Sumit completed his MBA in 2013, from a reputed B-School.
That year, the average age of Sumit's family was 41. Sumit got married in 2015 and two years after he
became father. If the average age of Sumit's family in 2019 remains same as in 2013, and Sumit is
older than his wife by 3 years, at what age did Sumit graduate MBA ?
Solution
Let Sumit's age at the time of graduating MBA [in 2013] be $$X$$ years. Thus, his wife's age that year will be $$X-3$$ years.
The average age of the family in 2013 = 41 years.
Thus, the total age of the family in 2013 = 7 x 41 = 287
Sumit got married in 2015. Thus, his wife's age in 2015 will added to the family's total.
The total age of family in 2015 = 287 + 14 + $$X$$ - 3 + 2 = $$X$$ + 300
In 2017, Sumit had a daughter.
The total age of the family in 2017 = $$X$$ + 300 + 8(2) = $$X$$ + 316
The total age of the family in 2019 = $$X$$ + 316 + 9(2) = $$X$$ + 334
We are given that the average age of the family in 2019 is the same as that in 2013.
Thus, $$X$$ + 334 = 41 x 9 = 369
$$X$$ = 369 - 334 = 35 years
Thus, the age of Sumit at the time of graduating MBA is 35 years.
Hence, the answer is option B.
A fruit seller in a locality uses dishonest practice as follows:
(i) He cheats on weight by 10 percent for every 1kg weight.
(ii) He pushes up the price of fruit by 15 percent and then gives a discount of 8 percent to the buyers for every kg sold.
Find the percentage profit of the fruit seller from sale of 1kg. (Profit is defined as Revenue - Cost)
Solution
Let the cost of fruit be Rs. 100 for 1000gm.
The fruit seller marks the price by 15% and then gives a discount of 8%. Thus, the selling price of fruit = Rs. 105.8
The fruit seller also cheats the customers by 10% of the weight. Thus, he sells 900gm for Rs. 105.8
Cost Price = $$\frac{100}{1}=Rs. 100/kg$$
Selling price = $$\frac{105.8}{0.9}=Rs. 117.56%$$
Percentage profit = $$\frac{117.56-100}{100}\times100=17.56\%$$
hence, the answer is option B.
If $$16^{x}=\frac{64}{256^{y}}$$ and $$9^{x}=\frac{9}{3^{y}}$$, then the values of x and y are respectively,
Solution
From the first equation: $$16^x\cdot256^y=64$$ ==> $$4^{2x}\cdot4^{4y}=4^3$$
Comparing powers: 2x + 4y = 3 .....(A)
From second equation: $$3^{2x+y}=3^2$$
Comparing powers: 2x + y = 2 ......(B)
Solving A and B, we get option C as answer
Mr. Madhukar worked for 5 years in a multi-commodity trading company after graduating from a
reputed B-School. He then resigned from his job and started an online garment export business. For
his business Madhukar used Rs. 8,00,000/- of his own savings and borrowed Rs. 12,00,000/- from a
private sector bank in April, the beginning month of the financial year. Mean while, RBI eased repo
rate in May and banks passed on the benefits to the borrowers. As a result, Madhukar borrowed an
additional Rs. 9,00,000/- after 4 months at an interest rate which is 10% lower than the interest rate of
his earlier borrowing. If the total interest paid by Madhukarat the end of that year on both the loans is
Rs. 1,39,200/-, what is the interest rate per annum on first borrowing ?
Solution
Let the rate of interest of first borrowing be R% p.a.
The principal of first borrowing is kept for an entire 12 month span.
Hence, simple interest payable on it at end of financial year = (12,00,000*1*R)/100 = 12,000*R rupees
Now, rate of second borrowing = 0.9R % p.a.
The principal of second borrowing is kept for 8 months total till financial year end.
Hence, simple interest payable on it at end of financial year = (9,00,000*R*8)/(12*100) = 5400R rupees
Now, 12000R + 5400R = 1,39,200
Hence, R = 8% p.a.
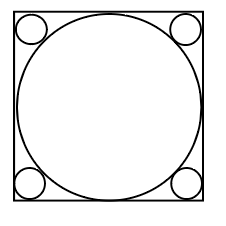
In the figure, a circle of radius 2 cm is inscribed in a square. There are four smaller circles at each of
the cornerof the square. Whatis the total area covered by all the five circles ?
Solution
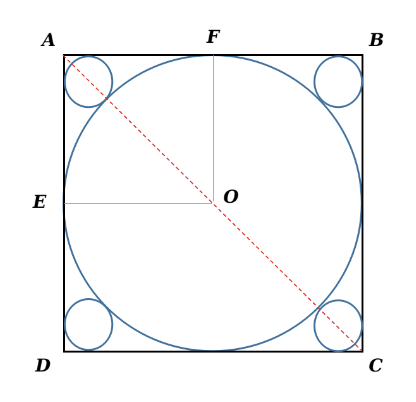
It has been given that radii OE = OF = 2 cm. Consequently, AB = 4 cm {side of the square}. AC = $$4\sqrt{2}$$ cm
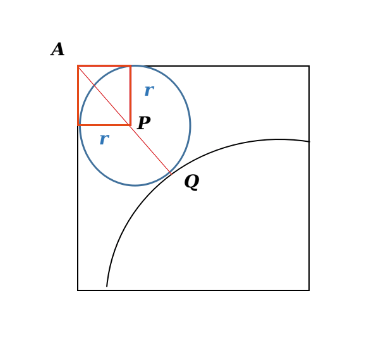
Further, let the radius of the smaller circles be $$r$$ cm. Then, AP = $$r\sqrt{2}$$ cm. Thus, AQ = $$r\sqrt{2}+r$$ or $$r\left(\sqrt{2}+1\right)$$ cm.
There are two such regions on line AC. Hence, we can rewrite AC = $$2\times\ r\left(\sqrt{2}+1\right)+4$$. This is equal to $$4\sqrt{2}$$ cm. On equating, we obtain $$r=\left(6-4\sqrt{2}\right)\ $$ cm.
We have been asked to find the total area covered by the five circles = $$4\pi\ +4\times\ \pi\ \left(6-4\sqrt{2}\right)^2\ cm^2$$
Hence, Option A is the correct choice.
Surojit Ghosh left his IT job last year and started a food business with his wife Debjani. They named
the business "Bong's Kitchen". Surojit takes $$4\frac{1}{5}$$ hours more when he works alone compared to when
he works jointly with his wife. On the other hand, Debjani takes $$28\frac{1}{5}$$ hours more than what she takes
when she works with Surojit. How long approximately will it take, Surojit to complete the business
work alone ?
Solution
Let the number of hours needed by Surojit working alone be S hours and the number of hours required by Debjani when she works alone be D.
The time required to finish the work when they work together = $$\frac{S\cdot D}{S+D}$$
Hence, we can frame the given 2 conditions as:
$$S-\frac{S\cdot D}{S+D}=\frac{21}{5}$$ ............(1)
$$D-\frac{S\cdot D}{S+D}=\frac{141}{5}$$ ..........(2)
Solving the two equations simultaneously, we get S = 15 hours approx
Three friends Pradeep, Suresh and Subodh workin the same office. During an extended weekend they
decided to go together on a family trip to Corbett National Park. They started from office in their own
car but at different time and travelled in the same direction at speeds of 50 km/hr, 60 km/hr and 75
km/hr respectively. Suresh and Subodh overtook Pradeep at the same point. If Suresh started 90
minutes after Pradeep, how many minutes after Pradeep did Subodh start from the office?
Solution
Consider the instance when Suresh just starts from the office.
Distance that Pradeep has already covered in that time = 50*1.5 = 75 km
Now, by concept of relative velocity, time taken by Suresh to just overtake Pradeep = 75/(60-50) = 7.5 hours
Hence, the point of overtaking on the route is = 60*7.5 = 450 km from the office
Subodh also overtakes Pradeep at the same point. Pradeep covers this 450 km distance in 9 hours.
Subodh can cover this 450 km in 6 hours.
Hence, Subodh can leave 9 - 6 = 3 hours after Pradeep does.
ABCD is a parallelogram whose diagonals are parallel to the lines $$2y—x—5=0$$ and $$y+2x—7=0$$ respectively.
Then ABCDis -
Solution
The slope of any line parallel to 2y - x - 5 = 0 would be 1/2
The slope of any line parallel to y + 2x - 7 = 0 would be -2
Product of slopes = -1 which shows that these 2 lines would be perpendicular i.e. we have a parallelogram whose diagonals are perpendicular to each other. This means that the quadrilateral is atleast a rhombus and it would be a square if we can get info that all sides are equal to each other.
Suhani, an enterprising lady took the loan from M/s Koramattam Finance against her gold ornaments at a simple interest of 12% per annum for 2 years. She, then, loaned 50% of the amount received from M/s Koramattam Finance, to Vishamber at the rate of 16% per annum compounded half yearly for 2 years and the remaining amount to Kalawati at the rate of 12% per annum compounded annually for 2 years. What was the approximate percentage earning of Suhani at the end of 2 years ?
Solution
Let the original amount of money i.e. Principal taken by Suhani = 2P
The amount of money that she owes back to the loan company at the end of 2 years = 2P + 0.24*2P = 2.48P
Now, she loans amount P to Vishamber.
Amount returned by Vishamber to Suhani under given conditions = $$P\cdot\left(1.08\right)^4$$ = 1.36P
She loans amount P to Kalawati.
Amount returned by Kalawati to Suhani at end of 2 years under given conditions = $$P\cdot\left(1.12\right)^2=1.2544P$$
Amount received by Suhani at end of 2 years = 1.36P +1.2544P = 2.6144P
Earning of Suhani = 2.6144P - 2.48P = 0.1344P
As she paid 0.48P for this earning of 0.1344P.
The percentage earning can be calculated as (0.1344P/0.48P)*100 = 28%
Hence the answer is Option B 28%.
A Financial Analyst estimates that the probability that the economy will experience recession in next
one year is 30%. He also believes that in case of recession, the probability that his mutual funds will
increase in value is 20%. He also believes that if there is no recession the probability that the value of
mutual funds will increase in value is 75%. Find the probability that mutualfunds value will increase.
Solution
Probability that recession will happen = 0.3 and probability that value will increase in this case = 0.2
Expected probability of mutual fund value increase in this case = 0.3*0.2 = 0.06
Probability that recession will not happen = 1 - 0.3 = 0.7 and probability that value will increase in this case = 0.75
Expected probability of mutual fund value increase in this case = 0.7*0.75 = 0.525
Hence, total expected probability that mutual fund value will increase = 0.585
The probabilities of three mutually exclusive outcomes of an
experiment $$0.25(1 — x), 0.5(1 — 2x)$$ and $$0.25(1 + 4x)$$ respectively.
Which of the following holds for the value of x ?
Solution
As all 3 are mutually exclusive, we can assume (in one extreme case) that these 3 form the entire range of probability and hence,
0.25(1-x) + 0.5(1-2x) + 0.25 (1+4x) = 1 which gives us x = 0
Hence, x is bound by 0 on one end.
Also, none of the probabilities can be negative as any event probability is atleast 0. Hence, for the second event, we can see that x cnnot be greater than 0.5
hence, x is bounded from 0 to 0.5
Two cities Mathura and Agra, 48 kms apart, are located on the bank of River Yamuna. A motor boat
goes from Mathura to Agra and returns back as soon as possible. Yamuna flows at a speed of 6 km/hr.
The motorboat completes the trip from Mathura to Agra and back in not more than 6 hours. Assuming
the motorboat does nothalt at Agra, what should be the minimum speed of motorboatin still water?
Solution
Let the river flow from Mathura to Agra. Let the speed of boat in still water be S kmph
Hence, if journey is to be done in 6 hours, then:
$$\frac{48}{S+6}+\frac{48}{S-6}=6$$
Solving this equation, we get: (S-18)(S+2) = 0 which gives us S = 18 kmph
A man, from the foot of the building P, walks towards the building Q. After walking for 2 mts, he
finds that buildings P and Q makean angle of elevation of $$60^{0}$$ and $$30^{0}$$ respectively. If building Q is
1.5 mts high, find the distance between the tops of both buildings P and Q.
Solution
The situation given in the problem can be summarised as:
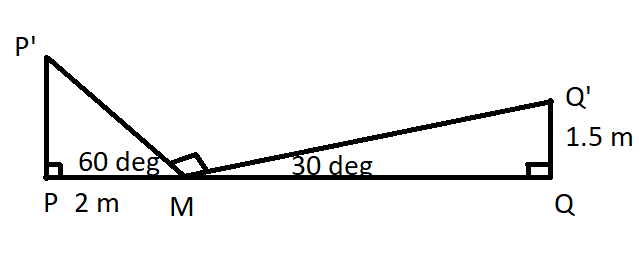
By 30-60-90 theorem, we can say that P'M = 4 meters and MQ' = 3 meters
Also, triangle P'MQ' would be a right angled triangle.
Hence, P'Q' would be the hypotenuse of length = root(16+9) = 5 meters
At what time between 10.00 AM and 11.00 AM,the minute hand and the hour hand of a watch would
make an angle of $$180^{0}$$ ?
Solution
At exactly 10 AM, angle between the two hands = 60 degrees
Applying the concept of relative velocity, we can say that the minute hand has to travel 180 - 60 = 120 degrees more at a relative velocity of 5.5 degrees/minute
Hence, time taken to make 180 degree angle between the 2 hands = 120/5.5 = 22 minutes
An owner of a grocery shop purchases two varieties of grain. The price of first variety is twice the price of the second one. He mixes both the varieties and sells the mixture at the price of Rs. 28 per kg, making a profit of 25%. If the ratio of first variety of grain and the second variety of grain in the mixture is 2:3, find the price of first variety of grain.
Solution
Let the mixture so created to be sold was exactly one kg.
Hence, amount of first variety procured to contribute to this mixture = (2/5)*1000 = 400gm or 0.4 kg
Hence, amount of second variety procured to contribute to this mixture = (3/5)*1000 = 600gm or 0.6 kg
Let the cost price of second variety = Rs. a/kg and hence, cost price of first variety = Rs. 2a / kg
Hence, cost price of the entire mixture = 0.6a + 0.4*2a = 1.4a rupees / kg
Also, the mixture is sold at Rs. 28 per kg and it means a profit of 25% ==> CP per kg = Rs. (28/1.25) per kg
Equating both, we get a = 16, hence, price of the first variety = 32 rupees per kg
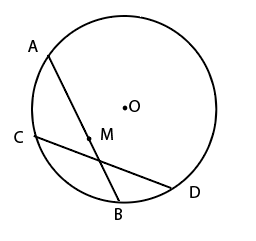
As shown in the diagram, Ram started from point A along the chord AB and Shyam started from D along the chord DC. AB and DC are two equal chords. Ram and Shyam move with the same speed and started at the same time. After some time, Ram reached "M" which is the midpoint of AB. Ram and Shyam now make an angle $$60^{0}$$ at the centre O. If the distance between Ram and Shyam is 6 m now,then how much distance each will walk before they meet each other ?
Solution
Using all the information in the question, the given figure becomes as shown below.
.png)
Since the perpendiculars from centre to chords of equal lengths are always equal, $$\triangle$$OMN becomes an equilateral triangle with MN = 6 m.
In $$\triangle$$MNP, PM = PN [by symmetry]
Thus, using the cosine rule,
$$MN^2=MP^2+NP^2-2\times MP\times NP\times cos(120)$$
$$36=MP^2+MP^2+MP^2$$
$$MP^2=12$$
$$MP=2\sqrt 3$$
Thus, each of them has to travel a distance of $$2\sqrt 3$$ m in order to meet each other.
Hence, the answer is option C.
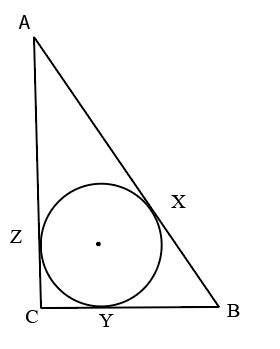
A circle is inscribed in a right angled isosceles triangle right angled at C. O is the centre of the circle which touches the sides AB, BC, and AC at X, Y, Z. If AB $$=7\sqrt{2}$$ cm, then the ratio AZ : BX : CY is:
Solution
If ACB is a right angled isosceles triangle and AB is hypotenuse with length 7*(root 2) length, then sides AC and BC = 7 cm
Now, the circle inscribed is an incircle.
Radius of in-circle = {7+7-[7*(root 2)]}/2 = $$7-\frac{7\sqrt{\ 2}}{2}$$
Now, if center of circle is marked as O, then quadrilateral OZCY is a square.
Hence, CY = CZ = $$7-\frac{7\sqrt{\ 2}}{2}$$
Hence, AZ = 7 - $$7-\frac{7\sqrt{\ 2}}{2}$$ $$=\frac{7\sqrt{\ 2}}{2}$$
Also, BX = BY and BY = BC - CY $$=\frac{7\sqrt{\ 2}}{2}$$
Hence, BX $$=\frac{7\sqrt{\ 2}}{2}$$
Hence, the given ratio becomes 1:1:[(root 2) - 1]
Saudi Aramco and Reliance Industries entered into a joint venture where Saudi Aramco invested 20 billion dollars and Reliance Industries invested 30 billion dollars. The ownership ratio is always equal to the investment ratio. After 1 year, the venture made a profit of 6 billion dollars which they reinvested. Now Reliance Industries wants to increase its ownership to 75%, how much it should pay to Saudi Aramco in billion dollars ?
Solution
The starting net worth of the venture is 50 billion dollars. After the first year profit of 6 billion dollars is reinvested, the net worth of the venture becomes 56 billion dollars. This is held in the ratio of 2:3 by Saudi Aramco and Reliance respectively.
Of this 56 billion dollars, Reliance has a claim to 3/5 th of it i.e. 33.6 billion dollars and Aramco has a claim to 2/5 th of it i.e. 22.4 billion dollars.
Now, Reliance wants to own 75% of this i.e. 3/4th of 56 billion dollars = 42 billion dollars.
To increase its stake from 33.6 to 42 billion dollars, it should pay the difference amount to Aramco i.e. 8.4 billion dollars.
Consider the equation $$(x-a)(x-b)=0$$ which has two identical roots. What should be the condition under which $$(x-a)(x-b)=c$$ has two distinct real roots ?
Solution
(x-a)(x-b) = 0 having identical roots means a = b
Hence, the expression now effectively becomes (x-a)(x-a) = c
For x to have different values, we should have c > 0 because at c = 0, we will end up with x = a AND c < 0 is not possible for rational values of a and x.
For c > 0, we will have x = a + (root c) and x = a - (root c)
A water tanker can be filled by 2 pipes A & B separately in 16 min & 32 min respectively. Outlet of
the tanker is partially open and it can empty the full tanker completely in 1 hour 4 min. Pipes A & B
were opened simultaneously for 9 min to fill the tanker but the partially open outlet was not closed.
After 9 min the pipes A & B were closed and the tanker then went to Mohan's house, 6 km away to
deliver water. If the tanker moved at a constant speed of 36 km/hr, approximately what percentage of
tanker was full, when it reached Mohan's house?
Solution
Let the tank capacity be 64 liters.
Hence, capacity of pipes A and B resp are 4 lit/min and 2 lit/min
Also, the capacity of the draining pipe = -1 lit/min
Now, when all pipes are open for 09 mins, tank filled = (4+2)*9 - (9*1) = 45 liters
Now, the tank travels for (6/36)*60 min = 10 minutes
During this time, liquid lost = 10*1 lit/min = 10 liters
Liquid left = 35 liters
hence, percentage filled = 35/64 = 55% approx
An economic survey of total 1000 participants was carried out in Delhi, Mumbai, Kolkata and Chennai about their wealth. 300 participants reported possessing both a house and a car. 500 participants reported possessing both a house and a motorbike. 200 participants reported possessing a house together with a motorbike and a car. Find the number of participants who possess both a house and car, or possess both a house and a motorbike.
Solution
From the given data, we can create the following diagram:

Hence, the required answer = 100 + 200 + 300 = 600
ABC is an isosceles triangle. BDE, EFG, GHI and IJC are four equal isosceles triangles inside ABC triangle. D and F,F and H,H and J are connected by circular arcs. The angle ABC is 30 degrees and BE is 1m. What is the area of the shaded region ?

Solution
Since $$\angle ABC=30^o$$ and $$\triangle DBE$$ is an isosceles triangle, $$\angle BDE=120^o$$
Applying the cosine rule in $$\triangle BDE$$,
$$BE^2=BD^2+DE^2-2\times BD\times DEcos(120)$$
$$1=2BD^2+BD^2$$ [since $$BD=DE$$]
$$BD=\frac{1}{\sqrt 3}$$
Thus, $$BD=DE=EF=FG=GH=HI=IJ=JC=\frac{1}{\sqrt 3}$$
Area of $$\triangle BDE=\frac{1}{2}\times BD\times DE\times sin(120)=\frac{1}{2}\times \frac{1}{\sqrt 3}\times \frac{1}{\sqrt 3}\times \frac{\sqrt 3}{2}=\frac{1}{4\sqrt 3}$$
The total area of all smaller isosceles triangles = $$4\times \frac{1}{4\sqrt 3}=\frac{1}{\sqrt 3} m^2$$
$$\angle DEF=\angle FGH = \angle HIJ=120^o$$
Thus, the total area of circular arcs = $$\pi\times (\frac{1}{\sqrt 3})^2=\frac{\pi}{3} m^2$$
Now, side $$BC=BE+EG+GI+IC=4 m$$
Using the cosine rule in $$\triangle ABC$$, we get $$AB=AC=\frac{4}{\sqrt 3}$$
Thus, Area of $$\triangle ABC=\frac{1}{2}\times \frac{4}{\sqrt 3}\times \frac{4}{\sqrt 3}\times sin(120)=\frac{4}{\sqrt 3} m^2$$
Thus, the area of the shaded region = Area of $$\triangle ABC$$ - Area of smaller isosceles triangles - Area of the circular sections
=$$\frac{4}{\sqrt 3}-\frac{1}{\sqrt 3}-\frac{\pi}{3}=\sqrt 3 - \frac{\pi}{3}$$
Hence, the answer is option C.
Read the given passage and answer the questions that follow :
The Reverend Jim Jones was the founder and leader of the People’s Temple. In 1978 Jones, facing charges of tax evasion, moved most of his one thousand followers from San Francisco to a small settlement in Guyana, which he named Jonestown. Facing a federal investigation for reported acts of child abuse and torture, Jones decided that his followers should poison their children and then themselves. They prepared vats of poison. A few people resisted; a few others shouted out their protest, but they were silenced. Following Jones’s orders, and the social pressures imposed by one another, mothers and fathers duly poisoned their children. Then they poisoned themselves. Their bodies were found arm in arm, lying together. Econs (and some economists we know) are pretty unsociable creatures. They communicate with others if they can gain something from the encounter, they care abouttheir reputations, and they will learn from others if actual information can be obtained, but Econsare not followers of fashion. Their hemlines would not go up and down exceptfor practical reasons,andties, if they existed at all in a world of Econs, would not grow narrower and wider simply as a matter of style. (By the way, ties were originally used as napkins; they actually had a function.) Humans, on the other hand, are frequently nudged by other Humans. Sometimes massive social changes, in markets and politics alike, start with a small social nudge.
Humans are not exactly lemmings, but they are easily influenced by the statements and deeds of others. (Again by the way, lemmings do not really commit mass suicide by following one another into the ocean. Our widely shared and some what defamatory beliefs about lemmings are based on an all-too-human urban legend—that is, people believe this because they are following other people. By contrast, the tale of mass suicide at Jonestown is no legend.) If you see a movie scene in which people are smiling, you are more likely to smile yourself (whether or not the movie is funny); yawns are contagious, too.
Conventional wisdom hasit that if two people live together for a long time, they start to look like each other. This bit of folk wisdom turns out to be true. (For the curious: they grow to look alike partly because of nutrition—shared diets and eating habits—but much of the effect is simple imitation of facial expressions.) In fact couples who end up looking alike also tend to be happier!
Here, we try to understand how and why social influences work. An understanding of those influences is important in our context for two reasons. First, most people learn from others. This is usually good, of course. Learning from others is how individuals and societies develop. But many of our biggest misconceptions also come from others. When social influences have caused people to have false or biased beliefs, then some nudging may help. The second reason why this topic is important for our purposes is that one of the most effective ways to nudge (for good orevil) is via social influence. In Jonestown, that influence was so strong that an entire population committed suicide. But social influences have also created miracles, large and small. In many cities, including ours, dog owners now carry plastic bags when they walk their dogs, and strolling through the park has become much more pleasant as a result. This has happened even though the risk of being fined for unclean dog walking is essentially zero. Choice architects need to know howto encourage other socially beneficial behavior, and also how to discourage events like the one that occurred in Jonestown. Social influences come in two basic categories. The first involves information. If many people do something or think something, their actions and their thoughts convey information about what might be best for you to do or think. The second involves peer pressure. If you care about what other people think about you (perhaps in the mistaken belief that they are paying some attention to what you are doing—see below), then you might go along with the crowd to avoid their wrath or curry their favor. For a quick glance at the power of social nudges,consider just a few research findings:
1. Teenage girls who see that other teenagers are having children are more likely to become pregnant themselves.
2. Obesity is contagious. If your best friends get fat, your risk of gaining weight goes up.
3. Broadcasters mimic one another, producing otherwise inexplicable fads in programming. (Think reality television, American Idol and its siblings, game shows that come and go,the rise and fall and rise of sciencefiction, and so forth.)
4. The academic effort of college studentsis influenced by their peers, so much so that the random assignments of first-year students to dormitories or roommates can have big consequences for their grades and hence on their future prospects. (Maybe parents should worry less about which college their kids go to and more about which roommate they get.)
5. Federal judges on three-judge panels are affected by the votes of their colleagues. The typical Republican appointee shows pretty liberal voting patterns when sitting with two Democratic appointees, and the typical Democratic appointee shows pretty conservative voting patterns when sitting with two Republican appointees. Both sets of appointees show far more moderate voting patterns when theyare sitting with at least one judge appointed by a president of the opposing political party.
The bottom line is that Humans are easily nudged by other Humans. Why? One reason is that we like to conform.
Identify the CORRECT statement:
1. Inaccurate nudging occurs as a result of information that tells about the socially accepted behavior.
2. Successful nudging occurs as a result of the desire to avoid disapproval of others.
3. Nudging is pluralistic ignorance that leads to peer pressure.
4. Collective behaviours in a society prevents individuals from getting fined for inappropriate actions.
Solution
In the fourth paragraph, the author says, "The first involves information. If many people do something or think something, their actions and their thoughts convey information about what might be best for you to do or think. The second involves peer pressure. If you care about what other people think about you (perhaps in the mistaken belief that they are paying some attention to what you are doing—see below), then you might go along with the crowd to avoid their wrath or curry their favor."
From this, it can be observed that people don't want society's disapproval and thus, are nudged into certain activities.
Hence, the answer is option B.
Identify the CORRECT statement:
1. Obesity is sporadic.
2. Learning from others is good as it helps in the development of individuals and societies.
3. Similar looking couples seldom apery each other’s facial expression.
4. Obesity may often be the result of information provided by peers.
Solution
The author only talks about obesity by saying, "Obesity is contagious. If your best friends get fat, your risk of gaining weight goes up."
This does not mean that obesity is sporadic [appearing at irregular intervals] or that it may be the result of information. Thus, options A and D can be ruled out.
About similar-looking couples, the author says, "but much of the effect is simple imitation of facial expressions".
Thus, option C can be rejected.
In the fourth paragraph, the author says, "Learning from others is how individuals and societies develop".
Thus, option B is true according to the passage.
Hence, the answer is option B.
Given below are four statements
Statement I: Republican appointees are conservative.
Statement II: Democratic appointees are liberal.
Statement III : Three judge panels are known for inaccurate decisions.
Statement IV : Dormitory students are better performers in college.
In light of the above statements, choose the most appropriate answer from the options given below
Solution
From the lines, "The typical Republican appointee shows pretty liberal voting patterns when sitting with two Democratic appointees, and the typical Democratic appointee shows pretty conservative voting patterns when sitting with two Republican appointees.", statements (I) and (II) are both correct.
The author says, " Federal judges on three-judge panels are affected by the votes of their colleagues." The author does not say that they make inaccurate decisions. Thus, (III) is incorrect.
About dormitory students, the author says that their scores and academics are influenced by their roommates. There is no indication of dormitory students being better performers. Thus, (IV) is incorrect.
Hence, the answer is option B.
Main idea in the passage is about:
1. Causes and prevention of mass suicide.
2. Mindset problems of some economists.
3. Contagious nature of human emotion.
4. Behavior is the result of following the herd.
Solution
Throughout the passage, the author talks about how their surroundings influence human behaviour, whether through the information believed by the mass or by peer pressure.
Mass suicide in Jonestown was only given as an example of people doing something under peer pressure and influence. Thus, A can be rejected.
Similarly, the economists' example was also given to make the above point. Thus, B can be rejected.
The author says that human behaviour can be contagious. Emotions are not in the scope of this passage.
Hence, the answer is option D.
Read the given passage and answer the questions that follow :
Cultural arguments once loomed large in explanations of the ways in which countries differed economically and politically. Economists mostly abandoned such reasoning in the 20th century, not only because it provided cover for racists but also because of its lack of explanatory power. In 1970 Robert Solow, a Nobel prize winner, quipped that attempts to explain growth with variables such as culture generally ended up “in a blaze of amateur sociology”. This position is changing, however, and not before time. A better grasp of how cultures work may be needed to understand modern political economy.
The responsible intellectual use of cultural argument begins with clear terminology. In "A Culture of Growth", published in 2016, Joel Mokyr, an economic historian at Northwestern University describes culture as a set of beliefs, values, and preferences, capable of affecting behaviour, that are socially (not genetically) transmitted and that are shared by some subset of society". Economists typically treat rational self-interest as the lodestar of human behaviour. But Mr Mokyr recognises that acquired social codes also influence individual choices, and thus broader economic activity. Culture is not immutable, as those who ascribe countries’ diverging fates to deep-rooted cultural attributes often suggest. It evolves as the ideas and influence of different groups shift.
Cultural evolution is essential to the thesis of "A Culture of Growth", which attempts to explain why sustained growth began where and when it did. Mr Mokyr says that factors often credited with kick-starting industrialisation- such as capital accumulation and the cost and supply of certain kinds of labour- may be necessary but are not sufficient. The true catalyst was a continent-wide evolution in beliefs. In Europe between the 16th and 18th centuries, a group of intellectuals often called the “Republic of Letters" groped their way towards a bold new view of nature and knowledge. Francis Bacon, an English intellectual and early contributor to the movement, thought that through disinterested and open inquiry, nature's secrets could be understood and then manipulated to the benefit of humankind. Such views helped nurture the Scientific Revolution and the Enlightenment, but also percolated through society, influencing behaviour. Once the notion became widespread that objective knowledge was possible and could be used to improve people's lives, the emergence of self-sustaining economic growth was near-inevitable.
In a recent essay Enrico Spolaore of Tufts University writes that Mr Mokyr’s ideas show how economists might make better use of culture. He does not simply argue that Europe industrializedfirst because of a particular European cultural way of being. Rather, he identifies a specific cultural change - the rise of an evidence-based, humanistic approach to scientific inquiry - which led to a shift in behaviour that enabled industrialisation. He contrasts this with, for example, China, where rationalistic schools of philosophy such as Mohism were eclipsed in intellectual circles by tradition-venerating Confucianism. China’s fate is not down to something inherent in Chinese culture. Rather, history unfolded one way in one place, and another in another.
According to Mr Mokyr’s thesis :
1. Culture affects behaviour and thus economic activity in a society.
2. Acquired social codes influence individual choices and therefore economic activity.
3. Factors usually associated with kick-starting industrialisation are not sufficient to explain economic activity.
4. All the options hold.
Solution
From the second paragraph, statements 1 and 2 can be inferred.
Statement 3 can be inferred from the line, " Mr Mokyr says that factors often credited with kick-starting industrialisation- such as capital accumulation and the cost and supply of certain kinds of labour- may be necessary but are not sufficient"
Hence, the answer is option D.

Enrico Spolaore believes:
1. A cultural change that supported scientific enquiry was behind Europe’s industrialisation
2. A rationalist school of philosophy could neverrise in Europe
3. A rationalist school of philosophy thrived in China
4. Confucianism got eclipsed by Mohism in China
Solution
In the last paragraph of the passage, the author says, "he [Enrico Spolaore] identifies a specific cultural change - the rise of an evidence-based, humanistic approach to scientific inquiry - which led to a shift in behaviour that enabled industrialisation."
Thus, statement 1 can be inferred.
Statements 2, 3 and 4 cannot be inferred from the passage.
Hence, the answer is option A.
In “A Culture of Growth” Mr Mokyr tries to analyse :
1. Why did sustained economic growth evade Europe?
2. What is the cause of crisis in the Eurozone?
3. Why did Industrial Revolution begin in Europe?
4. What social transformations are occurring in Europe today?
Solution
From the last two paragraphs, we can observe that Mr Mokyr tried to figure out how the Industrial Revolution began in Europe and what cultural changes led to it.
Hence, the answer is option C.
The following statement best captures the theme of the passage:
1. Scientific revolution and enlightenment in Europe
2. Confucianism and Mohism in China
3. History unfolds in different ways in different countries
4. A society’s values and beliefs matter for its economy
Solution
The passage explores how cultural arguments, once dismissed by economists, are regaining relevance in understanding economic and political differences between countries. It centers on Joel Mokyr’s "A Culture of Growth," which argues that sustained economic growth, particularly the Industrial Revolution, stemmed from a cultural evolution in Europe—specifically, a shift in beliefs driven by the Scientific Revolution and Enlightenment. While this shift is a key example, the broader theme is about how culture, defined as socially transmitted beliefs, values, and preferences, shapes behavior and economic outcomes. The passage contrasts Europe’s trajectory with China’s, where different cultural developments (e.g., Confucianism overtaking Mohism) led to divergent paths. Still, the focus remains on culture’s role rather than just historical divergence or specific intellectual movements.
Among the options, "A society’s values and beliefs matter for its economy" (4) best captures this overarching theme. It reflects the passage’s emphasis on culture as a dynamic, influential force in economic development, beyond just the European Scientific Revolution (1), Chinese philosophies (2), or the idea of history unfolding differently (3), which are examples rather than the central point.
Read the passage and answer the questions that follow :
To say that all individuals are embedded in and the product of society is banal. Obama rises above banality by means of fallacy: equating society with government, the collectivity with the state. Of course we are shaped by our milieu. But the most formative, most important influence on the individual is not government. It is civil society, those elements of the collectivity that lie outside government: family, neighborhood, church, Rotary club, PTA, the voluntary associations that Tocqueville understood to be the genius of America and source of its energy and freedom. Moreover, the greatest threat to a robust, autonomous civil society is the ever-growing Leviathan state and those like Obama who see it as the ultimate expression of the collective. Obama compounds the fallacy by declaring the state to be the font of entrepreneurial success. How so? It created the infrastructure— roads, bridges, schools, Internet—off which we all thrive. Absurd. We don’t credit the Swiss postal service with the Special Theory of Relativity because it transmitted Einstein’s manuscript to the Annalen der Physik. Everyone drives the roads, goes to school, uses the mails. So did Steve Jobs. Yet only he created the Mac and the iPad. Obama’s infrastructure argument is easily refuted by what is essentially a controlled social experiment. Roads and schools are the constant. What’s variable is the energy, enterprise, risk-taking, hard work and genius of the individual. It is therefore precisely those individual characteristics, not the communal utilities that account for the different outcomes. The ultimate Obama fallacy, however, is the conceit that belief in the value of infrastructure—and willingness to invest in its creation and maintenance—is what divides liberals from conservatives.
More nonsense. Infrastructure is not a liberal idea, nor is it particularly new. The Via Appia was built 2,300 years ago. The Romans built aqueducts, too. And sewers. Since forever, infrastructure has been consensually understood to be a core function of government. The argument between left and right is
about what you do beyond infrastructure. It’s about transfer payments and redistributionist taxation about geometrically expanding entitlements, about tax breaks and subsidies to induce actions pleasing to central planners. It’s about free contraceptives for privileged students and welfare without work— the latest Obama entitlement-by-decree that would fatally undermine the great bipartisan welfare reform of 1996.
What divides liberals and conservatives is not roads and bridges but Julia’s world, an Obama campaign creation that may be the most self-revealing parody of liberalism ever conceived. It’s a series of cartoon illustrations in which a functional Julia is swaddled and subsidized throughout her life by an all-giving government of bottomless pockets and “Queen for a Day” magnanimity. At every stage, the state is there to provide—preschool classes and cut-rate college loans, birth control and maternity care, business loans and retirement. The only time she’s on her own is at her grave site. Julia’s world is totally atomized. It contains no friends, no community and, of course, no spouse. Who needs one? She’s married to the provider state. Or to put it slightly differently, the “Life of Julia” represents the paradigmatic Obama political philosophy: citizen as orphan child. For the conservative, providing for every need is the duty that government owes to actual orphan children. Not to supposedly autonomous adults. Beyond infrastructure, the conservative sees the proper role of government as providing not European-style universal entitlements but a firm safety net, meaning Julia-like treatment for those who really cannot make it on their own—those too young or too old, too mentally or physically impaired, to provide for themselves.
Limited government so conceived has two indispensable advantages. It avoids inexorable European style national insolvency. And it avoids breeding debilitating individual dependency. It encourages and celebrates character, independence, energy, hard work as the foundations of a free society and a thriving economy—precisely the virtues Obama discounts and devalues in his accounting of the wealth of nations.
According to the passage, the greatest threat to the civil society is:
1. The infrastructure created by the state
2. Great and populist leaders like Obama
3. The state's role as a provider state
4. Not giving credit to the government for undertaking welfare projects
Solution
In the first paragraph, the author says, "the greatest threat to a robust, autonomous civil society is the ever-growing Leviathan state and those like Obama who see it as the ultimate expression of the collective."
The author then goes on to criticise the government as a provider state saying that it provides everything to its citizens whether they need it or not.
Considering the above-mentioned points, option C is the answer.
With reference to the passage, which of the following statements is true?
1. Liberals conceived the idea of providing infrastructure to the citizens.
2. Conservatives believe that state needs to facilitate deserving sections of society.
3. Leviathan state helps in nurturing the dreams of a free and prosperous society.
4. Hardwork and genius is constant for building a thriving society.
Solution
Statement 2 is true. From the penultimate paragraph of the passage, conservatives believe that the government should provide a safety net for those who truly cannot make it on their own (such as children, the elderly, or those with disabilities) . Therefore Option B is true.
Option A: In the third paragraph, the author says, "Infrastructure is not a liberal idea, nor is it particularly new". Thus, option A can be rejected.
Option C: This is false. The passage criticizes the idea of a "Leviathan state," which is seen as a threat to civil society and individual autonomy. It argues that a large, overreaching state is detrimental to freedom and independence.
Option D: This is not true. While the passage acknowledges the importance of individual characteristics like energy, enterprise, risk-taking, and genius, it does not claim that hard work and genius are the only constants.
The primary objective of the passage is to:
1. Praise the policy of Obama government
2. Present an argument for a provider government
3. Discuss the role and duties of a Government
4. Assess the differences between liberals and conservatives regarding their political philosophy only
Solution
The author is critical of policies of Obama. Thus, option A can be ruled out.
The author is also against the concept of a provider state. Thus, B can also be dismissed.
The difference between liberals and conservatives is only a small part of the points discussed by the author. Thus, D can also be ruled out.
Hence, the answer is option C.
According to the passage, which of the following statement is false?
1. Leviathan state is not a harbinger of prosperity.
2. Building Infrastructure is not a liberal idea.
3. European governments do not provide privileges to all.
4. Provider state debilitates individual character.
Solution
The false statement is "European governments do not provide privileges to all." This is false because the passage talks about how European governments offer many benefits to their citizens, like universal healthcare and entitlements, which are seen as privileges for all.
The other statements are true according to the passage.
Read the passage and answer the questions that follow :
As Western holiday makers escape their daily grind and head to the beach this summer, a concern is likely to resurface- literally really, if it washes up on the pristine sand in front of them. In the past two years plastic litter in the ocean seems to have eclipsed other environmental anxieties among rich-world consumers. Harrowing images of sea life ensnared in plastic bags, as depicted in “Blue Planet II”, a popular British television series from 2017 presented by Sir David Attenborough, would be enough to make anyone choke on the plastic straw in their pifia colada-if, that is, you were offered one. Politicians everywhere are responding to voters’ demands by banning straws, stirrers and other single- use plastics. The UN says that last year 127 countries had restrictions on plastic bags. This month Panama became the first Central American country to outlaw them. Britain is considering a tax on plastic packaging made with less than 30% recycled content. In March 560 members of the European Parliament backed a law that would require 90% of plastic bottles to be recycled by 2029. Just 35 voted against.
Given the environmental footprint of substitutes like cotton bags, aluminium cans or paper boxes-which often require more energy and water to make and transport than plastic equivalents- new regulations could in fact end up doing harm to the planet. Nonetheless, the plastics industry can expect ever more curbs on its products, a trend that will force businesses involved to reshape. Bottles, boxes, films and the like consume nearly half of global output of the polymers on which they rely. Many companiesin the $375bnplastic-packaging value chain-which comprises producers of oil and gas (the main feedstock), petrochemical giants packaging firms and consumer brands-look ill-prepared.
Companies either end of the chain are the least vulnerable. Beverage-makers will happily switch from oil-derived plastic to recycled stuff for their bottles-or to aluminium cans-so long as the numbers add up (which they do when high oil prices push up the cost of virgin plastic). Even so, ExxonMobil or Coca-Cola cannot relax. Seema Suchak of Schroders, an asset manager, estimates that fizzy-drinks firms that fail to reduce their reliance on virgin plastics could see annual profits shrink by 5% over the next decade or so because of regulations and taxes spurred by the consumer backlash. According to Paul Bjacek of Accenture, a consultancy, recycling all plastic packaging, rather than the 1% that is reused today could cut annual growth in demand for oil and gas from 1% to 0.5% by 2040 as recycled materials gain market share.
Plastic packaging firms could suffer more. Credit-raters at Moody's have warned that Britain's proposed tax on plastic bottles could hurt their makers by discouraging use by consumer goods companies and driving up the cost of recycled plastic, a scarce raw material as recycling rates are low. Ms Suchaklooked five big makers of plastic packaging and found that the pre-tax profits of four of them could fall by 11-33% in the medium term if they stick with virgin plastics. Amcor, an Australian giant, lists environmental concerns as the number-one risk in its latest annual report.
Then there is the petrochemicals industry. In a much-cited analysis from 2016, consultants at McKinsey calculated that the value of plastic disposed after a single use is $80bn-120bn a year. Reducing the number could benefit society but harm purveyors of virgin materials. Last year Spencer Dale, chief economist of BP, a British oil giant, estimated that more plastics regulation could reduce demand for petrochemicals by a sixth in the next 20 years. Around a quarter of the revenues of Germany's BASF DowDuPont of America come from plastic. Both could suffer.
According to the author, the plastic-related concerns in the rich countries have:
1. Overshadowed other environmental concerns
2. Created a strong lobby to resist any law that harms the interest of plastic packaging industry
3. Made plastic packaging industry to abandon the use of plastic
4. Made credit rating agencies and consultancy firms to advise the governments to not to act
Solution
In the first paragraph, the author says, "In the past two years plastic litter in the ocean seems to have eclipsed other environmental anxieties among rich-world consumers."
From this, option A can be inferred.
Option B, C and D are not mentioned in the passage.
Hence, the answer is option A.
The correct sequence in the plastic packaging value chain is:
1. Oil Companies, Petrochemical Companies, Packaging Companies, and Consumer Products Companies
2. Petrochemical Companies, Oil Companies, Packaging Companies, and Consumers Products Companies
3. Oil Companies, Petrochemical Companies, Consumer Products Companies, and Packaging Companies
4. Consumer Product Companies, Oil Companies, Petrochemicals Companies, and Packaging Companies
Solution
The answer to this question can be found in the last line of the second paragraph.
"Many companies in the $375bnplastic-packaging value chain-which comprises producers of oil and gas (the main feedstock), petrochemical giants packaging firms and consumer brands-look ill-prepared."
Thus, the correct sequence is Oil companies, Petrochemical companies, Packaging companies and Consumer brands.
Hence, the answer is option A.
The political response to the people’s environmental concern is:
1. Promote single use plastic packaging
2. Encouraging recycled plastics in packaging
3. Banning virgin plastics
4. Banning petrochemicals used in plastics
Solution
In the first paragraph, the author says, "Politicians everywhere are responding to voters’ demands by banning straws, stirrers and other single- use plastics. .... In March 560 members of the European Parliament backed a law that would require 90% of plastic bottles to be recycled by 2029".
Hence, the answer is option B.
The new regulations on Plastic Packaging could end up doing more harm to the planet because:
1. It will disrupt the plastic packaging value chain.
2. The prices of consumer products will increase.
3. Environmental footprints of substitutes is higher.
4. Recycled plastic is not safe to use.
Solution
Refer to the lines, "Given the environmental footprint of substitutes like cotton bags, aluminium cans or paper boxes-which often require more energy and water to make and transport than plastic equivalents- new regulations could in fact end up doing harm to the planet."
Hence, the answer is option C.
For the following questions answer them individually
Direction: Identify the appropriate meaning for the given root word:
Root word: Trit (as in attrition)
1. Leave
2. Rub
3. Duration
4. Together
Solution
The root "trit" is derived from the Latin word tritus, which is the past participle of terere, meaning "to rub," "to wear away," or "to grind down.
Of the given options 2. Rub would best represent its meaning.
Hence, the answer is option B.
Direction: A number of sentences are given below which, when properly sequenced, form a COHERENT PARAGRAPH. Choose the most LOGICAL ORDERofsentences from the choices given to construct a COHERENT PARAGRAPH.
A. You may create a visual memory that you can retrace, but physically you cannot experience it again.
B. Now is the only time you have.
C. Nothing is more valuable than the present moment because you can never get it back.
D. Once your past is gone, it doesn’t exist, no matter how many times you recreate it mentally.
E. The future hasn’t even arrived; but again, you keep taking yourself there mentally.
F. Tomorrow comes disguised as today and some of us don’t even notice.
1. AFCEDB
2. DEACFB
3. ABCDEF
4. BDEFCA
Solution
Among the options, only BDEFCA makes a coherent paragraph.
B introduces the topic by saying that the only time we have got is now.
D takes the discussion further by talking about the past.
E then talks about the future thus shifting the discussion towards the things to come.
F furthers the discussion about the future.
C brings the point back to the importance of the present moment.
And finally, A gives more context to the thought mentioned in C.
Hence, the answer is option D.
Given beloware four statements:
Statement I: The main purpose of the visit is to develop a closer relationship among the two countries.
Statement II: The main purpose of the visit is to develop a closer relationship between the two countries.
Statement III: Between all the magazines on the shelves, only one was of my interest.
Statement IV: Among all the magazines on the shelves, only few were of my interests.
In light of the above statements, choose the correct answer from the options given below:
1. Statement I and Statement II are correct.
2. Statement I and Statement III are correct.
3. Statement II and Statement IV arecorrect.
4. Only Statement II is correct.
Solution
For statements (I) and (II), since only two countries are mentioned, "between" is the correct preposition. Thus, sentence (II) is correct.
In statement (III), since there are a lot of magazines, "among" is the correct preposition to be used.
In statement (IV), the correct form of the second half is "only a few were of my interest".
Thus, only statement (II) is correct.
Hence, the answer is option D.
Given below are four statements:
Statement I: First we listened to the tape, then we answered some question, and at last we wrote the story.
Statement II: First we listened to the tape, then we answered some questions, and finally we wrote the story.
Statement III: We went from one restaurant to another, but all of them were full. At last we decided to buy some pizzas and take them home.
Statement IV: We went from one restaurant to another, but all of them were full. In the end we decided to buy some pizzas and take them home.
In light of the above statements, choose the correct answer from the options given below:
1. Statement I and Statement II are correct.
2. Statement I and Statement III are correct.
3. Statement II and Statement IV are correct.
4. Only Statement IV is correct.
Solution
In statement (I), since "some" is used as an adjective, the plural form of "question", i.e., "questions", should be used. Thus, it is incorrect.
Statement (II) is grammatically correct and syntactically correct.
Considering (III) and (IV), statement (IV) is a better choice as the use of "at the end" indicates the end of a process/activity.
Thus, (II) and (IV) are correct. Hence, the answer is option C.
Direction: Find the most appropriate word from the given options, which best describes the meaning provided in the question.
Meaning: The study of trains
1. Ferroequinology
2. Teratology
3. Locology
4. Locomology
Solution
"Ferroequinology" refers to the study of trains.
Hence, the answer is option A.
Teratology is the study of abnormalities or monsters.
Direction: A number of sentences are given below which, when properly sequenced, form a COHERENT PARAGRAPH. Choose the most LOGICAL ORDER of sentences from the choices given to construct a COHERENT PARAGRAPH.
A. This is doubtful.
B. Paintings made in the first half of the 18th century show the members of one clan in different tartans, and even one clansman with separate tartans for his coat, waistcoat and kilt, and it is unlikely that the clans kept strictly to particular tartans until the 19th century.
C. The oldest known painting showing Highland dress dates from about 1660, and few earlier records are reliable.
D. It is sometimes claimed that the different Scottish tartans served in ancient times to distinguish not only the different clans but also the ranks of the clansmen.
1. DACB
2. BDAC
3. BCAD
4. CBAD
Solution
D will be the starting sentence as it introduces the topic of discussion, "Scottish Tartans".
A follows D by saying that the claims mentioned in D are doubtful.
C then proceeds to explain why the claims are doubtful.
B extends the discussion in C.
Thus, the required sequence is DACB.
Hence, the answer is option A.
Use the following table :

Below given (a) and (b) explain the meaning/synonym of two words from the above table. Identify the correct matching option from the choices given below :
(a) happening suddenly for brief periods of time but not regular or continuous
(b) Impostor; Fraud; Quack
1. (a) — (ii); (b) — (ix)
2. (a) — (v); (b) — (xii)
3. (a) — (x); (b) — (vi)
4. (a) - (xv); (b) — (xiii)
Solution
"Spasmodic" means occurring or done in brief, irregular bursts. Thus, it matches with (a).
"Charlatan" refers to a person falsely claiming to have special knowledge or skill. Thus, it matches with (b).
Hence, the answer is option D.
Match each word in the left hand column with description in the right hand column which best describes its meaning/synonym:

Choose the correct option.
1. (a) - (i); (b) - (iii); (c) - (ii); (d) - (v); (e) - (iv)
2. (a) - (iii); (b) - (i); (c) - (ii); (d) - (iv); (e) - (v)
3. (a) - (ii); (b) - (v); (c) - (iv); (d) - (iii); (e) - (i)
4. (a) - (iv); (b) - (ii); (c) - (v); (d) - (i); (e) - (iii)
Solution
To "Aggrandize" means to increase the wealth or status of someone. Thus, it matches with (ii).
"Foolhardy" behaviour refers to reckless behaviour. Thus, it matches with (v).
"Obsequious" means being obedient or attentive to an excessive or servile degree. Thus, it matches with (iv).
"Nonplus" means surprised or confused. Thus, it matches with (iii).
"Propitious" means giving or indicating a good chance of success. Thus, it matches with (i).
Hence, the answer is option C.
Direction: Identify the appropriate meaning for the given root word:
Root word: Put (as in dispute/input)
1. Think
2. Pour
3: Knowledge
4. Contribute
Solution
To "dispute" means to disagree about someone's ideas/thoughts.
To give your "input" means to express your thoughts.
Thus, the best meaning of the given roots word is "Think"
Hence, the answer is option A.
Direction: A number of sentences are given below which, when properly sequenced, form a COHERENT PARAGRAPH. Choose the most LOGICAL ORDER of sentences from the choices given to construct a COHERENT PARAGRAPH.
A. A belief is a feeling of certainty about a particular thing; it’s a passive knowing.
B. All human beings are basically just belief systems.
C. Our perception of the world is rooted in our beliefs.
D. Consequently, we all view the world differently.
E. We live our lives based on the beliefs that we’ve acquired through our experiences and accumulation of knowledge.
F. These beliefs are our individual truths that build our subjective realities.
1. BAFEDC
2. CFBAED
3. ABFECD
4. EBAFDC
Solution
Sentence A will come first as it mentions the topic of discussion, "beliefs".
B furthers the conversation by connecting the beliefs to humans.
F will go next as "these beliefs" refers to the beliefs of humans mentioned in B.
E carries forward the point made in F by telling how our beliefs affect our lives.
C then talks about how our beliefs shape our perception of the world.
Finally, D finishes the passage by stating the result of the point mentioned in C.
Hence, the answer is option C.
Direction: Find the most appropriate word from the given options, which best describes the meaning provided in the question.
Meaning: The study of elections
1. Campanology
2. Psephology
3. Paleology
4. Ecclesiology
Solution
"Psephology" refers to the statistical study of elections and trends in voting.
Campanology - The study of bells.
Paleology - The study of antiquities or ancient history.
Ecclesiology - The study of churches and their architecture.
Hence, the answer is option B.
Direction: Identify the appropriate meaning for the given root word:
Root word: xyl (as in xylophone)
1. Wood
2. Strings
3. Many
4. Input
Solution
The root word comes from the Greek "Xýlon", meaning “wood”.
Hence, the answer is option A.
Given below are four statements:
Statement I: You must be pleased to hear that I’ve already got the tickets.
Statement II: You'll be pleased to hear that I’ve already got the tickets.
Statement III: I have friends who would love to stay at home, but they have to go to work.
Statement IV: I have friends who should love to stay at home, but they must go to work.
In light of the above statements, choose the correct answer from the options given below:
1. Statement I and Statement II are correct.
2. Statement II and Statement III are correct.
3. Statement II and Statement IV are correct.
4. Only Statement IV is correct.
Solution
Considering statements (I) and (II), since the speaker is informing about obtaining the tickets, the sentence should be in the future tense. Hence (II) is the correct sentence.
Considering statements (III) and (IV), "would" is the correct auxiliary verb to use as it shows a possibility, whereas should indicates an obligation, which does not suit the context of the sentence.
Thus, (II) and (III) are correct.
Hence, the answer is option B.
Use the following table :

Below given (a) and (b) explain the meaning/synonym of two words from the above table. Identify the correct matching option from the choices given below :
(a) Parody; Caricature; Ridicule
(b) Clot; Thicken; Coalesce
1. (a) - (i); (b) - (ii)
2. (a) - (vii); (b) - (i)
3. (a) - (iv); (b) - (viii)
4. (a) - (xii); (b) - (xv)
Solution
"Burlesque" refers to an absurd or comically exaggerated imitation of something, often used for parody or ridicule. This aligns with the meaning of (a): Parody; Caricature; Ridicule.
"Coagulate" means to clot, thicken, or come together as a mass, which directly corresponds to (b): Clot; Thicken; Coalesce.
Thus, the correct answer is option 2 (a - vii; b - i).
Direction: Find the most appropriate word from the given options, which best describes the meaning provided in the question.
Meaning: Cheap or inferior goods
1. Perspicuous
2. Perspicacious
3. Schlock
4. Cornucopia
Solution
a. Perspicuous: clearly expressed and easily understood.
b. Perspicacious: having a ready insight into and understanding of things.
c. Schlock: cheap or inferior goods or material
d. Cornucopia: an abundant supply
Hence, the answer is option C.
Use the following table :

Complete the crossword using words from the above table. There are more words than required.

Hints:
Across: (a) Strange or ugly in a way that’s not natural
(b) Narrow-minded; Provincial; Insular
Down: (a) Absolute; Genuine; Authentic; Actual
(b) Humorous; Light-hearted; Flippant
(c) a piece of writing or speech praising somebody/something
Choose the correct option :
1. Across : (a) - (i); (b) - (ix);
Down : (a) - (ii); (b) - (xiv); (c) - (vi)
2. Across : (a) - (viii); (b) - (iv);
Down : (a) - (iii); (b) - (xiii); (c) - (xiv)
3. Across : (a) - (viii); (b) - (v);
Down : (a) - (ii); (b) - (xi); (c) - (xiv)
4. Across : (a) - (vii); (b) - (v);
Down : (a) - (x); (b) - (xi); (c) - (xii)
Solution
Across:
(a) Strange or ugly in a way that’s not natural = Grotesque
(b) Narrow-minded; Provincial; Insular = Parochial
Down:
(a) Absolute; Genuine; Authentic; Actual = Veritable
(b) Humorous; Light-hearted; Flippant = Facetious
(c) a piece of writing or speech praising somebody/something = Panegyric
Hence, the answer is option C.
Direction: Identify the option where usage of question mark is either incorrect or can be avoided.
1. Did you try the wedges and chips?
2. Who is Walt Disney?
3. I asked if she had something in particular against the Belgian national character?
4. When did Jane leave for the market?
Solution
Option 3 is an indirect speech statement and does not require a question mark.
Hence, the answer is option C.
Direction: Identify the option where usage of question mark is either incorrect or can be avoided.
1. Guess what?
2. Have you been to Taj Mahal?
3. Did you find the people very strange?
4. What is the capital of Belgium?
Solution
Options 2, 3, and 4 are all non-rhetorical, i.e., they are all expecting an answer, whereas option 1 is a rhetorical question which is not expecting an answer. Thus, it does not necessarily require a question mark.
Hence, the answer is option A.
Direction: Identify the appropriate meaning for the given root word:
Root word: Somn(as in Somniloquy)
1. Multiple
2. More than two
3. Sleep
4. Star
Solution
The root "somn" comes from the Latin word somnus, which means "sleep."
Therefore, Option C is the correct answer.
Answer the following questions with the given information and the graphs:
There are two wholesale markets (Rajapur mandi and Sivapur mandi) in a state, where commodities are traded between buyers and sellers. Commodity A and Commodity B are traded in Rajapur mandi whereas Commodity C is traded in Sivapur mandi. First graph given below shows yearly average traded quantity of all commodities in the state. The second graph shows yearly traded quantities of Commodity A and Commodity B in the wholesale market of Rajapur mandi.

How many times, the annual traded quantity in Sivapur mandi has been approximately same as quantities traded annually of any item in Rajapur mandi?
1. 4
2. 5
3. 6
4. 7
Solution
Refer the table as follows:

We can see that produce of C is matching the amounts of A or B in any particular 5 times.
Hence, 2.
From the years given below, in which year annual percentage change in Commodity C has been lowest?
1. 2014
2. 2015
3. 2017
4. 2018
Solution
Consider the table given below

For 2014, % annual change over previous year = (-3/8)*100
For 2015, % annual change over previous year = (2/5)*100
For 2017, % annual change over previous year = (-1/3)*100
For 2018, % annual change over previous year = (-1/4)*100
We can clearly see that the lowest percent change is in 2014 at -37.5%
How many times the annual percentage change in the quantity traded of any commodity in the state is same in two consecutive years?
1. 0
2. 1
3. 2
4. 3
Solution
From the table:

We can see that % change in consecutive years is not same for any commodity in any year. Hence, 0.
How many times, the annual average traded quantity in Rajapur mandi has been lower than quantity of Commodity C traded in Sivapur mandi?
1. 3
2. 4
3. 5
4. 6
Solution
The given condition is satisfied in the following years: (Year, Avg amount in Rajapur, Avg amount in Sivapur)
2010: 350 400
2013: 750 800
2015: 550 700
2016: 500 600
2019: 350 700
Thus, the situation happens a total of 5 times.
Answer the following questions with the given information and the graph:
Alpha company uses Rex as main raw material for manufacturing Item A, Item B, Item C and Item D.
The graph below shows the proportion of items produced and price trend of Rex. Annual Res_Index of an item in a given year is measured as follows:
Res_Index of Item A in Year 2013 = Absolute Value (Production of Item A in 2013 - Production of Item A in 2012) / Absolute Value (Rex Price in 2013 - Rex Price in 2012)
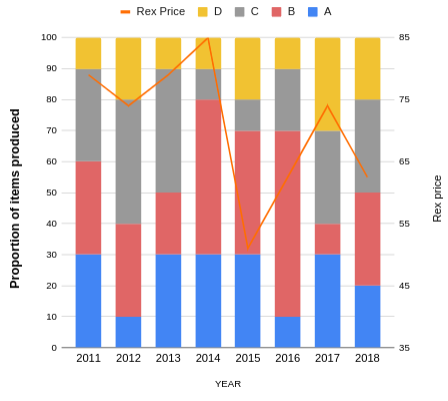

How many times proportion of an Item manufactured has not been changed in the subsequent year?
1. 9
2. 8
3. 7
4. 6
Solution
This can be easily computed by observing the bars in the graph:
For item A: 2013 to 2014, 14 to 15 i.e. 2 times
For item B: 2011-12 i.e. 1 time
For item C: 2012-13, 2014-15, 2017-18 i.e 3 times
For item D: 2013-14 i.e. 1 time
Hence, a total of 7 such instances.
In which year, Rex Price had highest percentage increase?
1. 2015
2. 2016
3. 2017
4. 2018
Solution
The prices in the respective years are:
2015 : 51
2016 : 62.5
2017 : 74
2018 : 62.5
The percentage increase in 2016 = (11.5/51)*100
The percentage increase in 2017 = (11.5/62.5)*100
Obviously, the answer becomes 2016
From the years mentioned below, in which year average Res_Index of all items manufactured was highest?
1. 2012
2. 2013
3. 2016
4. 2017
Solution
The production and price of Rex over relevant years is tabulated as follows:

The Res-Index for the different commodities has been computed and tabulated as follows

As we can see, the average Res-Index is the highest for 2012
From the years mentioned below,in which year Res_Index for item D was highest?
1. 2012
2. 2013
3. 2014
4. 2017
Solution
The Res_Index for D over the years is:
2012: Res_Index = (200-160)/(80-74) = 6.66
2013: Res_Index = (200-150)/(80-74) = 8.33
2014: Res_Index = (150-90)/(85-80) = 12
2017:Res_Index = (300-200)/(74-63) = 9.09
Thus, 2014 is the desired year.
Answer the following questions with the given information and the data:
The table given below gives the Production, Consumption and Export details of 10 products of Timbuktu Island. All that is produced is either consumed or exported. If production of any product is falling short of consumption and exports taken together, then that product is imported. There are no Storage facilities in the island.

For how many products, imports have shown increasing trend?
1. 1
2. 2
3. 3
4. 4
Solution
Imports = Consumption + Exports - Production.
Using this, the below table is created showing the imports of each product over the years.
.png)
From the table, we can observe that only products 103, 104 and 108 show an increasing trend.
Hence, the answer is option C.
For which of the following product codes, the absolute difference between average production and average consumption is least?
1. 105
2. 106
a. 107
4. 109
Solution
.png)
Thus, the minimum difference is shown by product 106.
Hence, the answer is option B.
For which of the following product codes, exports as a percentage of production, is highest in any year?
1. 107
2. 108
3. 103
4. 109
Solution
The below table gives exports as a percentage of production for the given products over the years.
.png)
Thus, the maximum percentage is shown by the product 108 in the year 2012.
Hence, the answer is option B.
For how many products were there no imports in a particular year?
1. 0
2. 1
3. 2
4. 3
Solution
Imports = Consumption + Exports - Production.
Using this, the below table is created showing the imports of each product over the years.
For 103, there were no imports in 2010.
For 107, there were no imports in 2012.
For 109, there were no imports in 109.
Thus, there were no imports for 3 products in some years.
Hence, the answer is option D.
Answer the following questions with the given information and the data:
ABC Ltd. supplies a health drink in various cities of India. The drink is available in two packs of 500 ml and 1000 ml. Samples are used for promotion of the product whereas the wastage can happen because of breakage, leakage etc. In 2018, the total of sales, samples distributed and wastage of the both pack sizes was 13380. The ratio of wastage to samples of packs of 500 ml and 1000 ml combined together, in all cities is 5:3.

What is the number of 1000 ml packs sold in Lucknow city in 2018?
1. 220
2. 250
3. 300
4. 320
Solution
From the given table, we can observe that the number of 500ml packs sold in Lucknow is 2010, and the ratio of 500ml packs to 1000ml packs sold is 6.7 : 1.
Thus, the number of 1000ml packs sold in Lucknow = $$\frac{2010}{6.7}=300$$
Hence, the answer is option C.
What is the percentage of units of both pack sizes wasted compared to distributed as samples in Chennai in 2018?
1. 125%
2. 139%
3: 141%
4. 41%
Solution
Using the given information in the table, the complete table of samples sold becomes as shown below.
.png)
Thus, the total number of samples sold = $$7250+2130=9380$$
Thus, the number of samples distributed or wasted = $$13380-9380=4000$$
The number of wasted and used samples are in the ratio $$5:3$$.
Thus, the number of waster samples = $$\frac{4000}{8}\times 5=2500$$
The number of samples used = $$4000-2500=1500$$
Now, the number of packs wasted in Chennai = $$0.1\times 2500=250$$
The number of packs distributed in Chennai = $$0.12\times 1500=180$$
Thus, the percentage of units wasted to distributed in Chennai = $$\frac{250\times 100}{180}=138.88\approx139\%$$
Hence, the answer is option B.
What is the number of units of both pack sizes distributed as samples in Jaipur city in 2018?
1. 198
2. 210
3. 223
4. 232
Solution
Using the given information in the table, the complete table of samples sold becomes as shown below.
Thus, the total number of samples sold = $$7250+2130=9380$$
Thus, the number of samples distributed or wasted = $$13380−9380=4000$$
The number of wasted and used samples are in the ratio $$5:3.$$
Thus, the number of waster samples = $$\frac{4000}{8}\times 5=2500$$
The number of samples used = $$4000-2500=1500$$
Thus, the number of units of both packs distributed in Jaipur = $$0.14\times 1500=210$$
Hence, the answer is option B.
Which of the following cities has lowest wastage compared to total units sold in the year 2018?
1. Delhi
2. Jaipur
a. Kolkata
4. Lucknow
Solution
Using the given information in the table, the complete table of samples sold becomes as shown below.
Thus, the total number of samples sold = $$7250+2130=9380$$
Thus, the number of samples distributed or wasted = $$13380-9380=4000$$
The number of wasted and used samples are in the ratio $$5:3$$.
Thus, the number of waster samples = $$\frac{4000}{8}\times 5=2500$$
The number of samples used = $$4000-2500=1500$$
.png)
Since Delhi has the lowest ratio of wasted to sold, the answer is option A.
Based on the information, answer the questions which follow:
100 families planned wedding on 21st December 2020 at 9 pm, an auspicious day and time in New Delhi and booked a marriage hall online in Chattarpur Farms. Due to a technical glitch the hall was booked simultaneously for 64 families who received a confirmation with a deposit of ₹ 1 Lakh each. The managementon identifying the glitch was troubled and contacted the families for a refund but the families were not ready to accommodate. The managementand the families then mutually agreed to have a toss in order to decide which family will be finally allotted the venue. Certain directions regarding holdingthe toss are as follows:
1. The families were allotted a number from 1 to 64 in alphabetical ascending order of their names.
2. It was further decided, Family 1 will have a toss with Family 64 andis considered as Toss 1. Toss 2 will be between Family 2 and Family 63 and Toss 3 between Family 3 and Family 62 and so on.
3. The winner of each toss moves to the next round and the winner of Toss 1 will now have a toss with winner of Toss 32, winner of Toss 2 with Toss 31 and so on.
4. The remaining rounds of toss are in ascending order i.e. winner of Toss 1 with Toss 2, winner of Toss 3 with Toss 4 and so till there is one winner.
5. It was also decided that if the final winner withdrawsand hands over the venue to the other finalist, the winner will be given ₹ 1.5 Lakh over and above the refund amount.
If family 57 is in the finals, then which family in ascending order can propose to withdraw and take an amount of 1.5 Lakh along with the refund.
1. 35
2. 47
3. 39
4. 58
Solution
The below table shows the matching of families in each round as per the given conditions.
.png)
First, we will trace the matches of 57 to find who he will replace in the final round [1 or 9].
Round 1: 8, Round 2: 25, Round 3: 7, Round 4: 5, Round 5: 1, Round 6: 9.
Thus, 57 will take the place of 1 in round 6.
Thus, we will have to check which family among the options take the place of 9.
- 35
Let’s trace the matches of 35 in all the rounds.
Round 1: 30, Round 2: 3, Round 3: 4, Round 4: 3, Round 5: 1, Round 6: 9.
Thus, 35 will also take the place of 1 round 6. Therefore, it cannot be the answer.
Similarly, we can find that 39 and 58 also take the place of 1 in round 6. Thus, they are also ruled out.
2. 47
Round 1: 18, Round 2: 16, Round 3: 15, Round 4: 13, Round 5: 9, Round 6: 1
Thus, 47 will take the place of 9 in the sixth round.
Hence, the answer is option B.
If family 51 won the toss, then with which family can they not have a toss in the finals?
1. 27
2. 24
3. 29
4. 37
Solution
The below table shows the matching of families in each round as per the given conditions.
First, we will trace all the matches of 51 in various rounds.
Round 1 against 14, round 2 against 19, round 3 against 13, round 4 against 15, round 5 against 9, and round 6 against 1.
Thus, 51 takes the place of 9 in the final round.
The family that will also take the place of 9 in the finals cannot have a toss with 51.
1. 27
Round 1 against 38, round 2 against 6, round 3 against 5, round 4 against 7, round 5 against 1, and round 6 against 9. Thus, it will take the place of 1 in the final round. Hence, it can play against 51.
Similarly, 29 and 37 can also play against 51 in the final round. Thus, all three can be ruled out.
2. 24.
Round 1 against 41, round 2 against 9, round 3 against 10, round 4 against 11, round 5 against 13, round 6 against 1.
Thus, 24 will also take the place of 9 in the final round.
Hence, 24 can never toss against 51.
Hence, the answer is option B.
From the following, which family in descending order can have the toss with Family 12 in finals?
1. 62
2. 60
3. 63
4. 61
Solution
The below table shows the matching of families in each round as per the given conditions.
Since 12 reaches the finals, we will trace its matches to see which family it replaces.
Round 1 against 53, round 2 against 21, round 3 against 11, round 4 against 9, round 5 against 13 and round 6 against 1. Thus, 12 replaces 9 in round 6.
Hence, the family facing it in the finals must replace 1 in the finals.
Since we have to calculate in descending order, let's first consider family 63.
63 plays round 1 against 2, round 2 against 31, round 3 against 1, round 4 against 3, round 5 against 5, and round 6 against 9.
Thus, 63 replaces 1 in the final round and can face 12.
Since we have to find the family in descending order and 63 satisfies the condition, the answer is option C.
If a toss was between family 9 and family 13, then one toss can be between
1. 25 and 44
2. 32 and 5
3. 23 and 46
4. 21 and 8
Solution
The below table shows the matching of families in each round as per the given conditions.
From the above table, we can see that 9 - 13 is a toss in the original matchups of the tournament.
Thus, we will check the matches for the families given in the options.
A. 44 tosses against 21, 12, 11, 9, and 13. Thus, it does not toss against 25.
B. 32 tosses against 33, 1, 2, 5 and 1. Thus, it has a toss against 5 in round 4.
Hence, the answer is option B.
Based on the information, answer the questions which follow:
In a department of a hospital, Amir, Sahil, Vaibhav and Gaurav are doctors and each of them has a duty from 9 am of Day 1 to 9 am of Day 2 for 24 hours in the same order oneafter the other. After each duty, the doctor gets an off for 3 days, including the day heis relieved from duty. For example,if Amir has a duty on Monday, his next duty will now fall on Friday and this rotation goes on.
If on $$10^{th}$$ July 2020, Gaurav was on duty, who will be on duty on $$26^{th}$$ September 2020?
1. Amir
2. Sahil
3. Vaibhav
4. Gaurav
Solution
Number of days between 10th July to 26th September = 78
The cycle of doctors gets repeated every 4 days.
Hence, Gaurav will be back on duty on 24th September (as it is 76 days from 10th July and 76 is a multiple of 4)
Hence, Sahil will be on duty on 26th September.
If on $$14^{th}$$ February 2020, Sahil was on duty, then who did the maximum number of duties in that month?
1. Amir
2. Sahil
3. Vaibhav
4. Gaurav
Solution
If Sahil is on duty on 14th Feb, then Amir was on duty on 13th Feb and Gaurav was on duty on 12th Feb and so on. From this, we can deduce that starting from Feb 1, the order of duty is: Amir-Sahil-Vaibhav-Gaurav.
From this we can see that everyone will have served for equal days till 28 Feb and then on 29th Feb (2020 being leap year), Amir will serve one more day and hence, Amir serves maximum time.
Based on the information, answer the questions which follow:
In an ICU with a capacity of 8 patients, due to COVID-19, beds were arranged in circular pattern. Thus, now at a time 8 patients can be accommodated. As a basic measure, patients are administered with an IV fluid replacement which as per medical guidelines is 25-30 ml/kg per day. A senior doctor explained to a new intern the amountof IV fluid replacement for each patient but the intern mixes up the doses. From the information given below,help the intern to administer right doses to each patient.
1. On a given day, 4 married couples were admitted to the ICU namely, A, B, C, D, E, F, G and H.
2. A, D, E and F are males and the rest are females. Males are married to females. Each patient was prescribed a replacement from among 25, 28 and 30 ml/kg not necessarily in the same order.
3. Any 2 couples do not have the same dose and are neither adjacent nor opposite to each other.
4. A, who was prescribed 30 ml/kg was opposite C while E who was prescribed 28 ml/kg was opposite G and E’s spouse wasprescribed 25 ml/kg.
5. H is married to F, while D who was not prescribed 25 ml/kg is not married to G.
6. B who was prescribed 30 ml/kg was to the immediate left of C and also to the immediate right of the spouse of C.
7. None of the 4 males receive IV replacement lower than 28 ml/kg while there is one male patient between B and their spouse.
8. A’s spouse receives a replacement of 28 ml/kg same as that of F’s spouse, who are next to each other.
Who among the following is adjacent to A?
1. D
2. G
3. B
4. E
Solution
From statements 4 and 6, A is sitting opposite C, and B is seated to the left of C and the right of C’s spouse.
From statement 7, the person to the left of C’s spouse is B’s spouse.
From statement 8, the people sitting on the left of A could only be F, A’s spouse, and F’s spouse in that order.
Thus, the arrangement becomes as follows.
.png)
From statement 5, H is F’s spouse.
From statement 4, E is sitting opposite G. The only way to do this is if E is C’s spouse. Hence, G will be A’s spouse.
The only blank space is for B’s spouse, which will be filled by D.
Thus, the final arrangement becomes as given below.
.png)
Prescriptions of patients are as follows,
From statement 4, A = 30, E = 28, and C = 25
From statement 6, B = 30
From statement 7, D = 28/30 and F = 28/30
From statement 8, G = H = 28
From the given figure, the patients sitting adjacent to A are D and F.
Hence, the answer is option A.
What is the transfusion amount for the spouse of D who weighs 80 kg?
1. 3600 ml
2. 2400 ml
3. 2500 ml
4. 2700 ml
Solution
From statements 4 and 6, A is sitting opposite C, and B is seated to the left of C and the right of C’s spouse.
From statement 7, the person to the left of C’s spouse is B’s spouse.
From statement 8, the people sitting on the left of A could only be F, A’s spouse, and F’s spouse in that order.
Thus, the arrangement becomes as follows.
From statement 5, H is F’s spouse.
From statement 4, E is sitting opposite G. The only way to do this is if E is C’s spouse. Hence, G will be A’s spouse.
The only blank space is for B’s spouse, which will be filled by D.
Thus, the final arrangement becomes as given below.
Prescriptions of patients are as follows,
From statement 4, A = 30, E = 28, and C = 25
From statement 6, B = 30
From statement 7, D = 28/30 and F = 28/30
From statement 8, G = H = 2
D's spouse is B who has the transfusion of 30ml/kg.
Since the weight of B is given as 80kg, the total transfusion amount = 30 x 80 = 2400ml.
Hence, the answer is option B.
The spouse of which person has an IV infusion of 25 ml/kg?
1. E
2. D
3. B
4. H
Solution
From statements 4 and 6, A is sitting opposite C, and B is seated to the left of C and the right of C’s spouse.
From statement 7, the person to the left of C’s spouse is B’s spouse.
From statement 8, the people sitting on the left of A could only be F, A’s spouse, and F’s spouse in that order.
Thus, the arrangement becomes as follows.
From statement 5, H is F’s spouse.
From statement 4, E is sitting opposite G. The only way to do this is if E is C’s spouse. Hence, G will be A’s spouse.
The only blank space is for B’s spouse, which will be filled by D.
Thus, the final arrangement becomes as given below.
Prescriptions of patients are as follows,
From statement 4, A = 30, E = 28, and C = 25
From statement 6, B = 30
From statement 7, D = 28/30 and F = 28/30
From statement 8, G = H = 28
E's spouse C has an IV infusion of 25ml/kg.
Hence, the answer is option A.
The transfusion amount is same for which of the following?
1. A weighing 80 kg and C weighing 70 kg
2. B weighing 50 kg and C weighing 60 kg
3. C weighing 80 kg and B weighing 60 kg
4. A weighing 50 kg and B weighing 40 kg
Solution
From statements 4 and 6, A is sitting opposite C, and B is seated to the left of C and the right of C’s spouse.
From statement 7, the person to the left of C’s spouse is B’s spouse.
From statement 8, the people sitting on the left of A could only be F, A’s spouse, and F’s spouse in that order.
Thus, the arrangement becomes as follows.
From statement 5, H is F’s spouse.
From statement 4, E is sitting opposite G. The only way to do this is if E is C’s spouse. Hence, G will be A’s spouse.
The only blank space is for B’s spouse, which will be filled by D.
Thus, the final arrangement becomes as given below.
Prescriptions of patients are as follows,
From statement 4, A = 30, E = 28, and C = 25
From statement 6, B = 30
From statement 7, D = 28/30 and F = 28/30
From statement 8, G = H = 28
For option B,
B's transfusion amount = 50 x 30 = 1500ml
C's transfusion amount = 60 x 25 = 1500ml
Hence, the answer is option B.
For the following questions answer them individually
Abeer has 14 novels. Abeer’s friend Sanjay takes 3 of them and gives 2 novels to Abeer. Abeer donates 7 novels but buys 4. Joy takes 4 novels from Abeer and gives him 5. Abeer takes one novel from Sanjay and gives to Joy in exchange for 3 more. Abeer gives those 3 novels to Sanjay and he gives Abeer a novel and a magazine. Rahul takes the magazine which Sanjay gave to Abeer and gives Abeer a textbook. Abeer gives the text book to Joy in exchange for a novel. Rahul takes the novel from Sanjay, gives it to Joy for a magazine and gives Abeer the magazine for a novel. How many textbooks does Abeer have?
1. 0
2. 1
3. 2
4. 3
Solution
In total, Abeer took part in 8 transactions.
0. Abeer had 14 novels.
1. Gave 3 and received 2 novels. Thus, Abeer had 14 - 3 + 2 = 13 novels.
2. Donated 7 and bought 4 novels. Thus, he had 13 - 7 + 4 = 10 novels.
3. Gives 4 to Joy and takes 5. Thus, he had 10 - 4 + 5 = 11 novels.
4. Gets 3 from Joy. Thus, he had 11 + 3 = 14 novels.
5. Gives 3 to Sanjay and gets 1 novel and 1 magazine. Thus, he had 14 - 3 + 1 = 12 novels and 1 magazine.
6. Gives the magazine to Rahul in exchange for a textbook. Thus, he had 12 novels and 1 textbook.
7. Gives the textbook to Joy and takes a novel. Thus, he had 12 + 1 = 13 novels.
8. Gives Rahul a novel and gets a magazine. Thus, he had 13 - 1 = 12 novels and 1 magazine.
Thus, Abeer does not have any textbooks.
Hence, the answer is option A.
If ‘Ola bae mare’ means Girlis pretty, ‘sou ola may’ means Raj is handsome, ‘Sab rib may’ means All are handsome, ‘To joy bae’ means Mom was pretty. Then which word stands for Girl?
1. Mare
2. Ola
3. Bae
4. Joy
Solution
From statement 1 and 2, we have: is = ola
From statement 1 and 3, we have: pretty = bae
Hence, in statement 1 we are left only with girl = mare
Five vegetables are placed in a row in a grocery store. Carrot is at the extreme left and adjacent to Cucumber. Tomato and Cucumber are not placed together. Onion and Capsicum are placed together but Onion is not next to Tomato. Which of the vegetables are at the extreme ends?
1. Carrot and Tomato
2. Carrot and Onion
3. Cucumber and Capsicum
4. Capsicum and Tomato
Solution
Carrot is at the extreme left and adjacent to Cucumber. The arrangement is shown below
Carrot, Cucumber, _ , _ , _
Tomato and Cucumber are not placed together. So tomato should not be at third position. Tomato will be at either fourth or fifth position. The two possibilities are shown below
Carrot, Cucumber, _ , Tomato , _ .....(1)
Carrot, Cucumber, _ , _ , Tomato .....(2)
Onion and Capsicum are placed together but Onion is not next to Tomato. Onion and Capsicum should be together which is not possible in possibility(1). Hence possibility(1) is eliminated. Since Onion is not next to Tomato, Onion should be placed at third position and Capsicum at fourth in the possibility(2). Therefore, the final arrangement is
Carrot, Cucumber, Onion, Capsicum, Tomato
$$\therefore\ $$Carrot and Tomato are at the extreme ends.
In an organization with 70 employees, 30 are females and 30 employees are married. 24 employees hold a graduation degree. 19 married employees are graduates of which 7 are males. 12 males are graduates while 15 males are married. How many unmarried graduate females are employed in the organization?
1. 3
2. 5
3. 0
4. 1
Solution
Using the given information, the following table can be created.
.png)
We are told that the total number of employees with a graduation degree is 24.
The number of graduate males = married + unmarried = 7 + 5 = 12.
The number of married graduated females = 12.
Thus, the 24 graduated employees are among the male employees and married graduate female employees.
Thus, the number of unmarried graduate females = 0.
Hence, the answer is option C.
Logistic Performance Index is published by which organisation ?
1. World Economic Forum
2. Asian Development Bank
3. World Trade Organisation
4. World Bank
The needle on a compass constantly sways between true north and magnetic north. The angle between true north and magnetic north is known as :
1. Inclination
2. Declination
3. Fluctuation
4. Demarcation
The Global Multidimensional Poverty Index (MPI)is released by -
1. World Economic Forum
2. World Bank
3. Oxford Poverty and Human Development Initiative
4. Innovations for Poverty Action
Beyond the Last Blue Mountain’’ is the autobiography of which businessman ?
1. Kishore Biyani
2. JRD Tata
3. Ratan Tata
4. Dhirubhai Ambani
Name of which ofthe following car brand means ‘‘Shark’’ ?
1. Alturas
2. Marazzo
3. Seltos
4. Tigor
Priyanca Radhakrishna, is the first-ever Indian-origin minister in which country?
1. New Zealand
2. Australia
3. United Kingdom
4. Fiji
Which of the following country is not a member of ASEAN ?
1. Thailand
2. Bangladesh
3. Vietnam
4. Myanmar
Birdie and Eagle are two terms related to which of the following sports ?
1. Polo
2. Golf
3. Chess
4. Billiards
Choose the correct option about Tubarial gland:
A. Discovered at Netherland Cancer Institute
B. They are fourth pair of Salivary Glands
C. Will benefit patients with Liver and Pancreatic cancer
D. Its length is 3.5 mm
1. A, B, and C are correct.
2. B, C, and D are correct.
3. Only B andC are correct.
4. Only A and are correct.
World Economic Forum was founded by:
1. Klaus Schwab
2. Milton Friedman
3. John Maynard Keynes
4. Friedrich Von Hayek
Match the country with its Leader.

1. (a)-(iv), (b)-(i), (c)-(iii), (d)-(iii)
2. (a)-(ii), (b)-(i), (c)-(iv), (d)-(iii)
3. (a)-(iv), (b)-(iii), (c)-(ii), (d)-(i)
4. (a)-(i), (b)-(ii), (c)-(iii), (d)-(iv)
Kho Kho,a popular sport played in India, has been part of which of the following Games?
1. Asian Games
2. South Asian Games
3. Olympics
4. Commonwealth Games
Match the movie with the personality on whose life it is based.

1. (a)-(iv), (b)-(ii), (c)-(i), (d)-(iii)
2. (a)-(ii), (b)-(iii), (c)-(iv), (d)-(i)
3. (a)-(iv), (b)-(i), (c)-(iii), (d)-(ii)
4. (a)-(i), (b)-(ii), (c)-(ii), (d)-(iv)
Which social media platform has received approval from the National Payments Corporation of India (NPCI),to enter UPI market?
1. Telegram
2. WhatsApp
3. WeChat
4. Facebook Messenger
Match List I with List II.

Choose the correct answer from the options given below:
1. A - III, B- I, C-IV, D-II
2. A - III, B-IV, C - I, D-II
3. A - III, B - II, C- I, D- IV
4. A - III, B- II, C-IV,D-I
Match List I with List II.

Choose the correct answer from the options given below:
1. A- III, B-I,C- II, D-IV
2. A-IV,B- III, C-II, D-I
3. A-IV,B- II, C-I, D - III
4. A-III, B-II,C-IV,D-I
The following Quad navies participated in the second phase of Malabar exercise that took place in the Arabian Sea in November, 2020:
1. India, US, Japan and Australia
2. Russia, India, France, Japan
3. US, Australia, China, Korea
4. Finland, Russia, Iran, US
Which nation has formally exited the Paris Climate Agreement?
1. India
2. Australia
3. United States of America
4. Russia
Ngultrum is the currency of —
1. Kingdom of Thailand
2. Republic of Nepal
3. Republic of Bhutan
4. Kingdom of Cambodia
Which country has the largest labour force in the world?
1. India
2. China
3. USA
4. Brazil

