Answer the following questions with the given information and the graph:
Alpha company uses Rex as main raw material for manufacturing Item A, Item B, Item C and Item D.
The graph below shows the proportion of items produced and price trend of Rex. Annual Res_Index of an item in a given year is measured as follows:
Res_Index of Item A in Year 2013 = Absolute Value (Production of Item A in 2013 - Production of Item A in 2012) / Absolute Value (Rex Price in 2013 - Rex Price in 2012)
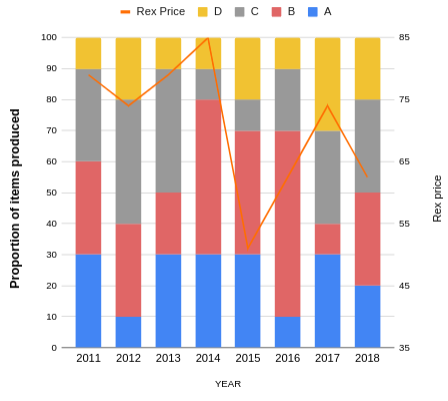

From the years mentioned below, in which year average Res_Index of all items manufactured was highest?
1. 2012
2. 2013
3. 2016
4. 2017
Solution
The production and price of Rex over relevant years is tabulated as follows:

The Res-Index for the different commodities has been computed and tabulated as follows

As we can see, the average Res-Index is the highest for 2012
Get AI Help
Create a FREE account and get:
- All Quant Formulas and shortcuts PDF
- 170+ previous papers with solutions PDF
- Top 5000+ MBA exam Solved Questions for Free

IIFT Quant Questions | IIFT Quantitative Ability
IIFT DILR Questions | LRDI Questions For IIFT
IIFT Verbal Ability Questions | VARC Questions For IIFT
Free IIFT Quant Questions
Book Free CAT Mentorship
Get personalized CAT strategy from a 99%iler
500+ students mentored
OTP Verification
Enter the 6-digit code sent to your phone
Booking Summary
Enter OTP
Didn't receive the OTP?


