GHF : CDB :: EFD : ?
IIFT 2016 Question Paper
Based on the figure given below, the relationship of the terms to the terms to the right of :: is same as that on the left. Find the missing terms.

Solution
In the first pair, the line CD in the second term extends to point G of the first term. Similarly, the line either IH or AB extends to point E of the first term in the second pair. Hence ABJ is the answer.
HNP : PDA :: DLP : ?
Solution
All set of vertices are in relation to P, the central point in the diagram.
In the 1st pair: The second term is a triangle formed with the lines passing through P and the points adjacent to N and H on either side of triangle PNH, that is, FA and ID. Hence the 2nd term in the 1st term is PDA. Similarly, point adjacent to D is M (on MJ), and that to L is B(on BG), the required triangle will be PGJ or PJG.
AKJO : IOHN :: ? : CLBK
Solution
I is anti-clockwise next to vertex A. O is analogous to K. H is anti-clockwise to O analogous to J being so to K. O is anti-clockwise to J analogous to N being so to H.
Similarly, C is anti-clockwise next to vertex E. L is analogous to M. B is anti-clockwise to L analogous to D being so to M. K is anti-clockwise
to B analogous to L being so to D.
BPM : GNJ :: ? : AKD
Solution
G and N are points on the line BP extended. J is the point on the line MP extended. Similarly, A and K are points on the line FP extended. D is the point on the line OP extended. The required term is OPF and FPO.
Read the information provided and answer the questions which follow.
In one of the islands of Neverland, people from two tribes exist namely A and B. On the island there is no other tribe except these two. The activities of these tribes are governed by rigid norms and are strictly obeyed for marriages. The norms are:
1.The people of one tribe cannot marry any other member of their own tribe though they can marry people from other tribe.
2.After being married, each male member ceases to be a member of that tribe in which he was born and becomes the member of the tribe to which his wife belongs.
3.The females continue to remain members of the tribe in which they were born even after marriage.
4.On birth, the child becomes the member of the mother’s tribe.
5.The males become members of the tribe in which they were born when they become divorcee or widower.
6.As per norms, nobody can have more than one spouse at a given point of time.
A female in tribe B can have
a. Maternal Grandmother born in tribe A
b. Paternal Grandmother born in tribe A
Solution
A female, say F, born in tribe B, will have a father born in tribe A and a mother born in tribe B. Thus, F's maternal grandmother will be from tribe B, and their paternal grandmother will be from tribe A.
Hence, only the statement b can be true, and the correct answer is option B.
A boy born in tribe B
Solution
A boy born in tribe B, can only marry a girl of tribe A, his children would be of tribe A, his daughter-in-law would be of tribe B, and his son, if divorced, will belong to tribe A. Hence options A, B and D are incorrect.
Which of the following marriages are not permissible as per norms
Solution
Option A: The widower will go back to his original tribe and can marry his wife's sister that is in the opposite tribe.
Option B: Since the divorced husband will be of the opposite tribe, the widow can marry the man.
Option C: A woman cannot marry her maternal uncle because both of them belong to the same tribe. Only option C is not permissible.
Option D: Since his brother once married the girl, the girl must be in tribe B and this too is permissible.
Therefore, Option C is the correct answer.
On the basis of the information provided, answer the questions below.
Six friends Ana, Belle, Cinderella, Diana, Elsa and Ferida are sitting on the ground in a hexagonal shape discussing their trades i.e. cook, hairdresser, washerwoman, tailor, carpenter and plumber. All the sides of the hexagon are of the same length. The seating arrangement is subject to following conditions.
1.Ana is not adjacent to the hairdresser or Cinderella
2.The tailor is not adjacent to Cinderella or Elsa but adjacent to Ana.
3.Hairdresser and Cinderella are adjacent to each other.
4.Plumber is in the middle of tailor and Cinderella in a clockwise direction.
5.Cook is adjacent to the Carpenter who is adjacent to Belle in an anti-clockwise direction.
6.Ferida is a plumber and Elsa is adjacent the cook.
7.In a clockwise direction, the washerwoman is followed by the hairdresser
Who is at the same distance from Diana as carpenter is from Diana?
Solution
The plumber (Ferida) is in the middle of the tailor, and Cinderella is in a clockwise direction. Thus we get Ana opposite of Cinderella.
The hairdresser is to the left of the washerwoman in a clockwise direction. As Ana is not adjacent to hairdresser, the hairdresser has to be second to the right of Ana, with the washerwoman (Cinderella) to the right of the hairdresser. Bella, the carpenter and the cook sit in the same order in an anti-clockwise direction. The only possible arrangement is that Ana is the cook, Elsa is the carpenter, and Bella is the hairdresser.

If one neighbour of cook is Elsa, who is the other?
Solution
The plumber (Ferida) is in the middle of the tailor, and Cinderella is in a clockwise direction. Thus we get Ana opposite of Cinderella.
The hairdresser is to the left of the washerwoman in a clockwise direction. As Ana is not adjacent to hairdresser, the hairdresser has to be second to the right of Ana, with the washerwoman (Cinderella) to the right of the hairdresser. Bella, the carpenter and the cook sit in the same order in an anti-clockwise direction. The only possible arrangement is that Ana is the cook, Elsa is the carpenter, and Bella is the hairdresser.
What are the trades of Diana and Elsa?
Solution
The plumber (Ferida) is in the middle of the tailor, and Cinderella is in a clockwise direction. Thus we get Ana opposite of Cinderella.
The hairdresser is to the left of the washerwoman in a clockwise direction. As Ana is not adjacent to hairdresser, the hairdresser has to be second to the right of Ana, with the washerwoman (Cinderella) to the right of the hairdresser. Bella, the carpenter and the cook sit in the same order in an anti-clockwise direction. The only possible arrangement is that Ana is the cook, Elsa is the carpenter, and Bella is the hairdresser.
Who is sitting opposite to the plumber?
Solution
The plumber (Ferida) is in the middle of the tailor, and Cinderella is in a clockwise direction. Thus we get Ana opposite of Cinderella.
The hairdresser is to the left of the washerwoman in a clockwise direction. As Ana is not adjacent to hairdresser, the hairdresser has to be second to the right of Ana, with the washerwoman (Cinderella) to the right of the hairdresser. Bella, the carpenter and the cook sit in the same order in an anti-clockwise direction. The only possible arrangement is that Ana is the cook, Elsa is the carpenter, and Bella is the hairdresser.
On the basis of the information provided, answer the questions below.
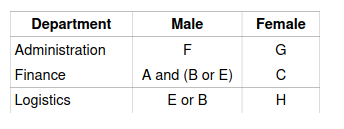
A, B, C, E, F, G and H are 7 employees in an organisation working in different departments of Administration, Finance and Logistics. There are at least two employees in each department. Out of these 7, 3 are females and one is in each department. Each employee gets a different salary. F works in Administration and his only other colleague G earns the maximum. C, the least earner works in Finance. B and E are brothers and are not in the same department. A, husband of H, works in Finance and earns more than F, B and E. The wife in the couple earns more than the husband.
In which of the department, does a group of 3 work?
Solution
Atleast two out of seven work in one of the three departments, which implies that almost three work in a department.
F is in administration and his only other colleague is G, implies F has only one colleague. Thus the administration department comprises only two persons.
A, in finance, is the husband of H. C, lowest earner, works in finance. B and E are brothers. we now know B, E, A and F are male. H,C (in finance) and G (in administration) are females. Thus H has to be in Logistics. One of the brothers of B and E work in the logistic department. The other must work in finance department.
G is the highest earner and C is the lowest earner. H earns more than A. A earns more than F, B and E. The relation between salaries of F, B and E are not given.
Salaries: G>H>A>_>_>_>C
Which of the following statement is true?
Solution
Atleast two out of seven work in one of the three departments, which implies that almost three work in a department.
F is in administration and his only other colleague is G, implies F has only one colleague. Thus the administration department comprises only two persons.
A, in finance, is the husband of H. C, lowest earner, works in finance. B and E are brothers. we now know B, E, A and F are male. H,C (in finance) and G (in administration) are females. Thus H has to be in Logistics. One of the brothers of B and E work in the logistic department. The other must work in finance department.
G is the highest earner and C is the lowest earner. H earns more than A. A earns more than F, B and E. The relation between salaries of F, B and E are not given.
Salaries: G>H>A>_>_>_>C
In descending order of income, H is at which position?
Solution
Atleast two out of seven work in one of the three departments, which implies that almost three work in a department.
F is in administration and his only other colleague is G, implies F has only one colleague. Thus the administration department comprises only two persons.
A, in finance, is the husband of H. C, lowest earner, works in finance. B and E are brothers. we now know B, E, A and F are male. H,C (in finance) and G (in administration) are females. Thus H has to be in Logistics. One of the brothers of B and E work in the logistic department. The other must work in finance department.
G is the highest earner and C is the lowest earner. H earns more than A. A earns more than F, B and E. The relation between salaries of F, B and E are not given.
Salaries: G>H>A>_>_>_>C
For the following questions answer them individually
The diagram below, explains which of the given relationship

Solution
Let us evaluate the options.
Option A:
Judge, thief, criminal
All thieves are criminals. Therefore, the circle representing thieves must be completely present within the circle representing criminals. No such circle is present in the given image. Therefore, we can eliminate option A.
Option B:
Tea, coffee, beverages
Tea and coffee are beverages. Tea and coffee must be represented by 2 non-intersecting circles. These 2 circles must be present completely within a larger circle. Therefore, we can eliminate option B as well.
Option D:
Cabinet, minister, home-minister
Ministers are present in the cabinet. Home-minister is minister who holds a particular portfolio (looks after internal affairs). Therefore, option D should be represented by 3 concentric circles. We can eliminate option C as well.
Option C:
Males, Fathers, Doctors
All fathers must be males. Therefore, the circle representing fathers must be present entirely within the circle representing the males. Some males and some fathers are doctors. Males, who are not fathers, can be doctor as well. Females can be doctors as well. Therefore, the circle representing doctors should intersect the circles representing both males and fathers. These things are represented perfectly by the given diagram and hence, option C is the right answer.
Insert the missing number
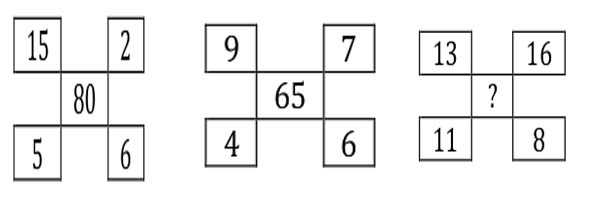
Solution
Middle number = (Difference between the numbers written on left hand side)*(Sum of the numbers written on right hand side)
80 = (15 - 5)*(2 + 6)
65 = (9 - 4)*(7 + 6)
Therefore, ? = (13 - 11)*(16 + 8) = 2*24 = 48.
Hence, option B is the correct answer.
In the following question, one term in the number series is wrong. Find out the wrong term.
10, 26, 74, 218, 654, 1946, 5834
Solution
The logic used in the given series is as follows:
10*3 - 4 = 30 - 4 = 26
26*3 - 4 = 78 - 4 = 74
74*3 - 4 = 222 - 4 = 218
218*3 - 4 = 654 - 4 = 650
650*3 - 4 = 1950-4 = 1946
1946*3 - 4 = 5838 - 4 = 5834
As we can see, 654 is the incorrect term in the series. 650 should have been there instead of 654. Therefore, option A is the right answer.
In the question below, three incomplete rows of letters/numerals are given which correspond to each other in some way. Find the letters/numerals which come in the vacant places marked by “?”
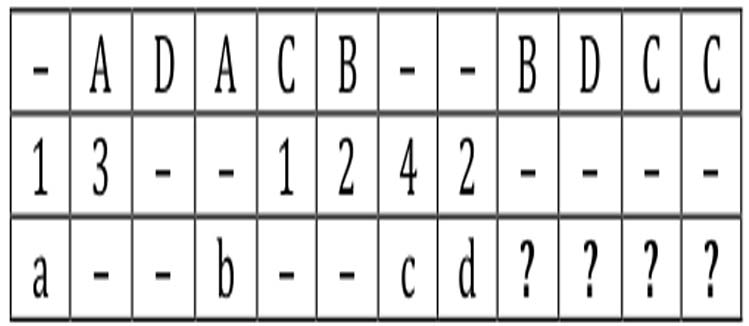
Solution
In Row 1, 2 and Column 5, 6: We can see that corresponding value for letter C and B are 1 and 2 respectively.
In Row 2, 3 and Column 1, 8: We can see that corresponding value for numeric 1 and 2 are 'a' and 'd' respectively.
Hence, we can say that corresponding value in row 3 for letter C and B are 'a' and 'd' respectively.
Hence, the code for B, D, C, C will be of 'd', _, 'a', 'a'. type. Where '_' can be filled by any letter. Hence, option D is the correct answer.
Choose the conclusion which logically follow from the given statement irrespective of commonly known facts.
Statement : All branches are leaves as well as flowers.
All leaves are flowers but not branches.
Conclusion :
I. All branches are leaves
II. All leaves are branches
III. All flowers are branches
IV. Some leaves are branches
Solution
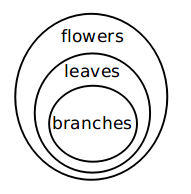
From the venn diagram, we can see that only conclusions I and IV follow.
Hence, option B is the correct answer.
On the basis of the information provided, answer the questions below.
Eight doctors P, Q, R, S, T, U, V and W of the same family i.e. father, mother, father’s sister, mother’s brother, 2 daughters and 2 sons visit a clinic every day for one hour each except on Monday which is a holiday. The timings are 9 am to 1 pm and 2 pm to 6 pm, with lunch time from 1 pm to 2 pm. Each has a different specialisation namely Cardiologist, Orthodontist, Neurologist, Paediatrician, Gynaecologist, Urologist, Radiologist and General Physician.
1.No doctor visits the clinic before doctor Q and after doctor U.
2.The Orthodontist visits right after lunch and is followed by R who is a female.
3.The mother comes in at the same place before lunch as the younger son P after lunch.
4.The General Physician is the sister of Urologist’s father and is last to visit before lunch.
5.The Cardiologist is the first while the elder daughter is the last to visit.
6.T is the mother’s brother of U and visits between the father and mother.
7.Before 1 pm, V comes after the Radiologist, who is second to visit during the day
8.S, the mother comes at 11 am after the father.
9.The Neurologist is at the same place after lunch as the Gynaecologist before lunch and comes right after Urologist.
The General Physician is a ____________ and comes at ___________
Solution
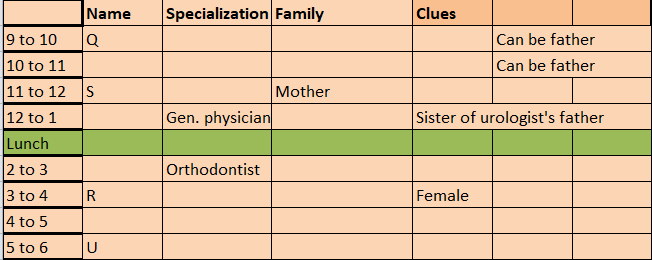 The above table can be formed after Conditions 1,2,5,8.
After incorporating the conditions 3,4,6,7 the below table can be formed.
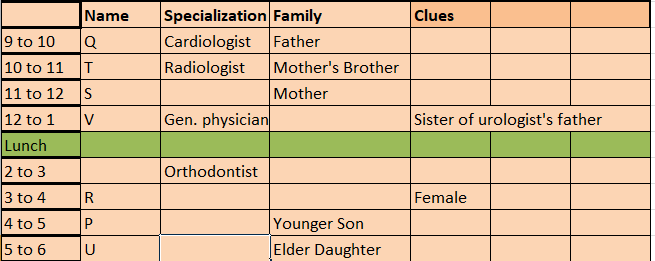
After adding the remaining conditions, the full table is obtained.
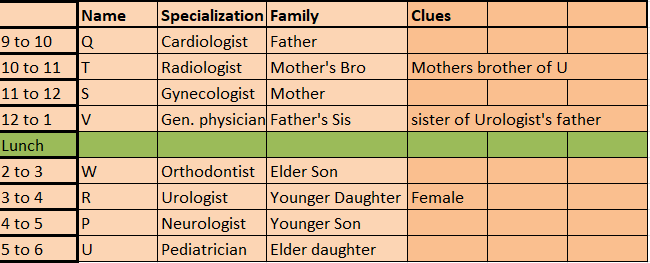
Hence the correct answer is option B
R is a _________ by specialization and is Cardiologist’s __________
Solution
The above table can be formed after Conditions 1,2,5,8.
After incorporating the conditions 3,4,6,7 the below table can be formed.
After adding the remaining conditions, the full table is obtained.
Hence the correct answer is option D
If lunch break and subsequent working hours are reduced by 15 minutes on Wednesday, then Doctor U who is _________ and Cardiologist’s __________ will reach the clinic at _______
Solution
The above table can be formed after Conditions 1,2,5,8.
After incorporating the conditions 3,4,6,7 the below table can be formed.
After adding the remaining conditions, the full table is obtained.
If the timing is reduced by 15 minutes, then the Pediatrician would reach hospital by 4
After receiving the disturbing news of falling standards the Supreme Council of Confederation of five Kingdoms is considering to conduct joint entrance examination for all student in these kingdoms for Vaidya Ratna course. As a first step, it has been decided to review the past five years data about the individual entrance examination of the kingdoms so that an appropriate action can be taken. Study the table given below and answer the questions.

What is the overall pass percentage from Anga Kingdom for all the years together?
Solution
Pass Percentage = ( No of students who passed the examination / No of students who appeared for the examination)*100
=(850+770+1200+750+1190/5000+5500+6000+5000+7000)*100
=(4760/28500)*100
=16.7
In which of the following years, total number of candidates passed from all the kingdoms is lowest?
Solution
Total number of candidates passed from all the kingdoms combined in the year 2012 = 850+640+468+780+765 = 3503
Total number of candidates passed from all the kingdoms combined in the year 2013 = 770+810+275+1120+595 = 3570
Total number of candidates passed from all the kingdoms combined in the year 2014 = 1200+1235+266+715+810 = 4226
Total number of candidates passed from all the kingdoms combined in the year 2015 = 750+880+275+935+520 = 3360
We can see that out of the given option, in the year 2015 the number of students passed from the all kingdoms combined is the lowest.
In which of the following years, Banga Kingdom recorded highest pass percentage?
Solution
Pass Percentage = (Number of students passed/Number of students appeared)*100
For 2012, Pass Percentage = (640/4000)*100 = 16
For 2013, Pass Percentage = (810/4500)*100 = 18
For 2014, Pass Percentage = (1235/6500)*100 = 19
For 2016, Pass Percentage = (660/6000)*100 = 11
Clearly, Banga recorded highest pass percentage in 2014.
What is the overall pass percentage of all the kingdoms in the year 2013?
Solution
Total no of students passed in 2013 = 770+810+275+1120+595 = 3570
Total no of students appeared in 2013 = 5500+4500+2500+8000+3500 = 24000
Overall pass percentage of all kingdoms in 2013 = (Total no of students passed in 2013 / Total no of students appeared in 2013) *100
= (3570/24000)*100
= 14.875 = 14.88 (Rounded off)
Highest number of candidates passed are from which of the following kingdoms for all the years together?
Solution
Total no of candidates passed from Anga Kingdoms for all years = 850+770+1200+750+1190 = 4760
Total no of candidates passed from Banga Kingdoms for all years = 640+810+1235+880+660 = 4225
Total no of candidates passed from Gandhar Kingdoms for all years = 765+595+810+520+1200 = 3890
Total no of candidates passed from Dwarka Kingdoms for all years = 780+1120+715+935+1330 = 4880
Hence, Dwarka is the kingdom with highest number of candidates passed.
T-Nation, a T-shirt manufacturing company has unleashed 5-5-5 strategy, five brands (Ultimate Supreme, Smash, Paramount, Astute), five sizes, (S, M, L, XL, XXL), and five Stores (S1, S2, S3, S4, S5) to capture New Delhi market. Number of T-Shirts in each of the store is given in the stacked bar chart below.

Note: Visibility of a brand in a store is given by number of T-Shirts of the brand in the store by total number of T-Shirts in the store. Visibility across the stores is measured by sum of the scores of visibility of a brand in a store.
Which brand of T-Shirt has more visibility across the stores?
Solution
Visibility of a brand in a store = Total number of T shirts of the brand/Total no of T shirts in the store
Visibility across the stores = Sum of the scores of visibility of a brand in a store
Total no of T shirts in store 1 = 111+69+85+128+57 = 450
Total no of T shirts in store 2 = 48+116+137+55+84 = 440
Total no of T shirts in store 3 =91+50+30+79+30 = 280
Total no of T shirts in store 4 = 30+101+60+111+48 = 350
Total no of T shirts in store 5 = 80+105+108+65+122 = 480
Visibility of Astute across stores = (111/450) + (48/440) + (91/280) + (30/350) + (80/480) = 0.933
Visibility of Supreme across stores = (128/450) + (55/440) + (79/280) + (111/350) + (65/480) = 1.144
Visibility of Paramount across stores = (69/450) + (116/440) + (50/280) + (101/350) + (105/480) = 1.1
Visibility of Smash across stores = (85/450) + (137/440) + (30/280) + (60/350) + (108/480) = 1.06
Supreme has highest visibility across stores.
Which brand has lowest visibility score in any of the stores?
Solution
Visibility of a brand in a store = Total number of T shirts of the brand/Total no of T shirts in the store
Visibility across the stores = Sum of the scores of visibility of a brand in a store
Total no of T shirts in store 1 = 111+69+85+128+57 = 450
Total no of T shirts in store 2 = 48+116+137+55+84 = 440
Total no of T shirts in store 3 =91+50+30+79+30 = 280
Total no of T shirts in store 4 = 30+101+60+111+48 = 350
Total no of T shirts in store 5 = 80+105+108+65+122 = 480
Visibility of Astute in
store 1 = (111/450) , store 2 = (48/440) = 0.1091, store 3 = (91/280), store 4 = (30/350) = 0.0857, store 5 = (80/480)
Visibility of Supreme in
store 1 = (128/450), store 2 = (55/440), store 3 = (79/280), store 4 = (111/350), store 5 = (65/480) = 0.1354
Visibility of Paramount in
store 1=(69/450), store 2= (116/440), store 3 = (50/280), store 4 =(101/350), store 5 = (105/480)
Visibility of Smash in
Store 1 = (85/450) store 2 = (137/440), store 3 = (30/280)0.1071 , store 4 = (60/350), store 5 = (108/480)
Visibility of Ultimate in
Store 1 = (57/450)=0.1267 store 2 = (84/440), store 3 = (30/280), store 4 = (48/350), store 5 =(122/480)
In store 1,Ultimate has lowest visibility.
In store 2, Astute has lowest visibility.
Comparing lowest visibility from each store, visibility of Astute in store 4 is the lowest.
Suppose, size M constitutes 22% of all the T-Shirts owned by T-nation. It is also given that ‘size M T-shirt’ in stores 1, 2 and 5 are 10% of the total T-shirts in these stores. Then, the total number of T-Shirts of size M in store 4 cannot be less than
Solution
Total number of T shirts in all stores = 450+480+440+280+350 = 2000
Number of T shirts of size M = 2000*22/100 = 440
Total no of T shirts in store 1 = 111+69+85+128+57 = 450
Total no of T shirts in store 2 = 48+116+137+55+84 = 440
Total no of T shirts in store 5 = 80+105+108+65+122 = 480
Number of T shirts of size M in store 1,2 and 5 = (450+440+480)*10/100 = 137
T shirts of size M in store 3 and 4 = 440 -137 = 303
The number of T shirts of size M will be minimum in store 4 if the number of T shirts of size M will be maximum in store 3.
The number of T shirts of size M in store 3 = 280 (if all T shirts in store 3 are size M)
The number of T shirts of size M in store 4 = 303-280 = 23

What is the approximate share of Supreme brand in all stores together?
Solution
Total number of T shirts in all stores = 450+480+440+280+350 = 2000
Number of T shirts of supreme brand in all stores = 128+55+79+111+65 = 438
Percentage share = 438*100/2000= 22 (Approx)
Approximately, by what percentage are Smash T-shirts greater than Ultimate T-shirts in all the stores together?
Solution
Number of Smash T shirts in all stores = 85 +137+30+60+108 = 420
Number of Ultimate T shirts in all stores = 57+84+30+48+122 = 341
Required percentage = 81*100/341 = 23
Given below is the data about Domestic Investment (DI) and Foreign Investment (FI) in 9 different sectors over 5 year period.
(In Rs. Crores)

Note: DI = Domestic Investment; FI = Foreign Investment
What is the approximate ratio of the total investment in Energy sector to that of Financial services sector?
Solution
Total investment in Energy sector = 800+1200+500+1400+700+2500+600+1000+1100+500 = 10300
Total investment in financial services sector = 1800+500+400+2000+1200+1600+1000+1500+700+1400 = 12100
Total investment in financial services sector/ Total investment in Energy sector = 12100/10300 = 1.17 = 1.2 (Approximately)
Hence, Total investment in Energy sector/ Total investment in financial services sector = 1 : 1.2
Absolute different between the Total DI and Total FI is highest for which sector?
Solution
Absolute difference between total DI and total FI = absolute( Total DI - Total FI)
For Basic Materials, absolute( Total DI - Total FI) = |(1500+1500+2500+2000+2500)-(800+1300+1400+900+800)| = 10000-5200 = 4800
For Communication Services = |(2000+1200+1600+1000+500)-(1400+1000+1100+300+1200)| = |6300-5000| = 1300
For Consumer Cyclical = |(1000+1200+1100+500+900)-(1500+1500+3000+700+1900)| = |4700-8600| = 3900
For Consumer defensive = |(1300+700+1500+2000+1800)-(1000+1600+800+500+1600)| = |7300-5500| = 1800
For Energy =|(800+500+700+600+1100)-(1200+1400+2500+1000+500)| = |3700-6600| = 2900
For Financial Services =|(1800+400+1200+1000+700)-(500+2000+1600+1500+1400)| = |5100-7000| = 1900
For Healthcare = |(2000+600+400+1000+3500)-(3000+3000+6000+1500+600)| = |7500-14100|= 6600
For Real estate = |(500+1000+4000+6000+2000)-(2000+1500+3000+1500+2100)| = |13500-10100| = 3400
For Technology = |(1500+1000+1500+1200+3000)-(2500+2800+5000+2000+4000)| = |8200- 16300|=8100
Technology has highest absolute difference between Total DI and Total FI.
In which year the average DI is the highest?
Solution
Total no of sectors = 9
Average DI for 2013 = Total DI for 2013 across all sectors/9 = (2500+500+900+1800+1100+700+3500+2000+3000)/9 =15500/9
Average DI for 2011 = (2500+1600+1100+1500+700+1200+400+4000+1500)/9 = 14500/9
Average DI for 2010 = (1500+1200+1200+700+500+400+600+1000+1000)/9 = 8100/9
Average DI for 2009 = (1500+2000+1000+1300+800+1800+2000+500+1500)/9 = 12400/9
Average DI for 2013 is highest.
Which sector has received the 2nd lowest investment from DI for the total period?
Solution
Investment from DI for total period
For Basic Materials, Total DI = (1500+1500+2500+2000+2500) = 10000
For Communication Services, Total DI = (2000+1200+1600+1000+500) = 6300
For Consumer Cyclical, Total DI = (1000+1200+1100+500+900) = 4700
For Consumer defensive, Total DI = (1300+700+1500+2000+1800) = 7300
For Energy, Total DI =(800+500+700+600+1100) = 3700
For Financial Services, Total DI =(1800+400+1200+1000+700) = 5100
For Healthcare, Total DI = (2000+600+400+1000+3500) = 7500
For Real estate, Total DI = (500+1000+4000+6000+2000) = 13500
For Technology, Total DI = (1500+1000+1500+1200+3000) = 8200
Consumer Cyclical has 2nd lowest investment from DI for total period.
What is the approximate ratio of total DI to total FI?
Solution
For Basic Materials,
Total DI = (1500+1500+2500+2000+2500) = 10000
Total FI = (800+1300+1400+900+800) = 5200
For Communication Services,
Total DI= (2000+1200+1600+1000+500) = 6300
Total FI =(1400+1000+1100+300+1200) = 5000
For Consumer Cyclical
Total DI = (1000+1200+1100+500+900) = 4700
Total FI =(1500+1500+3000+700+1900) = 8600
For Consumer defensive
Total DI = (1300+700+1500+2000+1800) = 7300
Total FI =(1000+1600+800+500+1600) = 5500
For Energy
Total DI =(800+500+700+600+1100) = 3700
Total FI = (1200+1400+2500+1000+500) = 6600
For Financial Services
Total DI=(1800+400+1200+1000+700) = 5100
Total FI = (500+2000+1600+1500+1400) = 7000
For Healthcare
Total DI = (2000+600+400+1000+3500) = 7500
Total FI= (3000+3000+6000+1500+600) = 14100
For Real estate
Total DI = |(500+1000+4000+6000+2000) = 13500
Total FI = (2000+1500+3000+1500+2100) = 10100
For Technology
Total DI = (1500+1000+1500+1200+3000) = 8200
Total FI = (2500+2800+5000+2000+4000) = 16300
Total DI for all sectors = 66300
Total FI for all sectors = 78400
Ratio of Total FI to total DI = 78400/66300 = 1.18
Hence, Ratio of total DI to total FI = 2.36 : 2
The following 2 bar charts represent revenues and expenses (in thousands) of A Ltd, B Ltd, and C Ltd over a period of five years.
Revenues of A Ltd, B Ltd, C Ltd for the period 2011-2015


For which company, the average annual expenses were maximum in the given period?
Solution
Average annual expense for A(in thousands) = Sum of all annual expenses for A(in thousands)/Total no of years = (105+185+100+120+110)/100 = 620/5
Similarly,
Average annual expense for B(in thousands) = (135+115+130+125+135)/5 = 640/5
Average annual expense for C(in thousands) = (165+155+190+100+100)/5 = 710/5
C has the highest average expense for given period.
For which year, the average annual revenue (considering all three companies) was the maximum?
Solution
Average annual revenue = Sum of annual revenue of A,B and C for the given year/3 (Here 3 is the total number of companies)
Average revenue for year 2011(in thousands) = (120+180+150)/3 = 450/3
Average revenue for year 2012(in thousands) = (165+150+180)/3 = 495/3
Average revenue for year 2013(in thousands) = (135+165+180)/3 = 480/3
Average revenue for year 2014(in thousands) = (180+150+135)/3 = 465/3
Here, Average annual revenue for 2012 is the highest.
What was the approximate percentage decline in the revenue of C Ltd in 2015 as compared to the revenue in 2012?
Solution
Revenue of C in 2012 = 180,000
Revenue of C in 2015 = 120,000
Decline in revenue = 180,000-120,000 = 60,000
Percentage decline in revenue = (Decline in revenue/Revenue of C in 2012)*100 = (60,000/180,000)*100 = 33.33
What was the approximate absolute difference between the average revenue of A Ltd in 2011, 2012 and 2013 and the average revenue of B Ltd in 2013, 2014 and 2015?
Solution
Average revenue of A in 2011, 2012 and 2013 = (Sum of revenues of A in 2011,2012 and 2013)/3 = (120000+165000+135000)/3 (Since values given are in thousands)
= 140000
Average revenue of B in 2013, 2014 and 2015 = (Sum of revenues of B in 2013,2014 and 2015)/3 = (165000+150000+165000)/3 =160000
Absolute difference = 160000-140000 = 20000
For which of the following years the percentage of rise/fall in profit from the previous year was the maximum for A Ltd?
Solution
Percentage rise or fall in profit of A for a given year from previous year = |((Profit of A for the given year - profit of A for the previous year)/(profit of A for the previous year))|*100
Profit of A for year 2011 = Revenue of A in 2011 - expense of A in 2011 = 120-105 (in thousands)
Profit of A for year 2012 = 165-185 = -20 (in thousands)
Profit of A for year 2013 = 135-100 = 35 (in thousands)
Profit of A for year 2014 = 180-120 = 60 (in thousands)
Profit of A for year 2015 = 150-110 = 40 (in thousands)
Percentage rise or fall in profit of A for year 2012 = |((profit of A for year 2012 - profit of A for year 2011)/(profit of A for year 2011))|*100
= |((-20-15)/15)|*100 = 233.33
Similarly,
for year 2013, Percentage rise or fall in profit of A = |((35- (-20) )/-20)|*100 = 275
for year 2014, Percentage rise or fall in profit of A = |((60-35)/35)|*100 = 71.43
for year 2015, Percentage rise or fall in profit of A = |((40-60)/60)|*100 = 33.33
Here, rise in profit of A for the year 2013 is highest.
=
Read the following passage carefully and answer the questions given at the end of the passage.
In a study of 150 emerging nations looking back fifty years, it was found that the single most powerful driver of economic booms was sustained growth in exports especially of manufactured products. Exporting simple manufactured goods not only increases income and consumption at home, it generates foreign revenues that allow the country to import the machinery and materials needed to improve its factories without running up huge foreign bills and debts. In short, in the case of manufacturing, one good investment leads to another. Once an economy starts down the manufacturing path, its momentum can carry it in the right direction for some time. When the ratio of investment to GDP surpasses 30 percent, it tends to stick at the level for almost nine years (on an average). The reason being that many of these nations seemed to show a strong leadership commitment to investment, particularly to investment in manufacturing.
Today various international authorities have estimated that the emerging world need many trillions of dollars in investment on these kinds of transport and communication networks. The modern outlier is India where investment as a share of the economy exceeded 30 percent of GDP over the course of the 2000s, but little of that money went into factories. Indian manufacturing had been stagnant for decades at around 15 percent of GDP. The stagnation stems from the failures of the state to build functioning ports and power plants and to create an environment in which the rules governing labour, land and capital are designed and enforced in a way that encourages entrepreneurs to invest, particularly in factories. India has disappointed on both counts creating labour friendly rules and workable land acquisition norms. Between 1989 and 2010 India generated about ten million new jobs in manufacturing, but nearly all those jobs were created in enterprises that are small and informal and thus better suited to dodge India’s bureaucracy and its extremely restrictive rules regarding firing workers It is commonly said in India that the labour laws are so onerous that it is practically impossible to comply with even half of them without violating the other half.
Informal shops, many of them one man operations, now account for 39 percent of India’s manufacturing workforce, up from 19 percent in 1989 and they are simply too small to compete in global markets. Harvard economist Dani Rodrik calls manufacturing the “automatic escalator” of development, because once a country finds a niche in global manufacturing, productivity often seems to start rising automatically. During its boom years India was growing in large part on the strength of investment in technology service industries, not manufacturing. This was put forward as a development strategy. Instead of growing richer by exporting even more advanced manufactured products, India could grow rich by exporting the services demanded in this new information age. These arguments began to gain traction early in the 2010s.
In new research on the “service escalators”, a 2014 working paper from the World Bank made the case that the old growth escalator in manufacturing was already giving way to a new one in service industries. The report argued that while manufacturing is in retreat as a share of the global economy and is producing fewer jobs, services are still growing, contributing more to growth in output and jobs for nations rich and poor. However, one basic problem with the idea of service escalator is that in the emerging world most of the new service jobs are still in very traditional ventures. A decade on, India’s tech sector is still providing relatively simple IT services mainly in the same back office operations it started with and the number of new jobs it is creating is relatively small. In India, only about two million people work in IT services, or less than 1 percent of the workforce. So far the rise of these service industries has not been big enough to drive the mass modernisation of rural farm economies. People can move quickly from working in the fields to working on an assembly line, because both rely for the most part on manual labour. The leap from the farm to the modern service sector is much tougher since those jobs often require advanced skills. Workers who have moved into IT service jobs have generally come from a pool of relatively better educated members of the urban middle class, who speak English and have atleast some facility with computers. Finding jobs for the underemployed middle class is important but there are limits to how deeply it can transform the economy, because it is a relatively small part of the population. For now, the rule is still factories first, not service first.
According to the information in the above passage, manufacturing in India has been stagnant because there is
Solution
Option A: The author discusses about skills and education in the context of IT service jobs (Paragraph 4) and not in the context of the manufacturing sector. Hence this option can be rejected.
Option B: In paragraph 2, we can see that the author explains various reasons for the stagnation of manufacturing sector in India. The author has clearly stated that the primary reason for the stagnation is the failure of the state in building capacities and infrastructure that encourages investment and innovation in factories. In addition to this, labour-friendly rules and lack of workable land acquisitions norms also hinder the growth of manufacturing in India. Hence, we can say that option B is the correct answer.
Option C: The author did not discuss anything about women empowerment in the entire passage. Hence, this option can be rejected.
Option D: Investment in technology, telecommunication and IT, and the service sector, in general, will lead to strengthening of the IT sector, not the manufacturing sector. Hence this option can be rejected.
In India, nearly all jobs created were primarily in the small informal sector because
Solution
Option A: The author mentioned exactly the opposite of what is stated in this option. At the start of para 3, the author says that this small informal sector is too small to compete in global markets. Hence, the products manufactured won't be suitable for export markets. Therefore, this option can be rejected.
Option B: The author has not mentioned anything about taxes in the entire paragraph; therefore, this option can be rejected.
Option C: At the end of paragraph 2 the author states "Between 1989 and 2010 India ... regarding firing workers." The author explains that nearly all jobs created were primarily in the small informal sector because these jobs were better suited to dodge India's bureaucracy and its extremely restrictive rules regarding firing workers. Hence we can say that option C is the correct answer.
Option D: The passage does not imply that small sector jobs do not require good infrastructure and can manage better in the Indian conditions. Hence, this option can be rejected.
According to the opinion expressed in the above excerpt, growth in services is not as impactful on the economy as manufacturing because
Solution
It is mentioned in the last paragraph "In India, only about two million ... some facility with computers". IT services provide jobs to only about two million people which is less than 1 percent of the total workforce. The main reason for such a small number is that IT services require advanced skills and these kinds of workers are usually speak English and have access to better education; therefore option B is the correct answer.
In the passage, sustained growth in exports of manufactured products has been identified as the most powerful driver of economic boom because
Solution
In the paragraph 1, the author has explained that "Exporting simple manufactured goods not only increases income and consumption at home, it generates foreign revenues that allow the country to import the machinery and materials needed to improve its factories without running up huge foreign bills and debts". Hence, we can say that growth in manufacturing exports leads to an increase in foreign investment, domestic income generation and consumption. Therefore, option B is the correct answer.
Read the following passages carefully and answer the questions given at the end of each passage.
The company will tackle this problem much more readily if reverse innovation is part of its repertoire. And yet until recently, PepsiCo took a glocalisation approach. The company developed products for the US and then sold and distributed substantially similar products throughout the world. As a result, PepsiCo’s growth, particularly in emerging markets, hit a wall. The company’s brands bumped up against local needs, tastes and habits that could not be satisfied by lowest-common-denominator global products. Under the glocalisation scenario, what first appears to be promising momentum hits a wall - often sooner than later. The renown of even the most potent global brands wear thin when the offered product is neither designed expressly for local markets nor priced for local means. These days PepsiCo is finding ways to address sharp differences across borders by designing products with local tastes and consumer needs in mind and is capturing a greater share of the opportunity in emerging economies. But that’s not all. PepsiCo is finding that its innovations in emerging markets have the potential to have an impact and deliver performance with purpose all over the world. For example, PepsiCo is finding that some long-popular ingredients in emerging economies such as lentils in India have healthy profiles that suggest new dimensions for snacking across geographies. The company’s approach to reverse innovation combines local product development efforts, strong support from global resources, plus efforts to ensure that the raw material of PepsiCo’s innovation - ideas, flavours, ingredients, marketing expertise, packaging materials, manufacturing methods and so on can flow in any direction within the organisation. Concerns about childhood and adult obesity are on the rise. It’s not news that snack foods are not commonly associated with health and wellness. Nonetheless, PepsiCo saw that there was an enormous opportunity for impact in creating options for healthier snacking. “Consumers interact with our products on three levels; the neurological level, the gut level and the metabolic level.” Traditionally food and beverage companies have focussed only on the first. The neurological level is where brands, marketing and sensory payloads operate. Looking at the problems of emerging markets it is important to also understand what PepsiCo’s products do to the person’s gut? What do they do to their body chemistry? If those effects are ignored then it is indulgence without any balance. As PepsiCo geared up for its efforts to develop Aliva, it wondered whether there were any examples in which PepsiCo had already practised successful reverse innovation. There was one such example in India. It was a lentil and rice-based snack called Kurkure. Introduced more than a decade ago, it had grown to be Frito Lay India’s top-selling product. PepsiCo had learnt a lot from the Kurkure experience. Once emerging nations aspired to have access to rich-world products. But these days they want rich world quality baked into products with local origins. It exemplified the idea that innovations shouldn’t simply be handed down from on high.
According to the above excerpt, most MNCs face problems in emerging countries because they interpret the concept of ‘glocalisation’ as
Solution
In first part of the paragraph the author states that most MNCs face problems in emerging countries because they didn't consider local need, tastes and habits which could have been a major differentiator as compared to glocalisation approach.The products offered by most MNCs were neither designed expressly for local markets nor priced for local means.Hence, these global products couldn't succeed in local markets.
We can see that in option (B), (C) and (D) we have at least one of two qualities local need or pricing is mentioned hence these options can be rejected. Therefore, option A is the correct answer.
According to the author, snack food companies traditionally focus on the
Solution
It is mentioned in the passage that "Consumers interact with our products on three levels; the neurological level, the gut level and the metabolic level.” Traditionally food and beverage companies have focused only on the first. Hence, we can say that the snack food companies traditionally focus on the the neurological level.Therefore, option C is the correct answer.
The passage suggests that MNCs should replace glocalisation with
Solution
From the passage we can see that the author emphasises that MNCs should modify the products according to local need and price the product differently from the global market. This entire process of customizing the product according to local demand is known as part of 'Reverse innovation'. Hence we can say that option D is the correct answer. Author further uses PepsiCo's example how the MNC has been successful in emerging markets such as India by introducing a customized product "Kurkure" that caters to local market needs and fits into market pricing perfectly. This all has been possible due to successful reverse innovation.
What is the learning for PepsiCo from Indian experience
Solution
In last 3 lines of the paragraph, author has explained that success of PepsiCo's a lentil and rice based snack called Kurkure in an emerging nation such as India was a result of rich world quality baked into products with local origins. Hence we can say that Snack food should use global quality and healthy local ingredients. Using local ingredients will give the products a local touch that would be highly impact in local market context.Therefore we can say that option C is the correct answer.
Read the following passages carefully and answer the questions given at the end of each passage.
Typically women participate in the labour force at a very high rate in poor rural countries. The participation rate then falls as countries industrialise and move into the middle-income class. Finally, if the country grows richer still, more families have the resources for higher education for women and from there, they often enter the labour force in large numbers. Usually, economic growth goes hand in hand with the emancipation of women. Among rich countries, according to a 2015 study, female labour force participation ranges from nearly 80 percent in Switzerland to 70 percent in Germany and less than 60 percent in the United States and Japan. Only 68 percent of Canadian women participated in the workforce in 1990; two decades later, that increased to 74 percent largely due to reforms including tax cuts for second earners and new childcare services. In the Netherlands, the female labour participation rate doubled since 1980 to 74 percent as a result of expanded parental leave policies and the spread of flexible, part-time working arrangements.
In a 2014 survey of 143 emerging countries, the World Bank found that 90 percent have at least one law that limits the economic opportunities available to women. These laws include bans or limitations on women owning property, opening a bank account, signing a contract, entering a courtroom, travelling alone, driving or controlling family finances. Such restrictions are particularly prevalent in the Middle East and South Asia with the world’s lowest female labour force participation, 26 and 35 percent respectively. According to the data available with the International Labour Organisation (ILO), between 2004 and 2011, when the Indian economy grew at a healthy average of about 7 percent, there was a decline in female participation in the country’s labour force from over 35 percent to 25 percent. India also posted the lowest rate of female participation in the workforce among BRIC countries.
India’s performance in female workforce participation stood at 27 percent, significantly behind China (64 percent), Brazil (59 percent), Russian Federation (57 percent), and South Africa (45 percent). The number of working women in India had climbed between 2000 and 2005, increasing from 34 percent to 37 percent, but since then, the rate of women in the workforce has to fallen to 27 percent as of 2014, said the report citing data from the World Bank. The gap between male and female workforce participation in urban areas in 2011 stood at 40 percent, compared to rural areas where the gap was about 30 percent. However, in certain sectors like financial services, Indian women lead the charge.
While only one in 10 Indian companies are led by women, more than half of them are in the financial sector. Today, women head both the top public and private banks in India. Another example is India’s aviation sector, 11.7 percent of India’s 5,100 pilots are women, versus 3 percent worldwide. But these successes only represent a small section of women in the country. India does poorly in comparison to its neighbours despite a more robust economic growth.
In comparison to India, women in Bangladesh have increased their participation in the labour market, which is due to the growth of the ready-made garment sector and a push to rural female employment. In 2015, women comprised of 43 percent of the labour force in Bangladesh. The rate has also increased in Pakistan, albeit from a very low starting point, while participation has remained relatively stable in Sri Lanka. Myanmar with 79 percent and Malaysia with 49 percent are also way ahead of India. Lack of access to higher education, fewer job opportunities, the lack of flexibility in working conditions, as well as domestic duties are cited as factors behind the low rates. Marriage significantly reduced the probability of women working by about 8 percent in rural areas and more than twice as much in urban areas, said an Assocham report. ILO attributes this to three factors: increasing educational enrolment, improvement in earning of male workers that discourage women’s economic participation, and lack of employment opportunities at certain levels of skills and qualifications discouraging women to seek work. The hurdles to working women often involve a combination of written laws and cultural norms. Cultures don’t change overnight but laws can.
The IMF says that even a small step such as countries granting women the right to open a bank account can lead to substantial increase in female labour force participation over the next seven years. According to the United Nations Economic and Social Commission for Asia and the Pacific (ESCAP), even a 10 percent increase in women participating in the workforce can boost gross domestic product (GDP) by 0.3 percent. The OECD recently estimated that eliminating the gender gap would lead to an overall increase in GDP of 12 percent in its member nations between 2015 and 2030. The GDP gains would peak close to 20 percent in both Japan and South Korea and more than 20 percent in Italy. A similar analysis by Booz and Company showed that closing gender gap in emerging countries could yield even larger gains in GDP by 2020, ranging from a 34 percent gain in Egypt to 27 percent in India and 9 percent in Brazil.
According to the above passage, though there are many reasons for low female labour force participation, the most important focus of the passage is on
Solution
The author mentions that majority of the nations have legal elements that impede economic opportunities available to them, which in turn impacts labour force participation {In a 2014 survey of 143 emerging countries, the World Bank found that 90 percent have at least one law that limits the economic opportunities available to women.} This idea is further clarified when the author discusses the cultural norms that reduce labour force participation. We are told that the primary reason behind the low figures is - "The hurdles to working women often involve a combination of written laws and cultural norms. " Therefore, Option B aptly presents the major factor behind low female labour force participation.
Options A and D: We are told - {...Marriage significantly reduced the probability of women working by about 8 percent in rural areas and more than twice as much in urban areas, said an Assocham report. ILO attributes this to three factors: increasing educational enrolment, improvement in earning of male workers that discourage women’s economic participation, and lack of employment opportunities at certain levels of skills and qualifications...} There is no discussion whatsoever about lack of inclination to work [Option A] or more preference for child rearing [Option D]. Thus, we can reject these choices.
Option C: The author does not explicitly present a relationship between lack of access to higher education and lack of skills and qualifications. Furthermore, this is not the major focus of the passage.
Hence, Option B is the correct choice.
Identify the sentence that most accurately summarizes the message of the above excerpt
Solution
In the first half of the passage, the author introduces some data points and statistics regarding women's employment rates. Later on, the author discusses the reasons behind low female labour force participation. Towards the end of the passage, the author emphasises the increment in GDP and welfare that will flow if female labour participation increases. Hence, the core message: increased female labour participation can have a positive impact on not just the social indicators but also economic growth. Therefore, Option D is the correct answer.
According to the IMF what small step can lead to larger impact on increasing female labour force participation
Solution
It is given in the passage that 'The IMF says that even a small step such as countries granting women the right to open a bank account can lead to substantial increase in female labour force participation over the next seven years.' Hence, we can say that option C is the correct answer.
According to the information in the above passage between 2004 to 2011, when the Indian economy grew at a healthy average of about 7 percent
Solution
It is mentioned in the passage that 'According to data available with the International Labour Organisation (ILO), between 2004 and 2011, when the Indian economy grew at a healthy average of about 7 percent, there was a decline in female participation in the country’s labour force from over 35 percent to 25 percent.' Hence, we can say that option C is the correct answer.
Read the following passages carefully and answer the questions given at the end of each passage.
The Cyclopses according to mythology were a race of bad tempered and rather stupid one eyed giants. Not perhaps a great portend for a new generation of robots. But Andrew Davison a computer scientist at Imperial College, London, thinks one eye is enough for a robot, provided its brain can think fast enough. For a robot to work autonomously it has to understand its environment. Stereoscopic vision, integrating the images from two eyes looking at the same thing from different angles is one approach to achieve this, but it involves a lot of complicated computer processing. The preferred method these days therefore is Simultaneous Localisation and Mapping (SLAM) which uses sensors such as laser based range finders that see by bouncing beams of light off their surroundings and timing the return. Dr. Davison however wants to replace the range finders which are expensive and fiddly with a digital camera, which is small, cheap, and well understood. With this in mind he is developing ways to use a single moving video camera to create continually updated 3D maps that can guide even the most hyperactive robots on its explorations. His technique involves collecting and integrating images taken from different angles as the camera goes on its travels. The trick is to manage to do this in real time, at frame rates of 100-1,000 per second. The shape of the world pops out easily from laser data because it represents a direct contour map of the surrounding area. A camera captures this geometry indirectly and so needs more (and smarter) computation if it is to generate something good enough for a self - directing robot. The answer is a form of triangulation, tracking features such as points and edges from one frame to the next. With enough measurements of the same set of features from different viewpoints, it is possible if you have a fast enough computer program to estimate their positions and thus by inference the location of the moving camera. However, developing such a program is no mean feat. In the milliseconds between successive frames, relevant information from each fresh image must be extracted and fused with the current map to produce an updated version. The higher the frame rate, the less time there is to do this work.
What is the primary purpose of the above passage?
Solution
Let us check by the options.
Option (A): This is very narrow and doesn't take the holistic view of the entire passage as whole. Moreover, Dr. Davison didn't even use SLAM technique. He intends to improvise on this by replacing range finders with a digital camera. Hence, this option can be rejected.
Option (C): The passage is not advocating the use of digital cameras. Hence, this option can be rejected.
Option (D): The focus is on the improvisation and not on Dr. Davison. Hence, we can reject this option.
Option (B): Through the passage, the author discusses one improvisation in how a self-guided robot can see around himself. He discusses how we can replace range finders which are expensive and fiddly with a digital camera that is small, cheap and better understood. Hence, through this improvisation the price and workability of a self-guided robot will improve. Hence, as it discusses a better solution for vision of a self-guided robot, option B is the right answer.
What message is the author conveying by drawing attention to a mythical figure and a one eyed robot?
Solution
In the first part of the passage author mentions that: "The Cyclopses according to mythology were a race of bad tempered and rather stupid one eyed giants. Not perhaps a great portend for a new generation of robots. But Andrew Davison a computer scientist at Imperial College, London, thinks one eye is enough for a robot. Hence, we can say that author somehow convey the idea that having one eye does not affect the performance of the robot in any manner. Therefore, option C is the correct answer.
Laser-based range finders are more effective than digital cameras because (select the right option)?
i. Laser-based range finders directly capture the contour map of the surroundings which enable faster processing
ii. Digital cameras are expensive
iii. Laser-based range finders are easier to use
iv. Digital cameras require more computation
Solution
This is directly mentioned in the passage in lines : 'The shape of the world pops out easily from laser data because it represents a direct contour map of the surrounding area. A camera captures this geometry indirectly and so needs more (and smarter) computation if it is to generate something good enough for a self - directing robot.' Therefore, we can deduct i and iV. Hence, option C is the correct answer.
It is possible to improve the performance of digital camera to guide robots
Solution
In the 4th last statement of the para it is directly given that "With enough measurements of the same set of features from different viewpoints, it is possible if you have a fast enough computer program to estimate their positions and thus by inference the location of the moving camera." Hence, option B is the correct answer.
For the following questions answer them individually
Use the words in the table below to solve the questions.

Complete the crossword using the words from the above table. There are more words than required
Hint:
1 - Across: native to or confined to a certain region; 1 - Down: balance of forces or interests; 2: inclined to lay down principles as undeniably true; 3: attempting to avoid confrontation or anger, calming or conciliatory; 4: a speech or piece of writing that praises someone or something highly

Solution
Native to confined to a certain region is ENDEMIC. Balance of forces or interests is EQUIPOISE. Inclined to lay down principles as undeniably true is DOGMATIC. Attempting to avoid confrontation, calming or conciliatory is EMOLLIENT. A speech of writing that praises someone or something highly is ENCOMIUM.
Each question has explained the meaning of two words from the above table. Identify the correct matching words from the table.
a) A formal expression of praise
b) Take up the cause, support
Solution
A formal expression of praise is an encomium. To take up the cause or support is to espouse.
a) Devoid of cheer or comfort, dreary
b) Stubbornly preserving, doggedness
Solution
Tedious means devoid of cheer or comfort. Tenacity means stubbornly, doggedness.
a) Having a softening or soothing effect
b) Verbal abuse, defamation
Solution
An emollient has a calming or soothing effect. Obloquy means verbal abuse or defamation.
Match the words in Column A with their Antonyms in column B

Solution
Apogee is the highest point of something, where it is greatest or most successful. Nadir, meaning the lowest point or the point of the greatest adversity or despair, is its antonym.
Unjustified is an antonym of warranted.
Epiphany means insight or realization. Secret is an antonym of epiphany.
Archetypal means having all the important qualities that make somebody or something a typical example of a particular kind of person or thing. The word unique is its antonym.
Therfore Option A) iv)-j; vii)-b; viii)-e; x)-a , is the correct answer.
Solution
Happiness is the antonym of vexation.
Baleful means harmful or malicious. Benevolent is the antonym.
Recluse is a person who lives in seclusion or apart from society, often for religious meditation.
An extrovert is an outgoing, gregarious person. The two words have an anonymous relationship.
Itinerant means travelling from place to place. Static is an antonym of itimerant.
Etymological description of the ‘word’ is given in each question. Identify the origin /source of the ‘word’
Debutante (noun)
The origin of the word dates back to early Nineteenth Century. The word is used to describe a female stage actor making her first public performance.
Solution
Debutante is a french word used to describe an upper class woman performer who is making her first public appearance or performance. Therefore, option D is the right answer.
Obvious (adjective)
It means “frequently met with”. The origin of the word comes from obvius “that is in the way, presenting itself readily, open, exposed, commonplace,” also from obviam (adv.) “in the way”, from ob “against” + viam, accusative of via “way”, meaning “plain to see, evident” is first recorded in 1630.
Solution
Obvious is a latin word which means 'frequently met with'. Therefore, option A is the right answer.
Soccer (noun)
The origin of the word dates back to 1889 (socca), later 1891 (socker), 1895 (soccer); originally university slang from a shortened from of Assoc., abbreviation of Association in Football Association.
Solution
'Soccer' is an English word which is derived from the shortened form of 'Association of football' (Assoc). The suffix 'er' was added later to make it sound like a common word. Therefore, option B is the right answer.
Four words are given in each question, out of which one word is correctly spelt. Find the correctly spelt word.
Solution
Danseuse is a term used to refer to a female ballet dancer. The correct spelling of the word "Danseuse" is given in option D. Therefore, option D is the right answer.
Solution
The correct spelling of Norcotic is 'Narcotic' (dealing with drugs).
The correct spelling of permenant is 'Permanent'.
The correct spelling of pesimist is 'Pessimist' (Someone who holds negative views and is hard to convince).
The word 'acoustic' has been spelt correctly. Therefore, option D is the right answer.
In the following passage, fill in the blank spaces with the most appropriate word from the options provided.
Come October and you are burnt by the mid-day Sun. The storm and the sizzle is particularly __70__ as it comes after the relatively cool monsoon months. Though it is hot and muggy, that does not prevent people from coming out on the streets to __71__ the traditional festivals. And it must be shopping time also, colourfully decorated showrooms are __72__ the passerby to let his hair down, splurge and take a __73__ of gifts home for family. After all, the New Year is just around.
(70)
Solution
After the blank, the author has stated 'as it comes after the relatively cool monsoon months'. Therefore, the word that fills the blank should be in stark contrast in meaning to the 'cool' period.
Traumatic is an extremely harsh word to be used in this context. 'Pleasant' and 'fantastic' fail to capture the contrast implied by the author. 'Sultry' means hot and humid. Therefore, 'sultry' is the term that should be used to fill the blank and hence, option C is the right answer.
(71)
Solution
We can infer that people come out on the street unmindful of the weather to look forward to the festival. 'Herald' means to signal the arrival of something. 'Moot' means to be considered doubtful. 'Boycott' means to reject something. Therefore, 'herald' is the correct term to be used to fill the blank and hence, option A is the right answer.
(72)
Solution
From the given sentence, we can infer that the colourful showrooms tempt the passerby to buy something. Therefore, the missing word must mean to urge or to tempt.
'Drawing the passerby to let his hair down' is an incorrect expression. The shops can draw the passerby but they cannot 'draw' him to let his hair down. Therefore, we can eliminate option A.
'Pursuing' means to follow or chase. Fascinating and pursuing fail to capture that the shops entice the passerby.
'Exhort' means to urge someone. 'Exhorting' fills the blank perfectly. Therefore, option B is the right answer.
(73)
Solution
The author intends to convey that the shops entice the customers into dropping their inhibitions and buying a large number of items.
We can eliminate option D (placement) as the word is irrelevant to the context of the sentence. 'Token' is used to describe something that is bought as a souvenir.The author intends to convey that the people end up buying a lot. Therefore, we can eliminate option A as well.
Both 'list' and 'bagful' capture the point that the people buy a lot. However, the word 'list' implies that the activity is pre-planned. There is a formal structure attached to the word 'list'. Though people do not go in with an intention to buy, they end up buying things. The word 'bagful' captures the delight in the the process and hence, option C is the right answer.
In the following questions some parts of the sentence have been jumbled up. Re-arrange these parts which are labelled as (a), (b), (c) and (d) to produce the correct sequence in completing the sentence.
Nelson Mandela modern country in a modern way (a) / and could run a new (b) / shifted the beliefs of the people (c) / so they could heal the racial conflict (d)
Solution
The correct statement is : Nelson Mandela shifted the beliefs of the people so they could heal the racial conflict and could run a new modern country in a modern way.
Therefore, (c), (d), (b), (a) is a correct sequence. Hence, option B is the correct answer.
The difference and development on the other affects(a) / in the relationship between death and birth-rates on the one hand (b) / but the age structure of the population (c) / not just the rat of the population growth (d)
Solution
The correct sequence is :
The difference in the relationship between death and birth-rates on the one hand and development on the other affects not just the rat of the population growth but the age structure of the population.
Hence, option C is the correct answer.
Fill up the blanks with appropriate word (idiom/colloquial) given in the options.
Mark is always eager to argue about how this business should be run. He seems to have a real _________ on his shoulder about it.
Solution
'To have a chip on the shoulder' is an idiom which means to hold some grudge about some topic which causes instant provocation. Therefore, option C is the right answer.
Vishnu thought the last problem on the test was a real __________. It was much harder and more complex than any of the previous problems.
Solution
'Doozy' is a term used to describe something unique.
'Whooper' is a term used to describe a large swan found in Europe, Asia, and Greenland. The term is also used to indicate a person who makes a loud noise (Like the swan).
'Carp' means to find fault with something.
'Snafu' is a term used to describe a muddled situation.
We can infer from the sentence that Vishnu thought the problem to be one of its kind. Therefore, 'doozy' is the correct term to be used and hence, option A is the right answer.
I used to be kind of a _______ when I was little, but I lost most of the weight in my teenage years.
Solution
From the given sentence, we can infer that the author used to be chubby when he was little and lost some weight as he grew up. Therefore, the missing word should mean 'fat or chubby'.
Let us evaluate the options:
Runt is a term used to describe a small and weak person.
Beanpole is a term used to describe a tall and lean person.
Punk is a term used to describe someone of little value.
Doughboy is a term used to describe a chubby person.
Therefore, doughboy is the correct term to be used and hence, option C is the right answer.
For the following questions answer them individually
The Trans Pacific Partnership (TPP) or Trans Pacific Partnership Agreement (TPPA) is a trade agreement among twelve Pacific Rim countries, signed on 4 February 2016 in Auckland, New Zealand. Which of the following countries is not a member of TPP?
Solution
The Trans-Pacific Partnership (TPP) was signed by Australia, Canada, Brunei, Japan, Chile, Mexico, Malaysia, New Zealand, Peru, Vietnam, Singapore, and the United States. Indonesia is not a member of TPP. Therefore, option D is the right answer.
TPP is now defunct (As on November 2018).
Match each Brand with the most appropriate Industry Type it represents:

Solution
Facebook is a social media platform (Technology-based company).
Louis Vuitton is a luxury fashion brand based out of France.
Visa is a financial services company that specializes in electronic fund transfer.
UPS stands fir United Parcel Service. It is a US based company that specializes in transport.
Accenture is a business services firm. Previously known as Anderson consulting, the company is widely involved in the IT consulting space.
Therefore, option C is the right answer.
Which of the following best represents baking soda?
Which of the following country was not there in the UEFA Euro 2016 (Soccer Tournament quarter - final?
France, Belgium, Wales, Germany, Italy, England, Poland, Portugal, Iceland
Solution
All the given countries except England progressed to the Quarter Finals. England was knocked out by Iceland in the round of 16. Portugal won the cup. Therefore, option C is the right answer.
Alvin Toffler (October, 1928 - June, 2016) was an American writer and futurist, known for his works discussing modern technologies, including the digital revolution and the communication revolution, with emphasis on their effects on cultures worldwide. Toffler was an associate editor of Fortune magazine. Identify the book authored by Alvin Toffler from the following list
Solution
The fourth protocol was authored by Frederick Forsyth.
The End of Eternity was authored by Isaac Asimov.
The Time machine was authored by H.G.Wells.
Alvin Toffler is the author of the book "Previews and Premises" and hence, option A is the right answer.
Which of the following Indian states share border with multiple countries?
a) Manipur b) Mizoram c) Tripura d) Bihar e) Sikkim f) West Bengal g) Assam
Solution
Manipur shares its border only with Myanmar.
Tripura shares its border only with Bangladesh.
Bihar shares its border only with Nepal.
Sikkim shares its border with Nepal, Bhutan, and China.
Mizoram shares their border with both Bangladesh and Myanmar.
Assam shares its border with both Bangladesh and Bhutan.
West Bengal shares its border with Nepal, Bhutan, and Bangladesh.
Therefore, option B is the right answer.
General elections were held in Myanmar on 8th November 2015. This has been the first openly-contested election held in the country since 1990. Which political party received the highest number of seats?
Solution
The National League for Democracy, led by Aung San Suu Kyi, captured 86% of the total seats in the elections held in 2015. Therefore, option A is the right answer.
Sustainable Development Goals have replaced
Solution
The UN General Assembly set 17 goals to be established in 2015. These goals are known as Sustainable Development Goals or Global Goals for sustainable development. The Sustainable Development Goals succeed the millennium development goals. The Millennium Development Goals ended in 2015. Therefore, option C is the right answer.
Match the Organisation with the location of its Headquarter

Solution
The headquarters of the world bank is located in Washington D.C.
The headquarters of the NATO is located in Brussels, Belgium.
The headquarters of the Amnesty International, a human rights organization, is located in London.
The headquarters of the Food and Agricultural Organization (FAO) is located in Rome.
The headquarters of the European Central bank is located in Frankfurt, Germany.
The headquarters of the Organization for Economic cooperation and development (OECD) is located in Paris.
Therefore, option D is the right answer.
What was the theme of the 2016 National Youth Festival of India?
Solution
The National Youth Festival is held every year from the 12th to the 16th of January to commemorate the birth anniversary of Swami Vivekananda.Chattisgarh hosted the 20th edition of the National Youth Festival held in 2016. The theme of the festival was India Youth for Skill, Development and Harmony. Therefore, option C is the right answer.
Which Indian player has created junior world record in “Javelin throw” in July 2016?
Solution
Neeraj Chopra set the junior world record in 2016 IAAF World U20 championship held in Poland. He set a world record of 86.48 m in the Junior segment. He has represented India in the 2018 Commonwealth games and Asian games. He clinched a gold medal in the former. Therefore, option A is the right answer.
Which global credit information company is associated with Credit Information Bureau (India) Limited (CIBIL)?
Solution
CIBIL is a part of the American Multinational group TransUnion. TransUnion is headquartered in Chicago. Therefore, option D is the right answer.
Match the famous personality in Column II from the information given in Column I.

Solution
Mike Tyson was born in 1966. He holds the record for being the youngest boxer to become heavyweight champion. He was diagnosed with bipolar disorder during the later stages of his life.
Dilip Doshi debuted in 1979. Though he was over 30 years of age, he went on to take more than 100 wickets.
Shraddha Kapoor played a small role in the film Teen Patti in 2010. She was born in 1989 to Shakti Kapoor and Shivangi Kolhapure.
Therefore, option C is the right answer.
What is the Currency of Bulgaria?
Solution
Lira is the currency of Turkey.
Lek is the currency of Albania.
Lev is the currency of Bulgaria.
Therefore, option A is the right answer.
Bharat Heavy Electricals Ltd. (BHEL) commissioned 2 units each of 14 Megawatts at the Salma Hydro Electric Project in 2016. Identify the country where this project is located.
Solution
Salma Dam is built across the Hari River in Afghanistan. The dam has been built using Indian Aid. The Afghan government renamed the dam as Afghan-India Friendship Dam as a gesture. Therefore, option D is the right answer.
“Satyameva Jayate” inscribed on one side of all Indian currency, has been derived from which of the following ancient Indian scripture?
Solution
The national motto of India 'Satyameva Jeyate' is derived from Mundaka Upanishad. It means truth alone triumphs. Therefore, option A is the right answer.
Which country inaugurated the first electric road in the world for hybrid heavy transports?
Solution
Sweden opened the world's first electric road for vehicles near Stockholm. Vehicles can be charged on the go using the 2 electric rails that have been embedded in the road. Therefore, option A is the right answer.
The Panama Canal expansion project is also referred to
Solution
The Panama Canal Expansion Project is also known as the third set of locks project. The original canal had 2 lanes with a lock each. A third lane was opened which has nearly doubled the traffic. The Panama Canal connects the Atlantic Ocean to the Pacific Ocean eliminating the need to circumnavigate South America. Therefore, option B is the right answer.
Which of the following Company has acquired Jabong in July 2016?
Solution
Myntra acquired Jabong for 70 million dollars (Rs. 470 crore) from the parent company Global Fashion Group in the year 2016. Therefore, option D is the right answer.
Match the movie with the personality on whose life it is based

Solution
'The social network' is a movie based on the life of the founder of Facebook, Mark Zuckerberg.
'The theory of everything' is a movie based on the life of the scientist Stephen hawking.
'The lady' is a movie based on the life of Aung San Suu Kyi, leader of the National League for Democracy in Myanmar and a Nobel Prize recipient for peace.
'The special relationship' is a movie made on the former British Prime Minister Tony Blair.
Therefore, option B is the right answer.
The 2016 Joint Military Exercise “Maitree” has been conducted between India and which of the following countries?
Solution
Maitree is an annual joint military exercise to strengthen the ties between the Royal Thai army and the Indian Army. Therefore, option D is the right answer.
What is Director Identification Number(DIN)?
Solution
Director Identification Number, DIN, is a unique 8 digit number given by the central government to the director or the potential director of a company. The DIN was incorporated to keep track of the directors. Therefore, option B is the right answer.
Which of the following is not an elected post in India?
Solution
The Chief Minister of a State and the Prime Minister of India are elected by the MLAs and MPs respectively elected by the people.
The President is elected by an electoral college consisting of the members of both the houses of the Parliament.
The Governor and lieutenant governors are selected by the President of India for a term of 5 years. Therefore, option C is the right answer.
Bitcoin is
Solution
Bitcoin is a type of crytocurrency that is built on the block chain technology. Therefore, option B is the right answer.
Match the Bollywood Actors with their debut Hindi Film

Solution
Shahrukh khan debuted in the film Deewana in the year 1992.
Sushmita Sen debuted in the film Dastak in 1996.
Aishwarya Rai Bachchan debuted in the film Aur Pyar Ho Gaya in the year 1997.
Rani Mukherjee debuted in the film Raja Ki Ayegi Barat in the year 1996.
Kareena Kapoor debuted in the Refugee in 2000.
Therefore, option D is the right answer.
The smallest integer x for which the inequality $$\frac{x-7}{x^2 + 5x-36}$$ > 0 is given by
Solution
$$\frac{x-7}{x^2 + 5x-36}$$ > 0
$$\frac{x-7}{(x+9)(x-4)}$$ > 0

So $$x \epsilon (-9,4) U (7, \infty$$)
So smallest integer in this range is $$ x = -8$$.
A child, playing at the balcony of his multi-storied apartment, drops a ball from a height of 350 m. Each time the ball rebounds, it rises 4/5th of the height it has fallen through. The total distance travelled by the ball before it comes to rest is
Solution

Total distance covered by the ball will be = $$350+2(\frac{4}{5}*350+(\frac{4}{5})^{2}*350+(\frac{4}{5})^{3}*350+...)$$
= $$350+2*350(\frac{4}{5}+(\frac{4}{5})^{2}+(\frac{4}{5})^{3}+...)$$
= $$350+2*350(\frac{\frac{4}{5}}{1-\frac{4}{5}})$$
= $$350+2*350*4$$ =$$3150$$
Find the value of x which satisfies the following equation $$4log_7 (x - 8) = log_3 81$$
Solution
$$4log_7 (x - 8) = log_3 81$$
$$4log_7 (x - 8) = log_3 3^{4}$$
$$4log_7 (x - 8) =4*log_3 3$$
$$log_7 (x - 8) =1$$
$$(x - 8) =7^{1}$$
$$x = 7+8$$
$$x = 15$$
A playschool contains 4 boys and y girls. On every Wednesday during winter, five students, of which at least three are boys, go to Zoological Garden, a different group being sent every week. At the Zoological Garden, each boy in the group is given a ball. If the total number of balls distributed is 368, then the value of y is
Solution
Total 5 students out of 4 boys and y girls can be chosen in two ways :
(1) 3 Boys and 2 Girls = $$4c_{3}*$$y$$c_{2}$$
(2) 4 Boys and 1 Girls = $$4c_{4}*$$y$$c_{1}$$
So total number of balls given to boys :
3*$$4c_{3}*$$y$$c_{2}$$+4*$$4c_{4}*$$y$$c_{1}$$ = 368
$$6(y)(y-1)+4y$$ = 368
6$$y^{2}-2y-368$$ = 0
3$$y^{2}-y-184$$ = 0
$$(y-8)(3y+23)$$ = 0
$$y=8$$, y $$\neq$$ $$ \frac{-23}{3}$$
Which of the following statements regarding arrangement of the word ‘RIYADH’ is/are true:
i. Two vowels can be arranged together in 120 ways
ii. Vowels do not occur together in 240 ways
Which of the above statements are true?
Solution
Let's check both the statements one by one:
(i) Two vowels together - (2!)*(5!) = 2*120 = 240

So we can say that statement (i) is wrong
(ii) Two vowel not together = Total ways - Vowels together
= (6!) - (2!)*(5!) = 720 - 240 = 480
hence statement (ii) is also incorrect.
Two farmers were cultivating wheat on their respective agricultural land in a village. Farmer A had an average production of 20 bushels from a hectare. Farmer B, who had 15 hectares of more land dedicated to wheat cultivation, had and output of 30 bushels of wheat from a hectare. If farmer B harvested 530 bushels of wheat more than farmer A, how many bushels of wheat did farmer A cultivate?
Solution
Let's assume farmer A has ‘x’ hectare land.
$$\therefore$$ Total production of A = 20x
According to the information given to us B will have 'x+15' hectare land.
$$\therefore$$ Total production of B = 30*(x+15)
Given that : Total production of B - Total production of A = 530
30*(x+15) - 20x = 530
x = 8
Thus, total production of A = 20*8 = 160
Shruti and Krishna left Delhi for Noida at the same time. While Shruti was driving her car, Krishna, an environmentalist by profession, was traveling on his bicycle. Having reached Noida, Shruti turned back and met Krishna an hour after they started. Krishna continued his journey to Noida after the meeting, while Shruti turned back and also headed for Noida. Having reached Noida, Shruti again turned back and met Krishna 30 minutes after their first meeting. The time taken by Krishna to cover the distance between Delhi and Noida is
Solution
Let the distance between Delhi and Noida is X km and Krishna's speed is d km/hr.

When they met for the first time, Distance covered by Krishna = d km
Distance covered by Shruti = 2X-d km
So the ratio of speeds of Shruti and Krishna is 2X - d : d ...(1)
Between 1st and 2nd meeting, Distance covered by Krishna = d/2 km
So distance covered by Shruti will be = (X-d)+(X-3d/2)= 2X-5d/2
So the ratio of speeds of Shruti and Krishna in this case will be 2X-5d/2 : d/2 ...(2)
By equating (1) and (2)
$$\frac{2X - d}{d}$$ = $$\frac{2X-5\frac{d}{2}}{\frac{d}{2}}$$
$$X=2d$$
Therefore the distance between Delhi and Noida is 2d and Krishna will take 2 hours to cover that distance with speed of d km/hr.
In a local shop, as part of promotional measures, the shop owner sells three different varieties of soap, one at a loss of 13 percent, another at a profit of 23 percent and the third one at a loss of 26 percent. Assuming that the shop owner sells all three varieties of soap at the same price, the approximate percentage by which total cost price is lower or higher than the total selling price is
Solution
Let SP of each soap be $$X$$.
Let's calculate Cost Price (CP) of each soap separately.
$$CP_{1} = \frac{100}{100-13}*X = \frac{100X}{87}$$
$$CP_{2} = \frac{100}{100+23}*X = \frac{100X}{123}$$
$$CP_{2} = \frac{100}{100-26}*X = \frac{100X}{74}$$
Total cost price of 3 soaps= $$\frac{100X}{87}+\frac{100X}{123}+\frac{100X}{74}=3.31X$$
Total selling price of 3 soaps= $$3X$$
Cost price is higher than the selling price by =$$\frac{3.31X-3X}{3X}*100 \approx10.5$$ percent
Therefore, option A is the correct answer.
In the marketing management course of an MBA programme, you and your roommate can complete an assignment in 30 days. If you are twice as efficient as your roommate, the time required by each to complete the assignment individually is
Solution
Let's assume my roommate completes 'x' amount of work in a day, I will complete '2x' amount of work.
Entire assignment is completed in 30 days hence total work = 30*(x+2x) = 90x
I will complete the entire assignment alone in = $$\frac{90x}{2x} = 45$$ days
My roommate will complete the entire assignment alone in = $$\frac{90x}{x} = 90$$ days
Let PQRSTU be a regular hexagon. The ratio of the area of the triangle PRT to that of the hexagon PQRSTU is
Solution
It's given that PQRSTU is a regular hexagon and O is the center of the hexagon.

If we fold $$\triangle$$TSR ,$$\triangle$$PQR ,$$\triangle$$TUP along lines TR, PR, PT respectively then vertices S,Q,U will overlap each other exactly at center of the hexagon.

Hence we can say that Area of hexagon PQRSTU = 2($$\triangle$$PRT)
So Area of $$\triangle$$PRT = 0.5(Area of hexagon PQRSTU)
ALTERNATE EXPLANATION:-
Let the length of each side of the hexagon be a.
Since it is a regular hexagon, $$PT=TR=PR=\sqrt{3}a$$. Thus, $$\triangle PTR$$ is an equilateral triangle, and the area of the triangle will be = $$\dfrac{\sqrt{3}}{4}\left(side\right)^2=\dfrac{\sqrt{3}}{4}\left(\sqrt{3}a\right)^2=\dfrac{3\sqrt{3}}{4}a^2$$.
Area of hexagon PQRSTU = $$\dfrac{3\sqrt{3}}{2}\left(side\right)^2=\dfrac{3\sqrt{3}}{2}a^2$$
Thus, the required ratio will be = $$\dfrac{\frac{3\sqrt{3}}{4}a^2}{\frac{3\sqrt{3}}{2}a^2}$$ = $$1:2$$
290 students of MBA (International Business) in a reputed Business School have to study foreign language in Trimesters IV and V. Suppose the following information are given .
i. 120 students study Spanish
ii. 100 students study Mandarin
iii. At least 80 students, who study a foreign language, study neither Spanish nor Mandarin
Then the number of students who study Spanish but not Mandarin could be any number from
Solution

It's given that 120 students study Spanish : A + B = 120 ...(1)
Also 100 students study Mandarin : B + C = 100 ...(2)
At least 80 students will not opt for any of these two languages i.e.
Spanish + Mandarin $$\leq$$ (290-80)
Spanish + Mandarin $$\leq$$ 210
A + B + C $$\leq$$ 210
Case 2: When B is minimum and A is maximum.
Solving for boundary condition A + B + C = 210 ...(3)
Solving equations (1)+(2)-(3)
B = 10
i.e. A = 120 - B = 120 - 10 =110 {Maximum possible value of A}
Case 2: When B is maximum and A is minimum.
Since B+C = 100 so, Maximum value B can attain is 100. Hence, the minimum value of A = 120 - B = 120 - 100 = 20 {Minimum possible value of A}
So we can say that the number of students who study Spanish but not Mandarin will be A [20 ,110].
A right circular cylinder has a height of 15 and a radius of 7. A rectangular solid with a height of 12 and a square base, is placed in the cylinder such that each of the corners of the solid is tangent to the cylinder wall. Liquid is then poured into the cylinder such that it reaches the rim. The volume of the liquid is
Solution
Volume of liquid = Volume of cylinder - Volume of rectangular solid

Volume of cylinder = $$\pi*r^{2}*h$$
=$$\pi*7^{2}*15$$ = $$735\pi$$
Volume of rectangular solid = Area of square base * height
In square ABCD, AC = $$\sqrt{2}$$*AB so AB = $$\frac{14 }{\sqrt{2}}$$ = $$7\sqrt{2}$$
Volume of rectangular solid = Area of square base * height = $$(AB)^{2}$$*height = $$(7\sqrt{2})^{2}*12$$
= $$98*12$$ = $$1176$$
So Volume of liquid = Volume of cylinder - Volume of rectangular solid
= $$735\pi$$ - $$1176$$ = $$147(5π-8)$$
A reputed paint company plans to award prizes to its top three salespersons, with the highest prize going to the top salesperson, the next highest prize to the next salesperson and a smaller prize to the third-ranking salesperson. If the company has 15 salespersons, how many different arrangements of winners are possible (Assume there are no ties)?
Solution
In this case first we have to select the top three salesmen out of 15 and then arrange them as first, second and third.
∴ Number of arrangements = 15C3 × 3! = 2730
What is the sum of integers 54 through 196 inclusive?
Solution
Sum of integers from 54 to 196 = (sum of integers from 1 to 196) - (sum of integers from 1 to 53)
Sum of first N natural numbers = (N)(N+1)/2
Sum from 1 to 196 = (196)(197)/2 = 98 × 197 = 19306
Sum from 1 to 53 = (53)(54)/2 = 53 × 27 = 1431
Sum of integers from 54 to 196 = 19306 - 1431 = 17875
The student mess committee of a reputed Engineering College has n members. Let P be the event that the Committee has students of both sexes and let Q be the event that there is at most one female student in the committee. Assuming that each committee member has probability 0.5 of being female, the value of n for which the events P and Q are independent is
Solution
Let's first estimate the sample space. In a committee of n members, there can be the following cases:
(0 males, n females), (1 male, n-1 females), (2 males, n-2 females) ...(n males, 0 females).
Thus, the sample space has n+1 cases.
n(S) = n+1 cases
Barring 2 cases from the sample space, event P occurs for all other cases.
=> n(P) = n+1-2 = n-1 cases
=> p(P) = (n-1)/(n+1)
At most 1 female can be expressed as the sum of the cases exactly 0 females and exactly 1 female.
=> n(Q) = 2 cases
=> p(Q) = 2/(n+1)
The set $$P \cap Q$$ occurs when there is exactly one female member.
Hence, n($$P \cap Q$$) = 1
p($$P \cap Q$$) = 1/(n+1)
When two events are independent, the probability of both of them occurring is equal to the product of their individual probabilities.
Thus,
p($$P \cap Q$$) = p(P) * p(Q)
1/(n+1) = (n-1)/(n+1) * 2/(n+1)
=> n+1 = 2n -2
=> n= 3
A multi-storied office building has a total of 17 rows of parking spaces. There are 20 parking spaces in the first row and 21 parking spaces in the second row. In each subsequent row, there are 2 more parking spaces than in the previous row. The total number of parking spaces in the office building is
Solution
$$R_{1}$$= 20 , $$R_{2}$$= 21 , $$R_{3}$$= 23 ...
Sum = $$20+$$ $$\underbrace{21+23+...upto 16 terms}$$
So apart from first term the above mentioned sum represents an Arithmetic Progression that has 16 terms.
Sum of A.P. = $$\frac{16}{2}[2(21)+(16-1)2]$$ = 576
So total number of parking spaces = 20+576 = 596
The highest number amongst $$\sqrt{2}, \sqrt[3]{3},$$ and $$\sqrt[4]{4}$$ is
Solution
Given that
a = $$\sqrt{2}, b = \sqrt[3]{3},$$ and c = $$\sqrt[4]{4}$$
a = $$(2)^{\frac{1}{2}}$$, b = $$(3)^{\frac{1}{3}}$$ and c = $$(4)^{\frac{1}{4}}$$
Taking log both sides $$\log_{}{a}$$ = $$\log_{}{(2)^{1/2}}$$ , $$\log_{}{b} = \log_{}{(3)^{1/3}}$$ , $$\log_{}{c} = \log_{}{(4)^{1/4}}$$
we know that ($$\log_{}{2}$$ = 0.3010 , $$\log_{}{3}$$ = 0.4771 , $$\log_{}{4}$$ = $$2\log_{}{2}$$ =0.6020)
Substituting these values
$$\log_{}{a}$$ = $$\frac{1}{2}$$*0.3010 , $$\log_{}{b}$$ =$$\frac{1}{3}$$*0.4771 , $$\log_{}{c}$$= $$\frac{1}{4}$$*0.6020
$$\log_{}{a}$$ = 0.1505 , $$\log_{}{b}$$ = 0.1590 , $$\log_{}{c}$$= 0.1505
We know that if $$A_{1}$$ > $$A_{2}$$ > $$A_{3}$$ > 1 Then $$log_{}{A_{1}}$$ > $$log_{}{A_{2}}$$ > $$log_{}{A_{3}}$$
Here clearly $$log_{}{b}$$ > $$log_{}{a}$$ = $$log_{}{c}$$ hence we can say that b = $$\sqrt[3]{3}$$ is the highest number among all.
Alternate method:
a = $$\sqrt{2}, b = \sqrt[3]{3},$$ and c = $$\sqrt[4]{4}$$
$$a^{12} = 2^6, b^{12} = 3^4, c^{12} = 4^3$$
$$a^{12} = 64, b^{12} = 81, c^{12} = 64$$
We can see that $$b^{12}$$ > $$c^{12}$$ = $$a^{12}$$
Also, a, b, c > 1. Hence, we can say that b > a = c.
*** Point to remember ------ $$\sqrt[N]{N}$$ is highest for N=3 (N being natural number) ***
In an MBA entrance examination, a minimum is to be secured in each of the 6 sections to qualify the cut-offs. In how many ways can a candidate fail to secure the cut-offs?
Solution
Number of ways in which the candidate can secure the cut-offs in all 6 sections = $$6C_{6}$$ = 1
Number of ways of securing marks in 6 sections
= $$6C_{0} + 6C_{1} + 6C_{2} + 6C_{3} + 6C_{4} + 6C_{5} + 6C_{6}$$
= $$2^{6}$$ = 64
Thus, the number of ways in which he fails to secure the cut offs in at least one section = 64 − 1 = 63
The sum of 4+44+444+.... upto n terms in
Solution
Given that, S = 4+44+444+...
$$\Rightarrow$$ $$S = \frac{4}{9}(9+99+999+...)$$
$$\Rightarrow$$ $$S = \frac{4}{9}(10-1+10^2-1+10^3-1+...+10^n-1)$$
$$\Rightarrow$$ $$S = \frac{4}{9}(10+10^2+10^3+...+10^n-n)$$
$$\Rightarrow$$ $$S = \frac{4}{9}(\frac{10(10^n - 1)}{10-1}-n)$$
$$\Rightarrow$$ $$S = \frac{40}{81}(10^n - 1) - \frac{4n}{9}$$
Hence, option C is the correct answer.
Alternate method:
Solving for n = 2
Sum of series = 4+44 = 48
Substituting n = 2 in options
(A) $$\frac{40}{81}(8^{2}-1)-\frac{5*2}{9}$$ = $$\frac{280-10}{9}$$ = 30
(B) $$\frac{40}{81}(8^{2}-1)-\frac{4*2}{9}$$ = $$\frac{280-8}{9}$$ = $$\frac{272}{9}$$
(C) $$\frac{40}{81}(10^{2}-1)-\frac{4*2}{9}$$ = $$\frac{440-8}{9}$$ = 48
(D) $$\frac{40}{81}(10^{2}-1)-\frac{5*2}{9}$$ = $$\frac{440-10}{9}$$ = $$\frac{430}{9}$$
Suppose the two sides of a square are along the straight lines 6x - 8y = 15 and 4y - 3x = 2. Then the area of the square is
Solution
The two lines are 4y - 3x = 2 ...(1)
and 6x - 8y= 15
4y - 3x= -7.5 ...(2)
As we can see $$\frac{a_{1}}{a_{2}}$$ = $$\frac{b_{1}}{b_{2}}$$ $$\neq$$ $$\frac{c_{1}}{c_{2}}$$; these two lines are parallel to each other.Hence the distance between these two parallel lines will be the side of the square i.e.
d = $$\frac{|c_{1} - c_{2}|}{\sqrt{a^{2}+b^{2}}}$$ (here a = -3, b = 4 c_{1} = 2 c_{2} = -7.5 )
d = $$\frac{2-(-7.5)}{\sqrt{(-3)^{2}+(4)^{2}}}$$ = $$\frac{9.5}{5}$$ = 1.9
The distance between the parallel lines will be equal to the length of side of the square.
$$\therefore$$ Area of square = (1.9)^{2} = 3.61 Sq. units

