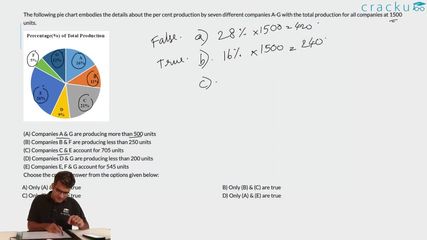
The following pie chart embodies the details about the per cent production by seven different companies A-G with the total production for all companies at 1500 units.
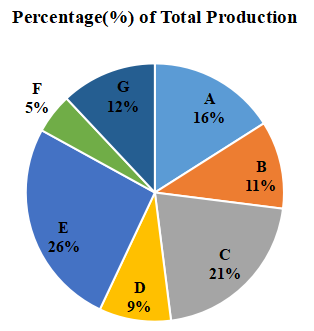
(A) Companies A & G are producing more than 500 units
(B) Companies B & F are producing less than 250 units
(C) Companies C & E account for 705 units
(D) Companies D & G are producing less than 200 units
(E) Companies E, F & G account for 545 units
Choose the correct answer from the options given below:
Solution
Total production = 1500 units
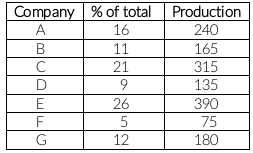
A) A and G production = 240 + 180 = 420 (not greater than 500)
B) B and F production = 165 + 75 = 240 ( is less than 250)
C) C and E production = 315 + 390 = 705
D) D and G production = 135 +180 = 315 ( not less than 200)
E) E, F and G production = 390 + 75 + 180 = 645 ( not equal to 545)
Only (B) and (C) are true.
Answer is option B.
Get AI Help
Video Solution
Click on the Email ☝️ to Watch the Video Solution
Create a FREE account and get:
- All Quant Formulas and shortcuts PDF
- 40+ previous papers with detau solutions PDF
- Top 500 MBA exam Solved Questions for Free

CMAT Quant Questions | CMAT Quantitative Ability
CMAT DILR Questions | LRDI Questions For CMAT
CMAT Verbal Ability Questions | VARC Questions For CMAT
Free CMAT Quant Questions
Related Formulas With Tests
Book Free CAT Mentorship
Get personalized CAT strategy from a 99%iler
500+ students mentored
OTP Verification
Enter the 6-digit code sent to your phone
Booking Summary
Enter OTP
Didn't receive the OTP?


